
4
Follow
1
Followers
Graphique. Questions sur les graphiques
Created 2019-08-09 05:35:29 Updated 2019-08-09 05:39:52
3
2182
Je ne sais pas si vous avez déjà entendu parler de cela.
-
Si vous voulez que la stratégie affiche deux icônes, je vais essayer de créer deux objets de diagramme, en ajoutant des données et en enlevant des données.
Il semble que cela ne fonctionne pas, ou que cela apparaît sur un graphique. -
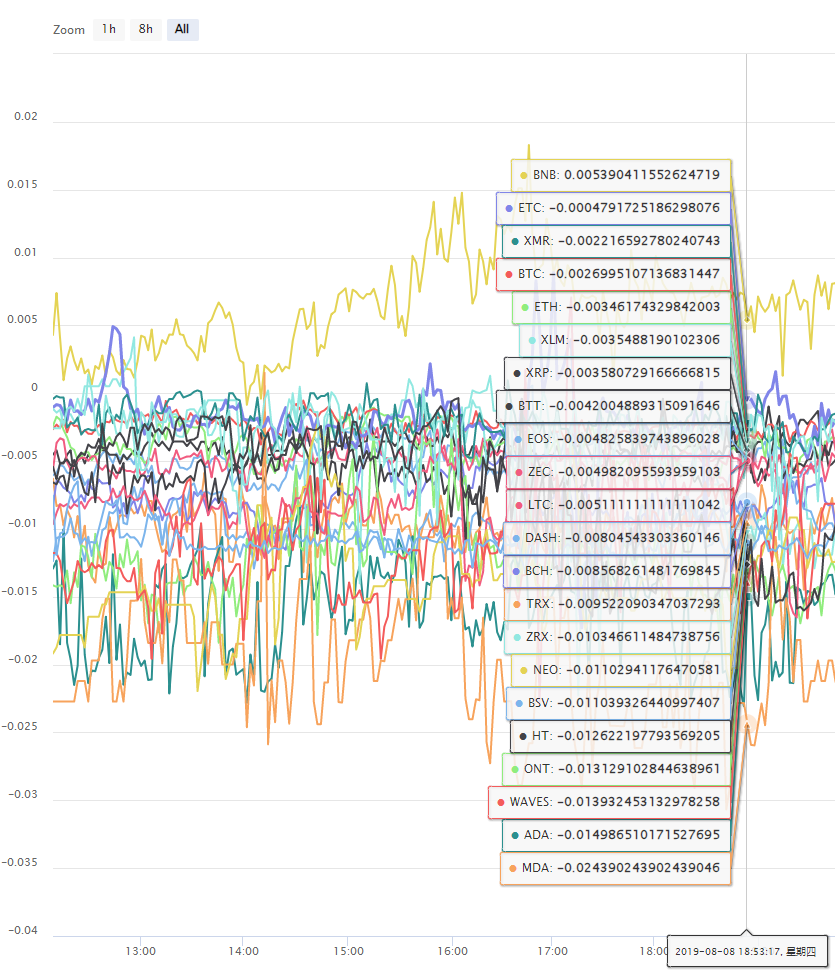
Si vous affichez un grand nombre de courbes dans un tableau, et que vous ne pouvez pas les voir (voir ci-dessous), est-ce que vous pouvez choisir de visualiser chaque courbe ?
Merci beaucoup.
Related Recommendations
Get Started with FMZ Quant PlatformSECURITY BUGI keep getting error: Exchange_GetAccount: Invalid ContractTypeWe have an incredibly profitable market making algorithm for sideways markets on Bitmex - but need expert to help eliminate wait times during downward volatility in the marketError with deribitLimitations of the backtesting engineHow to install ta-lib on linux docker?5.5 Trading strategy optimization5.4 Why do we need an off-sample test5.3 How to read the strategy backtest performance report
Comment
All comments (3)

可以显示两个图表,在策略广场有范例:
https://www.fmz.com/strategy/136056
https://www.fmz.com/strategy/38203
7 years ago
- 1