Stratégie de swing trading en mode triple

Aperçu
Une stratégie de trading basée sur une combinaison d'indicateurs techniques. La stratégie combine les indicateurs de tendance supérieure, les moyennes hybrides SSL et les indicateurs QQE améliorés pour former un signal de trading stable. Elle s'applique aux variétés de trading à forte volatilité telles que les devises numériques et les actions, qui se comportent particulièrement bien après les périodes de rupture.
Le principe
Signaux d'entrée
Il a été élu président de l'Assemblée Nationale.
- La super tendance est passée de zéro
- Le prix de clôture sur la ligne de base mixte SSL
- La version améliorée de QQE est en bleu ((multi-têtes))
Le dépôt est vide:
- La super tendance a été déclenchée par une inversion
- Le prix de clôture est en dessous de la ligne de base mixte SSL
- La version améliorée de QQE est en rouge (avec un en-tête vide)
Signaux de sortie
La tendance est à la hausse, mais elle ne s'est pas améliorée.
La tendance des supermarchés est à zéro
Arrêt des pertes
Vous pouvez choisir de mettre un stop au pourcentage, un stop au ATR ou un stop au plus bas et au plus haut prix le plus proche.
Arrêtez de pleurer
Retour sur le taux de stop-loss réglable pour calculer automatiquement le prix de stop-loss
Gestion des fonds
Option d'utiliser ou non la logique de gestion des fonds pour contrôler la taille de la position
Le dessin
- Dessiner une ligne de tendance super et un canal homogène hybride SSL
- Vous pouvez choisir de tracer ou non une ligne d'équilibre EMA
- Planifier des lignes d'ouverture, d'arrêt et de perte
- Dessiner une étiquette de dépôt à plusieurs têtes vides
Les avantages
- Une combinaison d'indicateurs multiples pour un signal de négociation stable
La combinaison de supertrends, de la moyenne hybride SSL et de l'indicateur de version améliorée QQE, de différents indicateurs mutuellement vérifiés, permet de filtrer les fausses percées et de former un signal de transaction de haute qualité.
- Des transactions à choc adaptées aux variétés volatiles
La stratégie utilise une méthode de négociation en ligne courte, axée sur la capture des fluctuations de prix en ligne courte. La supertrend permet de suivre efficacement la tendance des prix, tandis que la ligne moyenne hybride SSL permet d'identifier clairement les niveaux de pression de soutien, qui peuvent être utilisés en combinaison pour tirer profit des conditions de choc.
- Plusieurs modes de résiliation
Le stop loss peut choisir un pourcentage, une valeur ATR ou une valeur maximale récente. Le stop loss peut définir un ratio de rendement. La gestion des fonds peut contrôler la position.
- Une carte claire
La carte de stratégie affiche clairement et visuellement les niveaux de stop loss et de stop loss. La marque de la ligne d'ouverture est facile à reconnaître.
Risque et optimisation
- Une petite perte possible
En raison de l'utilisation de la courte ligne de négociation, il est impossible d'éviter complètement les petites pertes de type choc ordinaire. La marge de stop-loss peut être assouplie de manière appropriée et la logique de gestion des fonds peut être optimisée.
- Risque de fausse percée
Des signaux erronés peuvent être générés lorsque des fausses ruptures se produisent. Des EMAs de différentes périodes peuvent être testées pour filtrer les fausses ruptures ou pour optimiser les paramètres de l'indicateur de reconnaissance de la tendance.
- Risque de défaillance des indicateurs de surveillance
Si l'indicateur de base ne fonctionne pas, il y a plusieurs signaux d'erreur. Il faut vérifier régulièrement l'efficacité de l'indicateur et corriger les problèmes en temps opportun.
- Optimiser le cycle de retour
Le cycle de rétroaction actuel est un cycle de temps fixe qui ne peut pas correspondre à un cycle de marché différent de la variété. Il est recommandé d'optimiser pour correspondre à un cycle de temps de négociation du contractant.
- Optimiser l'adaptation des variétés
Les paramètres de la stratégie peuvent être ajustés en fonction des caractéristiques des différentes variétés de données pour améliorer la probabilité de gagner des positions longues et courtes. Il est recommandé d'utiliser une méthode d'optimisation progressive pour comparer l'impact des différents paramètres sur la stratégie.
Résumer
Cette stratégie utilise plusieurs indicateurs pour former un signal de transaction en combinaison, permettant un filtrage efficace des fausses percées, adapté aux monnaies numériques et aux actions individuelles plus volatiles. En même temps, il offre plusieurs options de stop-loss et de stop-loss, avec une utilisation flexible.
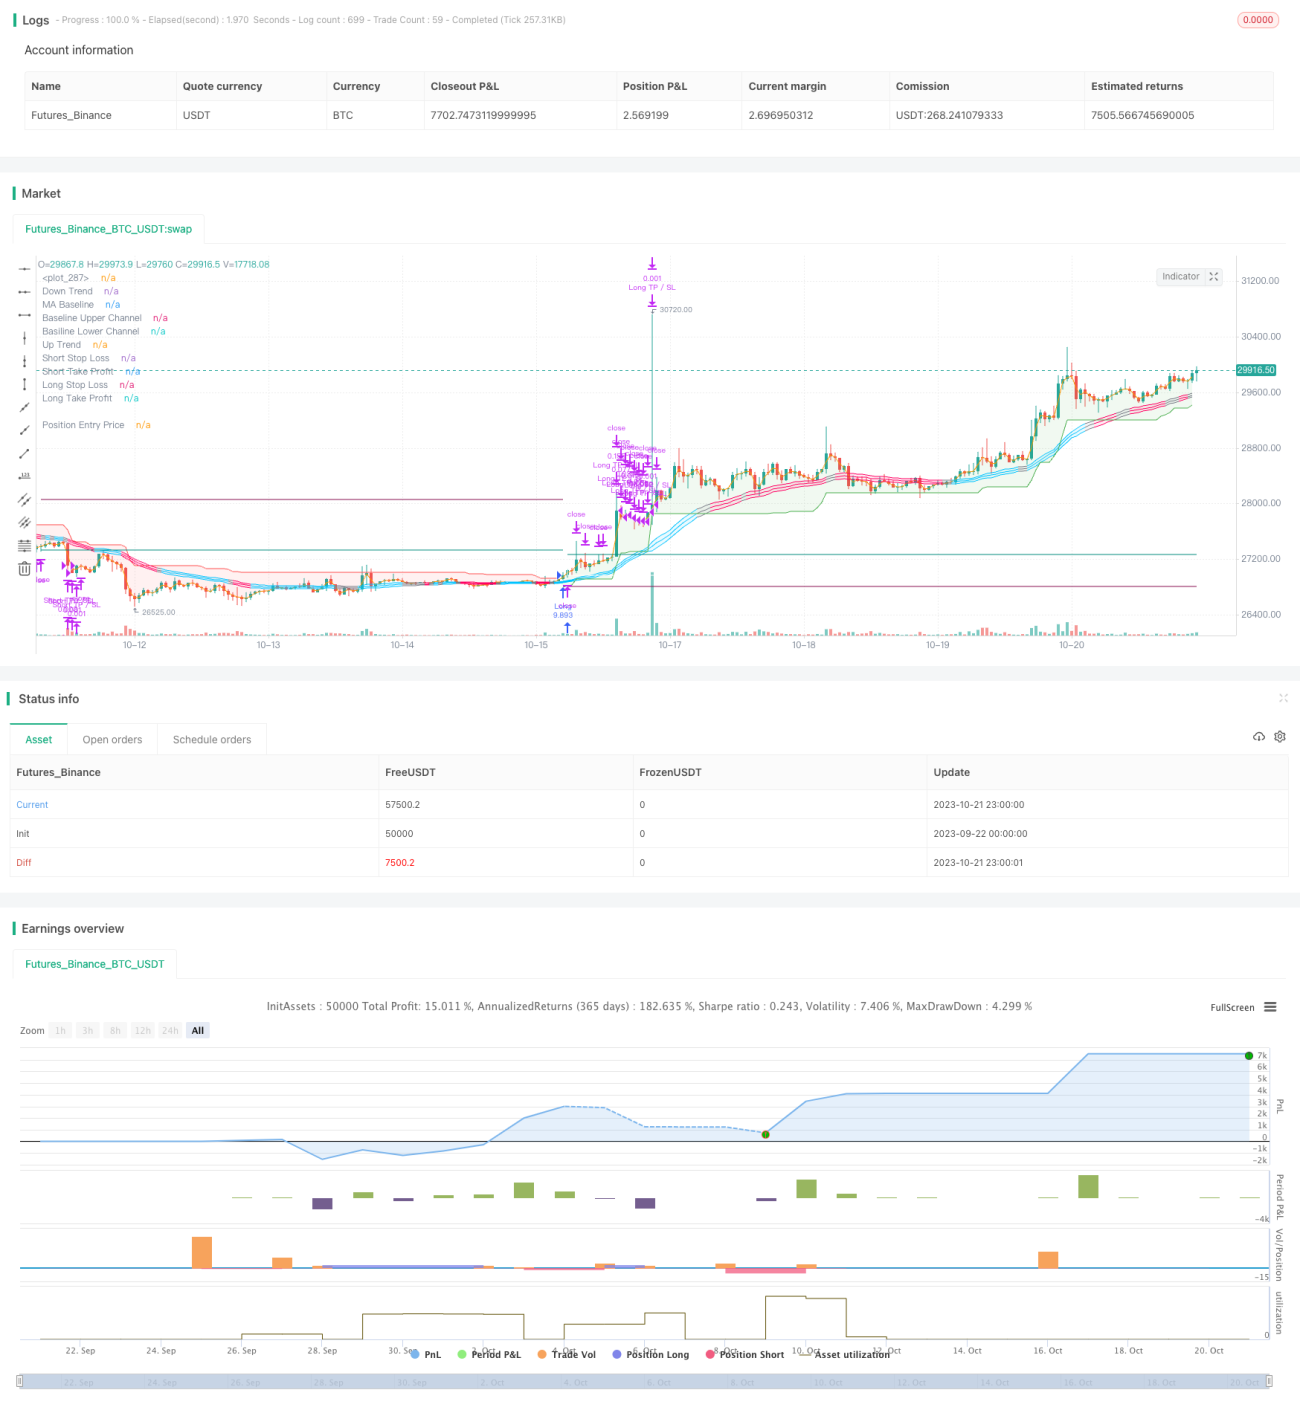
/*backtest
start: 2023-09-22 00:00:00
end: 2023-10-22 00:00:00
period: 1h
basePeriod: 15m
exchanges: [{"eid":"Futures_Binance","currency":"BTC_USDT"}]
*/

// This source code is subject to the terms of the Mozilla Public License 2.0 at https://mozilla.org/MPL/2.0/
// © fpemehd
// Thanks to myncrypto, jason5480, kevinmck100
// @version=5- 1