Stratégie de trading de croisement multiple de moyenne mobile de fusion


Date de création: 2023-12-20 14:12:20 Dernière modification: 2023-12-20 14:12:20
Copier: 0 Nombre de clics: 632
1
Suivre
1621
Abonnés

Stratégie de trading de croisement multiple de moyenne mobile de fusion

Aperçu

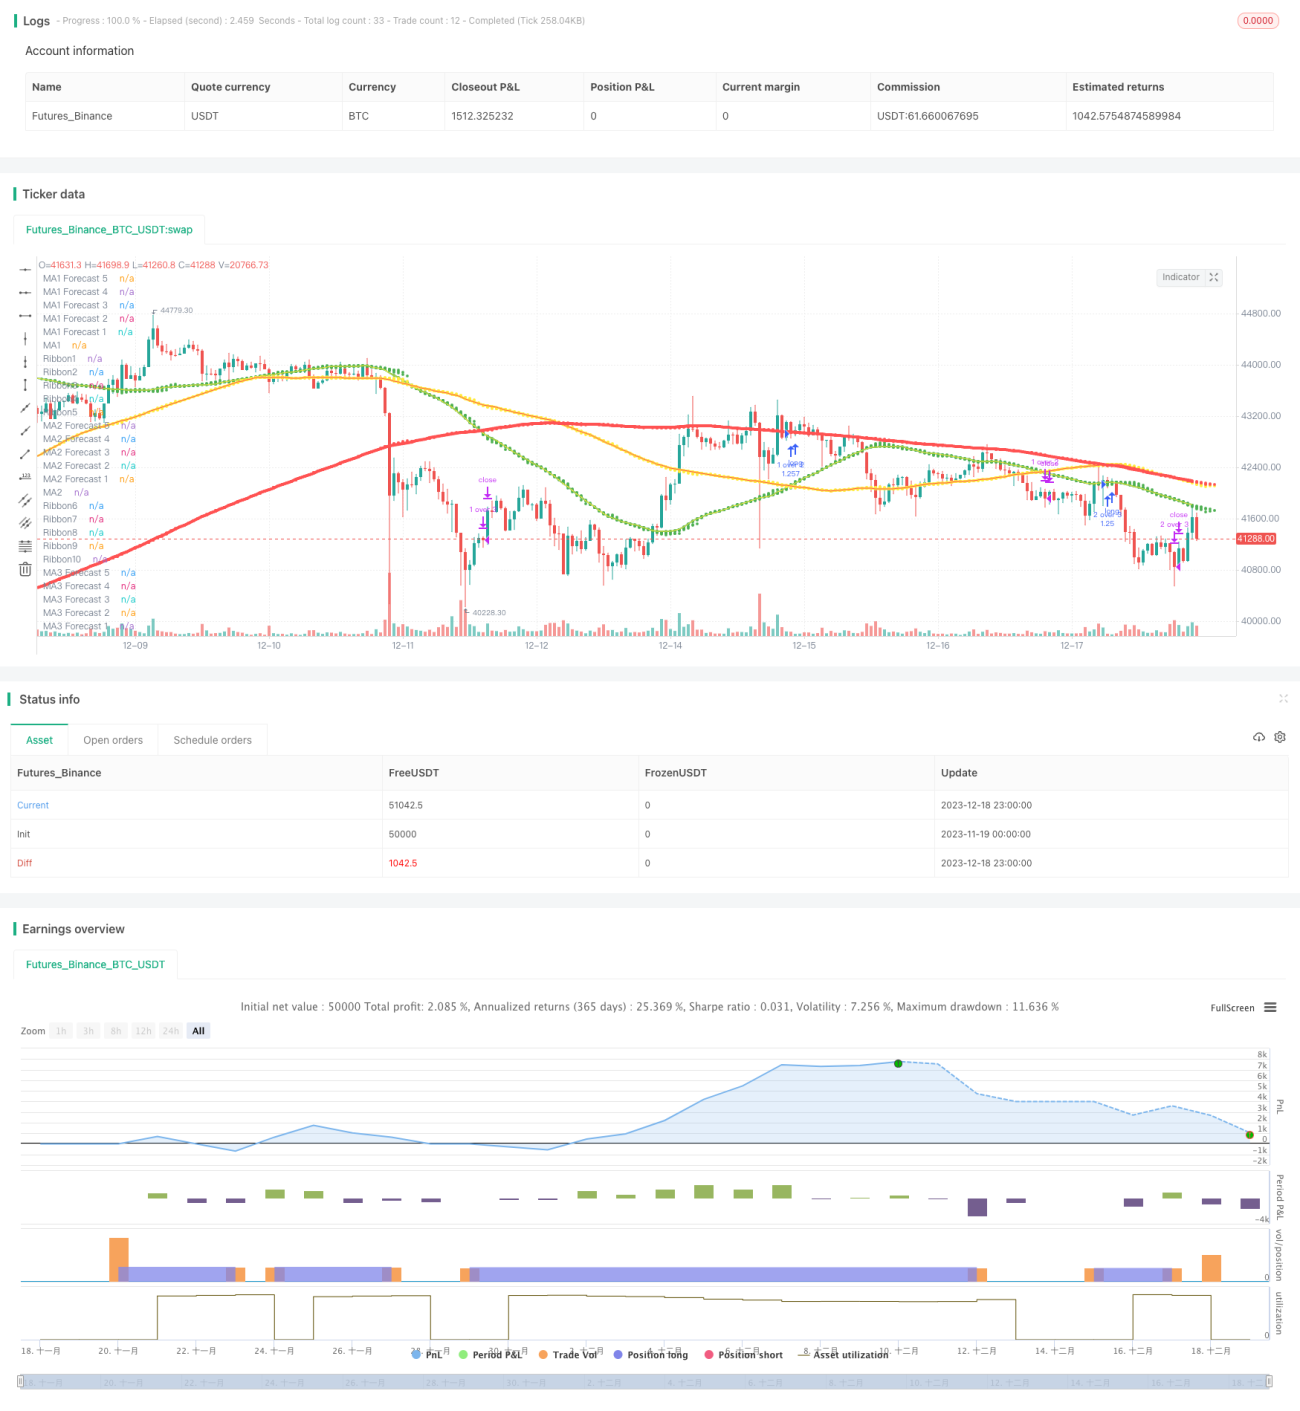
La stratégie est une stratégie de négociation basée sur le croisement de trois moyennes mobiles (MA1, MA2, MA3). Une combinaison de stratégies de négociation flexible peut être obtenue en définissant le type, la période, la source de données et la résolution des trois moyennes mobiles, ainsi que si le croisement entre elles est autorisé.

Le principe

Cette stratégie utilise principalement les signaux de croisement et de sous-titres produits entre les trois moyennes mobiles comme signaux de négociation. Un signal de placement est généré lorsque les moyennes mobiles à plus courte période traversent les moyennes mobiles à plus longue période de manière ascendante vers le bas; un signal de placement est généré lorsque les moyennes mobiles à plus courte période traversent les moyennes mobiles à plus longue période de manière ascendante vers le bas.

L’utilisateur est libre de choisir entre trois types de moyennes mobiles (SMA, EMA, etc.), des périodes, des sources de données de prix (closing price, maximum price, etc.) et la résolution de la ligne K (minute, jour, etc.). Il peut également choisir d’ouvrir ou non des transactions croisées entre chaque moyenne mobile pour décider si des actions de négociation doivent être effectuées sur certaines croisées.

La stratégie est actuellement plus simple, en utilisant le prix du marché pour ouvrir et fermer des positions. Chaque transaction est financée à 100% du capital total du compte.

Les avantages

  1. Le type et la période des moyennes mobiles peuvent être choisis librement pour optimiser et combiner les paramètres, réduisant ainsi le risque de correspondance de la courbe.
  2. La croisée de plusieurs moyennes mobiles peut créer plusieurs opportunités de trading et augmenter la fréquence des transactions.
  3. Les moyennes mobiles à longue, moyenne et courte périodes permettent d’équilibrer les tendances et les inversions.
  4. Prise en charge de différentes résolutions de lignes K, permettant une analyse sur plusieurs périodes
  5. Fonctionnalité de prévision à bande, permettant de tester l’effet de la correspondance des paramètres

Les risques

  1. Les combinaisons de paramètres massives peuvent conduire à une optimisation excessive
  2. Fréquence de transaction élevée, susceptible d’augmenter les frais de transaction et les coûts des points de glissement
  3. Le prix du billet n’est pas limité
  4. Les moyennes mobiles multiples peuvent donner lieu à des signaux de conflit
  5. Différences entre les performances de détection et de disque dur

Conseils d’optimisation

  1. Les paramètres valides sont obtenus à l’aide de l’analyse de marche en avant
  2. Ajout de frais de transaction et de coût de dérapage dans la rétroévaluation
  3. Essayez de remplacer le prix du marché par le prix limite.
  4. Augmentation des conditions de filtrage pour éviter les signaux de conflit
  5. Stratégies de validation dans des réponses simulées dans des environnements réels

Résumer

La stratégie utilise les caractéristiques lisses des moyennes mobiles et les capacités de reconnaissance des modèles des signaux croisés. L’utilisateur peut choisir les paramètres de manière flexible, en équilibrant le suivi de la tendance et la reconnaissance du renversement. Il est également nécessaire de veiller à la maîtrise des risques optimisés pour vérifier la solidité de la stratégie dans un marché complexe simulant un environnement réel.

Code source de la stratégie
/*backtest
start: 2023-11-19 00:00:00
end: 2023-12-19 00:00:00
period: 1h
basePeriod: 15m
exchanges: [{"eid":"Futures_Binance","currency":"BTC_USDT"}]
*/

//@version=4 

//
// Pine Script v4
// @author BigBitsIO
// Script Library: https://www.tradingview.com/u/BigBitsIO/#published-scripts
//

// study(title, shorttitle, overlay, format, precision)
// https://www.tradingview.com/pine-script-reference/#fun_strategy 
strategy(shorttitle = "TManyMA Strategy - ST9 - Long Market Only", title="Triple Many Moving Averages", overlay=true, pyramiding=1, default_qty_type=strategy.percent_of_equity, default_qty_value=100)

// MA#Period is a variable used to store the indicator lookback period.  In this case, from the input.
// input - https://www.tradingview.com/pine-script-docs/en/v4/annotations/Script_inputs.html
MA1Period = input(50, title="MA1 Period", minval=1, step=1)
MA1Type = input(title="MA1 Type", defval="SMA", options=["RMA", "SMA", "EMA", "WMA", "HMA", "DEMA", "TEMA", "VWMA"])
MA1Source = input(title="MA1 Source", type=input.source, defval=close)
MA1Resolution = input(title="MA1 Resolution", defval="00 Current", options=["00 Current", "01 1m", "02 3m", "03 5m", "04 15m", "05 30m", "06 45m", "07 1h", "08 2h", "09 3h", "10 4h", "11 1D", "12 1W", "13 1M"])
MA1Visible = input(title="MA1 Visible", type=input.bool, defval=true) // Will automatically hide crossBovers containing this MA

MA2Period = input(100, title="MA2 Period", minval=1, step=1)
MA2Type = input(title="MA2 Type", defval="SMA", options=["RMA", "SMA", "EMA", "WMA", "HMA", "DEMA", "TEMA", "VWMA"])
MA2Source = input(title="MA2 Source", type=input.source, defval=close)
MA2Resolution = input(title="MA2 Resolution", defval="00 Current", options=["00 Current", "01 1m", "02 3m", "03 5m", "04 15m", "05 30m", "06 45m", "07 1h", "08 2h", "09 3h", "10 4h", "11 1D", "12 1W", "13 1M"])
MA2Visible = input(title="MA2 Visible", type=input.bool, defval=true) // Will automatically hide crossovers containing this MA

MA3Period = input(200, title="MA3 Period", minval=1, step=1)
MA3Type = input(title="MA3 Type", defval="SMA", options=["RMA", "SMA", "EMA", "WMA", "HMA", "DEMA", "TEMA", "VWMA"])
MA3Source = input(title="MA3 Source", type=input.source, defval=close)
MA3Resolution = input(title="MA3 Resolution", defval="00 Current", options=["00 Current", "01 1m", "02 3m", "03 5m", "04 15m", "05 30m", "06 45m", "07 1h", "08 2h", "09 3h", "10 4h", "11 1D", "12 1W", "13 1M"])
MA3Visible = input(title="MA3 Visible", type=input.bool, defval=true) // Will automatically hide crossovers containing this MA

ShowCrosses = input(title="Show Crosses", type=input.bool, defval=false)

ForecastBias = input(title="Forecast Bias", defval="Neutral", options=["Neutral", "Bullish", "Bearish"])
ForecastBiasPeriod = input(14, title="Forecast Bias Period")
ForecastBiasMagnitude = input(1, title="Forecast Bias Magnitude", minval=0.25, maxval=20, step=0.25)
ShowForecasts = input(title="Show Forecasts", type=input.bool, defval=true)

ShowRibbons = input(title="Show Ribbons", type=input.bool, defval=true)

TradeMA12Crosses = input(title="Trade MA 1-2 Crosses", type=input.bool, defval=true)
TradeMA13Crosses = input(title="Trade MA 1-3 Crosses", type=input.bool, defval=true)
TradeMA23Crosses = input(title="Trade MA 2-3 Crosses", type=input.bool, defval=true)


// MA# is a variable used to store the actual moving average value.
// if statements - https://www.tradingview.com/pine-script-reference/#op_if
// MA functions - https://www.tradingview.com/pine-script-reference/ (must search for appropriate MA)
// custom functions in  pine - https://www.tradingview.com/wiki/Declaring_Functions
ma(MAType, MASource, MAPeriod) =>
    if MAType == "SMA"
        ta.sma(MASource, MAPeriod)
    else
        if MAType == "EMA"
            ta.ema(MASource, MAPeriod)
        else
            if MAType == "WMA"
                ta.wma(MASource, MAPeriod)
            else
                if MAType == "RMA"
                    ta.rma(MASource, MAPeriod)
                else
                    if MAType == "HMA"
                        ta.wma(2*wma(MASource, MAPeriod/2)-ta.wma(MASource, MAPeriod), round(sqrt(MAPeriod)))
                    else
                        if MAType == "DEMA"
                            e = ta.ema(MASource, MAPeriod)
                            2 * e - ta.ema(e, MAPeriod)
                        else
                            if MAType == "TEMA"
                                e = ta.ema(MASource, MAPeriod)
                                3 * (e - ta.ema(e, MAPeriod)) + ta.ema(ema(e, MAPeriod), MAPeriod)
                            else
                                if MAType == "VWMA"
                                    ta.vwma(MASource, MAPeriod)
                                
res(MAResolution) =>
    if MAResolution == "00 Current"
        timeframe.period
    else
        if MAResolution == "01 1m"
            "1"
        else
            if MAResolution == "02 3m"
                "3"
            else
                if MAResolution == "03 5m"
                    "5"
                else
                    if MAResolution == "04 15m"
                        "15"
                    else
                        if MAResolution == "05 30m"
                            "30"
                        else
                            if MAResolution == "06 45m"
                                "45"
                            else
                                if MAResolution == "07 1h"
                                    "60"
                                else
                                    if MAResolution == "08 2h"
                                        "120"
                                    else
                                        if MAResolution == "09 3h"
                                            "180"
                                        else
                                            if MAResolution == "10 4h"
                                                "240"
                                            else
                                                if MAResolution == "11 1D"
                                                    "1D"
                                                else
                                                    if MAResolution == "12 1W"
                                                        "1W"
                                                    else
                                                        if MAResolution == "13 1M"
                                                            "1M"

// https://www.tradingview.com/pine-script-reference/#fun_request.security
MA1 = request.security(syminfo.tickerid, res(MA1Resolution), ma(MA1Type, MA1Source, MA1Period))     
MA2 = request.security(syminfo.tickerid, res(MA2Resolution), ma(MA2Type, MA2Source, MA2Period))
MA3 = request.security(syminfo.tickerid, res(MA3Resolution), ma(MA3Type, MA3Source, MA3Period))   
                    
// Plotting crossover/unders for all combinations of crosses
// Crossovers no longer detected in label code, they need to be re-used for strategy - crosses and visibility must be set
MA12Crossover = MA1Visible and MA2Visible and ta.crossover(MA1, MA2)
MA12Crossunder = MA1Visible and MA2Visible and ta.crossunder(MA1, MA2)
MA13Crossover = MA1Visible and MA3Visible and ta.crossover(MA1, MA3)
MA13Crossunder = MA1Visible and MA3Visible and ta.crossunder(MA1, MA3)
MA23Crossover = MA2Visible and MA3Visible and ta.crossover(MA2, MA3)
MA23Crossunder = MA2Visible and MA3Visible and ta.crossunder(MA2, MA3)

// https://www.tradingview.com/pine-script-reference/v4/#fun_label%7Bdot%7Dnew
if ShowCrosses and MA12Crossunder
    lun1 = label.new(bar_index, na, tostring(MA1Period)+' '+MA1Type+' crossed under '+tostring(MA2Period)+' '+MA2Type, 
      color=color.red, 
      textcolor=color.red,
      style=label.style_xcross, size=size.small)
    label.set_y(lun1, MA1)
if ShowCrosses and MA12Crossover
    lup1 = label.new(bar_index, na, tostring(MA1Period)+' '+MA1Type+' crossed over '+tostring(MA2Period)+' '+MA2Type, 
      color=color.green, 
      textcolor=color.green,
      style=label.style_xcross, size=size.small)
    label.set_y(lup1, MA1)
if ShowCrosses and MA13Crossunder
    lun2 = label.new(bar_index, na, tostring(MA1Period)+' '+MA1Type+' crossed under '+tostring(MA3Period)+' '+MA3Type, 
      color=color.red, 
      textcolor=color.red,
      style=label.style_xcross, size=size.small)
    label.set_y(lun2, MA1)
if ShowCrosses and MA13Crossover
    lup2 = label.new(bar_index, na, tostring(MA1Period)+' '+MA1Type+' crossed over '+tostring(MA3Period)+' '+MA3Type, 
      color=color.green, 
      textcolor=color.green,
      style=label.style_xcross, size=size.small)
    label.set_y(lup2, MA1)
if ShowCrosses and MA23Crossunder
    lun3 = label.new(bar_index, na, tostring(MA2Period)+' '+MA2Type+' crossed under '+tostring(MA3Period)+' '+MA3Type, 
      color=color.red, 
      textcolor=color.red,
      style=label.style_xcross, size=size.small)
    label.set_y(lun3, MA2)
if ShowCrosses and MA23Crossover
    lup3 = label.new(bar_index, na, tostring(MA2Period)+' '+MA2Type+' crossed over '+tostring(MA3Period)+' '+MA3Type, 
      color=color.green, 
      textcolor=color.green,
      style=label.style_xcross, size=size.small)
    label.set_y(lup3, MA2) 

// plot - This will draw the information on the chart
// plot - https://www.tradingview.com/pine-script-docs/en/v4/annotations/plot_annotation.html
plot(MA1Visible ? MA1 : na, color=color.green, linewidth=2, title="MA1")
plot(MA2Visible ? MA2 : na, color=color.yellow, linewidth=3, title="MA2")
plot(MA3Visible ? MA3 : na, color=color.red, linewidth=4, title="MA3")


// Forecasting - forcasted prices are calculated using our MAType and MASource for the MAPeriod - the last X candles.
//              it essentially replaces the oldest X candles, with the selected source * X candles
// Bias - We'll add an "adjustment" for each additional candle being forecasted based on ATR of the previous X candles
// custom functions in  pine - https://www.tradingview.com/wiki/Declaring_Functions
bias(Bias, BiasPeriod) =>
    if Bias == "Neutral"
        0
    else
        if Bias == "Bullish"
            (atr(BiasPeriod) * ForecastBiasMagnitude)
        else
            if Bias == "Bearish"
                ((atr(BiasPeriod)  * ForecastBiasMagnitude) * -1) // multiplying by -1 to make it a negative, bearish bias


// Note - Can not show forecasts on different resolutions at the moment, x-axis is an issue
Bias = bias(ForecastBias, ForecastBiasPeriod) // 14 is default atr period
MA1Forecast1 = (request.security(syminfo.tickerid, res(MA1Resolution), ma(MA1Type, MA1Source, MA1Period - 1)) * (MA1Period - 1) + ((MA1Source * 1) + (Bias * 1))) / MA1Period
MA1Forecast2 = (request.security(syminfo.tickerid, res(MA1Resolution), ma(MA1Type, MA1Source, MA1Period - 2)) * (MA1Period - 2) + ((MA1Source * 2) + (Bias * 2))) / MA1Period
MA1Forecast3 = (request.security(syminfo.tickerid, res(MA1Resolution), ma(MA1Type, MA1Source, MA1Period - 3)) * (MA1Period - 3) + ((MA1Source * 3) + (Bias * 3))) / MA1Period
MA1Forecast4 = (request.security(syminfo.tickerid, res(MA1Resolution), ma(MA1Type, MA1Source, MA1Period - 4)) * (MA1Period - 4) + ((MA1Source * 4) + (Bias * 4))) / MA1Period
MA1Forecast5 = (request.security(syminfo.tickerid, res(MA1Resolution), ma(MA1Type, MA1Source, MA1Period - 5)) * (MA1Period - 5) + ((MA1Source * 5) + (Bias * 5))) / MA1Period

plot(MA1Resolution == "00 Current" and ShowForecasts and MA1Visible ? MA1Forecast1 : na, color=color.green, linewidth=1, style=plot.style_circles, title="MA1 Forecast 1", offset=1, show_last=1)
plot(MA1Resolution == "00 Current" and ShowForecasts and MA1Visible ? MA1Forecast2 : na, color=color.green, linewidth=1, style=plot.style_circles, title="MA1 Forecast 2", offset=2, show_last=1)
plot(MA1Resolution == "00 Current" and ShowForecasts and MA1Visible ? MA1Forecast3 : na, color=color.green, linewidth=1, style=plot.style_circles, title="MA1 Forecast 3", offset=3, show_last=1)
plot(MA1Resolution == "00 Current" and ShowForecasts and MA1Visible ? MA1Forecast4 : na, color=color.green, linewidth=1, style=plot.style_circles, title="MA1 Forecast 4", offset=4, show_last=1)
plot(MA1Resolution == "00 Current" and ShowForecasts and MA1Visible ? MA1Forecast5 : na, color=color.green, linewidth=1, style=plot.style_circles, title="MA1 Forecast 5", offset=5, show_last=1)


MA2Forecast1 = (request.security(syminfo.tickerid, res(MA2Resolution), ma(MA2Type, MA2Source, MA2Period - 1)) * (MA2Period - 1) + ((MA1Source * 1) + (Bias * 1))) / MA2Period
MA2Forecast2 = (request.security(syminfo.tickerid, res(MA2Resolution), ma(MA2Type, MA2Source, MA2Period - 2)) * (MA2Period - 2) + ((MA1Source * 2) + (Bias * 2))) / MA2Period
MA2Forecast3 = (request.security(syminfo.tickerid, res(MA2Resolution), ma(MA2Type, MA2Source, MA2Period - 3)) * (MA2Period - 3) + ((MA1Source * 3) + (Bias * 3))) / MA2Period
MA2Forecast4 = (request.security(syminfo.tickerid, res(MA2Resolution), ma(MA2Type, MA2Source, MA2Period - 4)) * (MA2Period - 4) + ((MA1Source * 4) + (Bias * 4))) / MA2Period
MA2Forecast5 = (request.security(syminfo.tickerid, res(MA2Resolution), ma(MA2Type, MA2Source, MA2Period - 5)) * (MA2Period - 5) + ((MA1Source * 5) + (Bias * 5))) / MA2Period

plot(MA2Resolution == "00 Current" and ShowForecasts and MA2Visible ? MA2Forecast1 : na, color=color.yellow, linewidth=1, style=plot.style_circles, title="MA2 Forecast 1", offset=1, show_last=1)
plot(MA2Resolution == "00 Current" and ShowForecasts and MA2Visible ? MA2Forecast2 : na, color=color.yellow, linewidth=1, style=plot.style_circles, title="MA2 Forecast 2", offset=2, show_last=1)
plot(MA2Resolution == "00 Current" and ShowForecasts and MA2Visible ? MA2Forecast3 : na, color=color.yellow, linewidth=1, style=plot.style_circles, title="MA2 Forecast 3", offset=3, show_last=1)
plot(MA2Resolution == "00 Current" and ShowForecasts and MA2Visible ? MA2Forecast4 : na, color=color.yellow, linewidth=1, style=plot.style_circles, title="MA2 Forecast 4", offset=4, show_last=1)
plot(MA2Resolution == "00 Current" and ShowForecasts and MA2Visible ? MA2Forecast5 : na, color=color.yellow, linewidth=1, style=plot.style_circles, title="MA2 Forecast 5", offset=5, show_last=1)


MA3Forecast1 = (request.security(syminfo.tickerid, res(MA3Resolution), ma(MA3Type, MA3Source, MA3Period - 1)) * (MA3Period - 1) + ((MA1Source * 1) + (Bias * 1))) / MA3Period
MA3Forecast2 = (request.security(syminfo.tickerid, res(MA3Resolution), ma(MA3Type, MA3Source, MA3Period - 2)) * (MA3Period - 2) + ((MA1Source * 2) + (Bias * 2))) / MA3Period
MA3Forecast3 = (request.security(syminfo.tickerid, res(MA3Resolution), ma(MA3Type, MA3Source, MA3Period - 3)) * (MA3Period - 3) + ((MA1Source * 3) + (Bias * 3))) / MA3Period
MA3Forecast4 = (request.security(syminfo.tickerid, res(MA3Resolution), ma(MA3Type, MA3Source, MA3Period - 4)) * (MA3Period - 4) + ((MA1Source * 4) + (Bias * 4))) / MA3Period
MA3Forecast5 = (request.security(syminfo.tickerid, res(MA3Resolution), ma(MA3Type, MA3Source, MA3Period - 5)) * (MA3Period - 5) + ((MA1Source * 5) + (Bias * 5))) / MA3Period

plot(MA3Resolution == "00 Current" and ShowForecasts and MA3Visible ? MA3Forecast1 : na, color=color.red, linewidth=1, style=plot.style_circles, title="MA3 Forecast 1", offset=1, show_last=1)
plot(MA3Resolution == "00 Current" and ShowForecasts and MA3Visible ? MA3Forecast2 : na, color=color.red, linewidth=1, style=plot.style_circles, title="MA3 Forecast 2", offset=2, show_last=1)
plot(MA3Resolution == "00 Current" and ShowForecasts and MA3Visible ? MA3Forecast3 : na, color=color.red, linewidth=1, style=plot.style_circles, title="MA3 Forecast 3", offset=3, show_last=1)
plot(MA3Resolution == "00 Current" and ShowForecasts and MA3Visible ? MA3Forecast4 : na, color=color.red, linewidth=1, style=plot.style_circles, title="MA3 Forecast 4", offset=4, show_last=1)
plot(MA3Resolution == "00 Current" and ShowForecasts and MA3Visible ? MA3Forecast5 : na, color=color.red, linewidth=1, style=plot.style_circles, title="MA3 Forecast 5", offset=5, show_last=1)


// Ribbon related code
// For Ribbons to work - they must use the same MAType, MAResolution and MASource.  This is to ensure the ribbons are fair between one to the other.
// Ribbons also will usually look better if MA1Period < MA2Period and MA2Period < MA3Period

// custom functions in  pine - https://www.tradingview.com/wiki/Declaring_Functions
// This function is used to calculate the period to be used on a ribbon based on existing MAs
rperiod(P1, P2, Step, Ribbons) =>
    ((array.abs(P1 - P2)) / (Ribbons + 1) * Step) + math.min(P1, P2)
    // divide by +1 so that 5 lines can show.  Divide by 5 and one line shows up on another MA

// MA1-MA2
Ribbon1 = request.security(syminfo.tickerid, res(MA1Resolution), ma(MA1Type, MA1Source, rperiod(MA1Period, MA2Period, 1, 5)))
Ribbon2 = request.security(syminfo.tickerid, res(MA1Resolution), ma(MA1Type, MA1Source, rperiod(MA1Period, MA2Period, 2, 5)))
Ribbon3 = request.security(syminfo.tickerid, res(MA1Resolution), ma(MA1Type, MA1Source, rperiod(MA1Period, MA2Period, 3, 5)))
Ribbon4 = request.security(syminfo.tickerid, res(MA1Resolution), ma(MA1Type, MA1Source, rperiod(MA1Period, MA2Period, 4, 5)))
Ribbon5 = request.security(syminfo.tickerid, res(MA1Resolution), ma(MA1Type, MA1Source, rperiod(MA1Period, MA2Period, 5, 5)))

plot(ShowRibbons and MA1Type == MA2Type and MA1Resolution == MA2Resolution and MA1Source == MA2Source ? Ribbon1 : na, color=color.green, linewidth=1, style=plot.style_line, title="Ribbon1", transp=90)
plot(ShowRibbons and MA1Type == MA2Type and MA1Resolution == MA2Resolution and MA1Source == MA2Source ? Ribbon2 : na, color=color.green, linewidth=1, style=plot.style_line, title="Ribbon2", transp=85)
plot(ShowRibbons and MA1Type == MA2Type and MA1Resolution == MA2Resolution and MA1Source == MA2Source ? Ribbon3 : na, color=color.green, linewidth=1, style=plot.style_line, title="Ribbon3", transp=80)
plot(ShowRibbons and MA1Type == MA2Type and MA1Resolution == MA2Resolution and MA1Source == MA2Source ? Ribbon4 : na, color=color.yellow, linewidth=1, style=plot.style_line, title="Ribbon4", transp=75)
plot(ShowRibbons and MA1Type == MA2Type and MA1Resolution == MA2Resolution and MA1Source == MA2Source ? Ribbon5 : na, color=color.yellow, linewidth=1, style=plot.style_line, title="Ribbon5", transp=70)

// MA2-MA3
Ribbon6 = request.security(syminfo.tickerid, res(MA2Resolution), ma(MA2Type, MA2Source, rperiod(MA2Period, MA3Period, 1, 5)))
Ribbon7 = request.security(syminfo.tickerid, res(MA2Resolution), ma(MA2Type, MA2Source, rperiod(MA2Period, MA3Period, 2, 5)))
Ribbon8 = request.security(syminfo.tickerid, res(MA2Resolution), ma(MA2Type, MA2Source, rperiod(MA2Period, MA3Period, 3, 5)))
Ribbon9 = request.security(syminfo.tickerid, res(MA2Resolution), ma(MA2Type, MA2Source, rperiod(MA2Period, MA3Period, 4, 5)))
Ribbon10 = request.security(syminfo.tickerid, res(MA2Resolution), ma(MA2Type, MA2Source, rperiod(MA2Period, MA3Period, 5, 5)))
        
plot(ShowRibbons and MA2Type == MA3Type and MA2Resolution == MA3Resolution and MA2Source == MA3Source ? Ribbon6 : na, color=color.yellow, linewidth=1, style=plot.style_line, title="Ribbon6", transp=70)
plot(ShowRibbons and MA2Type == MA3Type and MA2Resolution == MA3Resolution and MA2Source == MA3Source ? Ribbon7 : na, color=color.yellow, linewidth=1, style=plot.style_line, title="Ribbon7", transp=75)
plot(ShowRibbons and MA2Type == MA3Type and MA2Resolution == MA3Resolution and MA2Source == MA3Source ? Ribbon8 : na, color=color.red, linewidth=1, style=plot.style_line, title="Ribbon8", transp=80)
plot(ShowRibbons and MA2Type == MA3Type and MA2Resolution == MA3Resolution and MA2Source == MA3Source ? Ribbon9 : na, color=color.red, linewidth=1, style=plot.style_line, title="Ribbon9", transp=85)
plot(ShowRibbons and MA2Type == MA3Type and MA2Resolution == MA3Resolution and MA2Source == MA3Source ? Ribbon10 : na, color=color.red, linewidth=1, style=plot.style_line, title="Ribbon10", transp=90)

// Strategy Specific
if MA12Crossover and TradeMA12Crosses
    //https://www.tradingview.com/pine-script-reference/#fun_strategy{dot}entry
    strategy.entry("1 over 2", strategy.long, comment="1 over 2")
if MA12Crossunder and TradeMA12Crosses
    //https://www.tradingview.com/pine-script-reference/#fun_strategy{dot}close
    strategy.close("1 over 2")
    
if MA13Crossover and TradeMA13Crosses
    //https://www.tradingview.com/pine-script-reference/#fun_strategy{dot}entry
    strategy.entry("1 over 3", strategy.long, comment="1 over 3")
if MA13Crossunder and TradeMA13Crosses
    //https://www.tradingview.com/pine-script-reference/#fun_strategy{dot}close
    strategy.close("1 over 3")
    
if MA23Crossover and TradeMA23Crosses
    //https://www.tradingview.com/pine-script-reference/#fun_strategy{dot}entry
    strategy.entry("2 over 3", strategy.long, comment="2 over 3")
if MA23Crossunder and TradeMA23Crosses
    //https://www.tradingview.com/pine-script-reference/#fun_strategy{dot}close
    strategy.close("2 over 3")