Stratégie de suivi de tendance avec moyenne mobile double et croisement StochRSI
Aperçu
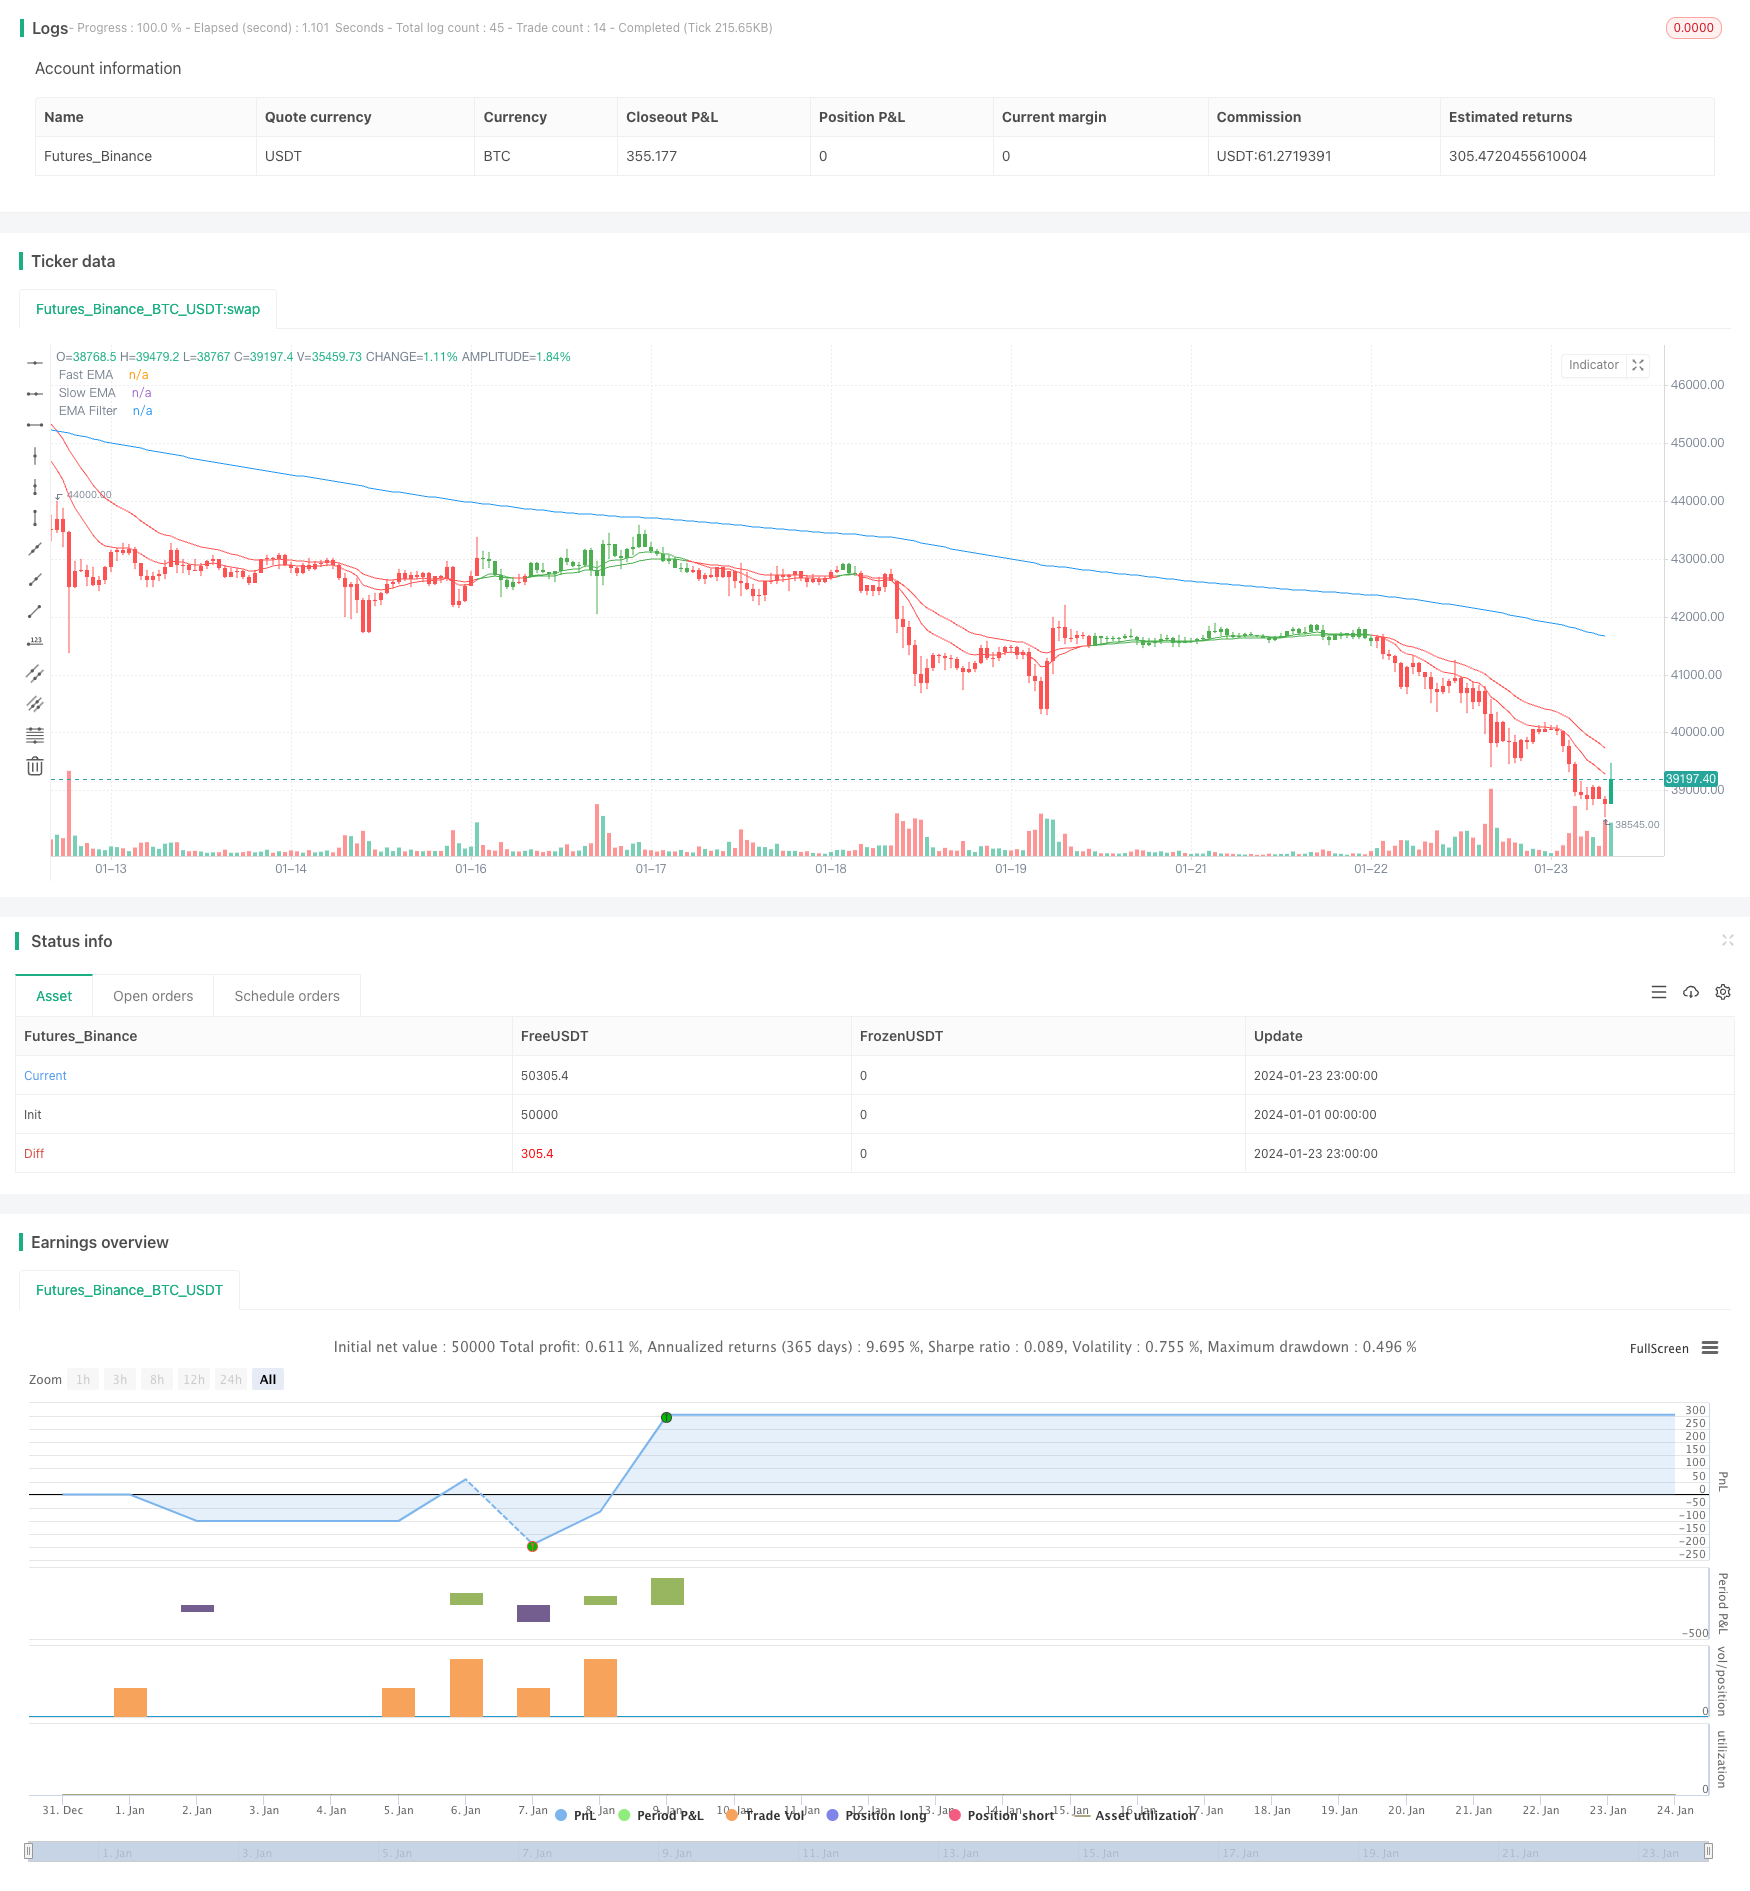
La stratégie utilise en combinaison les moyennes mobiles doubles et le StochRSI pour identifier la direction de la tendance et les points d’entrée. La principale caractéristique est que l’on peut entrer sur le marché au début de la tendance, tout en utilisant les caractéristiques de survente et de survente du StochRSI pour filtrer les fausses ruptures.
Principe de stratégie
La stratégie utilise les moyennes mobiles rapides EMA 12 et EMA 25 pour construire un système de moyennes mobiles doubles qui génère un signal d’achat lorsque la ligne rapide traverse la ligne lente et un signal de vente lorsque la ligne rapide traverse la ligne lente, afin de déterminer la direction de la tendance générale.
En outre, la stratégie est combinée avec le croisement de l’indicateur StochRSI pour identifier davantage le moment d’entrée. L’indicateur StochRSI, combiné avec les indicateurs aléatoires KDJ et RSI, génère un signal d’achat lorsque la ligne K traverse la ligne D depuis la zone de survente et un signal de vente lorsque la ligne K traverse la ligne D depuis la zone de survente.
La stratégie n’ouvre une position que lorsque les moyennes mobiles doubles donnent un signal et que le StochRSI donne le signal correspondant. Cela permet de filtrer efficacement certaines fausses ruptures et d’éviter des transactions inefficaces.
Analyse des avantages
Le plus grand avantage de cette stratégie réside dans la possibilité de déterminer à l’avance la direction de la tendance et les points d’entrée potentiels. Le système de moyenne mobile peut générer des signaux dès le début de la tendance, tandis que l’ajout de l’indicateur StochRSI permet de filtrer efficacement les fausses ruptures et d’éviter les mauvaises transactions.
En outre, la stratégie combine l’analyse de la tendance et le jugement sur les sur-achats et les sur-vente, avec les avantages du suivi de la tendance et de l’inversion des transactions. Que ce soit pour suivre la tendance ou pour acheter à bas prix et vendre à bas prix, la stratégie capture toutes les opportunités.
Analyse des risques
Le principal risque de cette stratégie réside dans le retard du système de moyennes mobiles lui-même. Lorsque la situation change brusquement, le système de moyennes mobiles doubles prend souvent un peu de temps avant de générer un signal, ce qui permet à la stratégie de manquer le meilleur moment d’entrée.
En outre, l’indicateur StochRSI peut également générer des signaux erronés, déclenchant des transactions inutiles. En particulier pendant les périodes de choc, les lignes K et D peuvent se croiser fréquemment, ce qui entraîne un risque d’inefficacité excessive de la stratégie.
Direction d’optimisation
L’optimisation de la stratégie s’est principalement concentrée sur les aspects suivants:
Ajuster les paramètres des moyennes mobiles doubles pour utiliser des périodes moyennes plus favorables à la capture des tendances;
Optimiser les paramètres du StochRSI afin d’élaborer des critères de jugement plus raisonnables pour les surachats et les survente;
d’augmenter le volume des commandes ou d’ajuster le niveau des arrêts de perte afin d’obtenir des rendements plus élevés;
La combinaison d’autres indicateurs comme conditions de filtrage permet de réduire encore plus les signaux inefficaces.
Résumer
Cette stratégie est tout à fait adaptée pour capturer les tendances de la ligne moyenne et longue, et offre un potentiel de profit élevé au début de la tendance. En combinaison avec l’indicateur StochRSI comme jugement auxiliaire, elle permet de filtrer efficacement les signaux trompeurs et d’éviter les pertes inutiles. Grâce à l’optimisation des paramètres et à l’amélioration de la gestion des risques, la stratégie peut devenir un outil puissant pour obtenir des gains stables.
/*backtest
start: 2024-01-01 00:00:00
end: 2024-01-24 00:00:00
period: 1h
basePeriod: 15m
exchanges: [{"eid":"Futures_Binance","currency":"BTC_USDT"}]
*/

// This source code is subject to the terms of the Mozilla Public License 2.0 at https://mozilla.org/MPL/2.0/
// © btc_charlie / @TheParagonGrp

//@version=5
strategy('BlackBit Trader XO Macro Trend Scanner', overlay=true)

// Variables
var ok = 0
var countBuy = 0
var countSell = 0
src = input(close, title='OHLC Type')
i_fastEMA = input(12, title='Fast EMA')
i_slowEMA = input(25, title='Slow EMA')
i_defEMA = input(25, title='Consolidated EMA')

// Allow the option to show single or double EMA
i_bothEMAs = input(title='Show Both EMAs', defval=true)

// Define EMAs
v_fastEMA = ta.ema(src, i_fastEMA)
v_slowEMA = ta.ema(src, i_slowEMA)
v_biasEMA = ta.ema(src, i_defEMA)

// Color the EMAs
emaColor = v_fastEMA > v_slowEMA ? color.green : v_fastEMA < v_slowEMA ? color.red : #FF530D

// Plot EMAs
plot(i_bothEMAs ? na : v_biasEMA, color=emaColor, linewidth=3, title='Consolidated EMA')
plot(i_bothEMAs ? v_fastEMA : na, title='Fast EMA', color=emaColor)
plot(i_bothEMAs ? v_slowEMA : na, title='Slow EMA', color=emaColor)

// Colour the bars
buy = v_fastEMA > v_slowEMA
sell = v_fastEMA < v_slowEMA

if buy
    countBuy += 1
    countBuy

if buy
    countSell := 0
    countSell

if sell
    countSell += 1
    countSell

if sell
    countBuy := 0
    countBuy

buysignal = countBuy < 2 and countBuy > 0 and countSell < 1 and buy and not buy[1]
sellsignal = countSell > 0 and countSell < 2 and countBuy < 1 and sell and not sell[1]

barcolor(buysignal ? color.green : na)
barcolor(sellsignal ? color.red : na)


bull = countBuy > 1
bear = countSell > 1

barcolor(bull ? color.green : na)
barcolor(bear ? color.red : na)

// Set Alerts

// alertcondition(ta.crossover(v_fastEMA, v_slowEMA), title='Bullish EMA Cross', message='Bullish EMA crossover')
// alertcondition(ta.crossunder(v_fastEMA, v_slowEMA), title='Bearish EMA Cross', message='Bearish EMA Crossover')

// Stoch RSI code

smoothK = input.int(3, 'K', minval=1)
smoothD = input.int(3, 'D', minval=1)
lengthRSI = input.int(14, 'RSI Length', minval=1)
lengthStoch = input.int(14, 'Stochastic Length', minval=1)

rsi1 = ta.rsi(src, lengthRSI)
k = ta.sma(ta.stoch(rsi1, rsi1, rsi1, lengthStoch), smoothK)
d = ta.sma(k, smoothD)

bandno0 = input.int(80, minval=1, title='Upper Band', group='Bands (change this instead of length in Style for Stoch RSI colour to work properly)')
bandno2 = input.int(50, minval=1, title='Middle Band', group='Bands (change this instead of length in Style for Stoch RSI colour to work properly)')
bandno1 = input.int(20, minval=1, title='Lower Band', group='Bands (change this instead of length in Style for Stoch RSI colour to work properly)')

// Alerts

crossoverAlertBgColourMidOnOff = input.bool(title='Crossover Alert Background Colour (Middle Level) [ON/OFF]', group='Crossover Alerts', defval=false)
crossoverAlertBgColourOBOSOnOff = input.bool(title='Crossover Alert Background Colour (OB/OS Level) [ON/OFF]', group='Crossover Alerts', defval=false)

crossoverAlertBgColourGreaterThanOnOff = input.bool(title='Crossover Alert >input [ON/OFF]', group='Crossover Alerts', defval=false)
crossoverAlertBgColourLessThanOnOff = input.bool(title='Crossover Alert <input [ON/OFF]', group='Crossover Alerts', defval=false)

maTypeChoice = input.string('EMA', title='MA Type', group='Moving Average', options=['EMA', 'WMA', 'SMA', 'None'])
maSrc = input.source(close, title='MA Source', group='Moving Average')
maLen = input.int(200, minval=1, title='MA Length', group='Moving Average')

maValue = if maTypeChoice == 'EMA'
    ta.ema(maSrc, maLen)
else if maTypeChoice == 'WMA'
    ta.wma(maSrc, maLen)
else if maTypeChoice == 'SMA'
    ta.sma(maSrc, maLen)
else
    0

crossupCHECK = maTypeChoice == 'None' or open > maValue and maTypeChoice != 'None'
crossdownCHECK = maTypeChoice == 'None' or open < maValue and maTypeChoice != 'None'

crossupalert = crossupCHECK and ta.crossover(k, d) and (k < bandno2 or d < bandno2)
crossdownalert = crossdownCHECK and ta.crossunder(k, d) and (k > bandno2 or d > bandno2)
crossupOSalert = crossupCHECK and ta.crossover(k, d) and (k < bandno1 or d < bandno1)
crossdownOBalert = crossdownCHECK and ta.crossunder(k, d) and (k > bandno0 or d > bandno0)

aboveBandalert = ta.crossunder(k, bandno0)
belowBandalert = ta.crossover(k, bandno1)

bgcolor(color=crossupalert and crossoverAlertBgColourMidOnOff ? #4CAF50 : crossdownalert and crossoverAlertBgColourMidOnOff ? #FF0000 : na, title='Crossover Alert Background Colour (Middle Level)', transp=70)
bgcolor(color=crossupOSalert and crossoverAlertBgColourOBOSOnOff ? #fbc02d : crossdownOBalert and crossoverAlertBgColourOBOSOnOff ? #000000 : na, title='Crossover Alert Background Colour (OB/OS Level)', transp=70)

bgcolor(color=aboveBandalert and crossoverAlertBgColourGreaterThanOnOff ? #ff0014 : crossdownalert and crossoverAlertBgColourMidOnOff ? #FF0000 : na, title='Crossover Alert - K > Upper level', transp=70)
bgcolor(color=belowBandalert and crossoverAlertBgColourLessThanOnOff ? #4CAF50 : crossdownalert and crossoverAlertBgColourMidOnOff ? #FF0000 : na, title='Crossover Alert - K < Lower level', transp=70)

// alertcondition(crossupalert or crossdownalert, title='Stoch RSI Crossover', message='STOCH RSI CROSSOVER')

// Calculate start/end date and time condition
startDate = input(timestamp('2000-12-24T00:00:00'),group = "---------TIME RANGE SETTINGS---------")
finishDate = input(timestamp('2029-02-26T00:00:00'),group = "---------TIME RANGE SETTINGS---------")
time_cond = true


//ema filter
emalen = input(200,"EMA Filter Length",group = "EMA FILTER SETTINGS")
emasource = input(close,"EMA Filter Source",group = "EMA FILTER SETTINGS")
ema_fil = ta.ema(emasource,emalen)
plot(ema_fil,"EMA Filter")

//macd
fast_length = input(title="Fast Length", defval=26,group = "MACD FILTER SETTINGS")
slow_length = input(title="Slow Length", defval=100,group = "MACD FILTER SETTINGS")
src_macd = input(title="Source", defval=close,group = "MACD FILTER SETTINGS")
signal_length = input.int(title="Signal Smoothing",  minval = 1, maxval = 50, defval = 9,group = "MACD FILTER SETTINGS")
sma_source = input.string(title="Oscillator MA Type",  defval="EMA", options=["SMA", "EMA"],group = "MACD FILTER SETTINGS")
sma_signal = input.string(title="Signal Line MA Type", defval="EMA", options=["SMA", "EMA"],group = "MACD FILTER SETTINGS")

// Calculating
fast_ma = sma_source == "SMA" ? ta.sma(src_macd, fast_length) : ta.ema(src_macd, fast_length)
slow_ma = sma_source == "SMA" ? ta.sma(src_macd, slow_length) : ta.ema(src_macd, slow_length)
macd = fast_ma - slow_ma
signal = sma_signal == "SMA" ? ta.sma(macd, signal_length) : ta.ema(macd, signal_length)
hist = macd - signal

//tpsl
takeprofit=input.float(defval=0.3,title="Enter The Take Profit %",group="TP/SL CONDITION INPUTS HERE")/100
stoploss=input.float(defval=0.16,title="Enter The Stop %",group="TP/SL CONDITION INPUTS HERE")/100
tp = strategy.opentrades.entry_price(0)*takeprofit/syminfo.mintick
sl = strategy.opentrades.entry_price(0)*stoploss/syminfo.mintick

lg_rule = buysignal and hist > 0 and close > ema_fil
sh_rule = sellsignal and hist < 0 and close < ema_fil

// Plot Bull/Bear

plotshape(lg_rule, title='Bull', text='Bull', style=shape.triangleup, location=location.belowbar, color=color.new(color.green, 0), textcolor=color.new(color.black, 0), size=size.tiny)
plotshape(sh_rule, title='Bear', text='Bear', style=shape.triangledown, location=location.abovebar, color=color.new(color.red, 0), textcolor=color.new(color.black, 0), size=size.tiny)

//alert
lg_entryal = input("Long entry","Long entry alert",group = "ALERT MESSAGE SETTINGS")
sh_entryal = input("Short entry","Short entry alert",group = "ALERT MESSAGE SETTINGS")

if lg_rule and time_cond and barstate.isconfirmed
    strategy.entry("LONG",strategy.long)
    alert(lg_entryal,alert.freq_once_per_bar_close)
if strategy.position_size > 0
    strategy.exit("LONG EX","LONG",loss = sl,profit = tp,comment_loss = "LONG SL",comment_profit = "LONG TP")

if sh_rule and time_cond and barstate.isconfirmed
    strategy.entry("SHORT",strategy.short)
    alert(sh_entryal,alert.freq_once_per_bar_close)

if strategy.position_size < 0
    strategy.exit("SHORT EX","SHORT",loss = sl,profit = tp,comment_loss = "SHORT SL",comment_profit = "SHORT TP")

//end