Stratégie quantitative de suivi des tendances basée sur l'indicateur Hull et l'indicateur LSMA
Aperçu
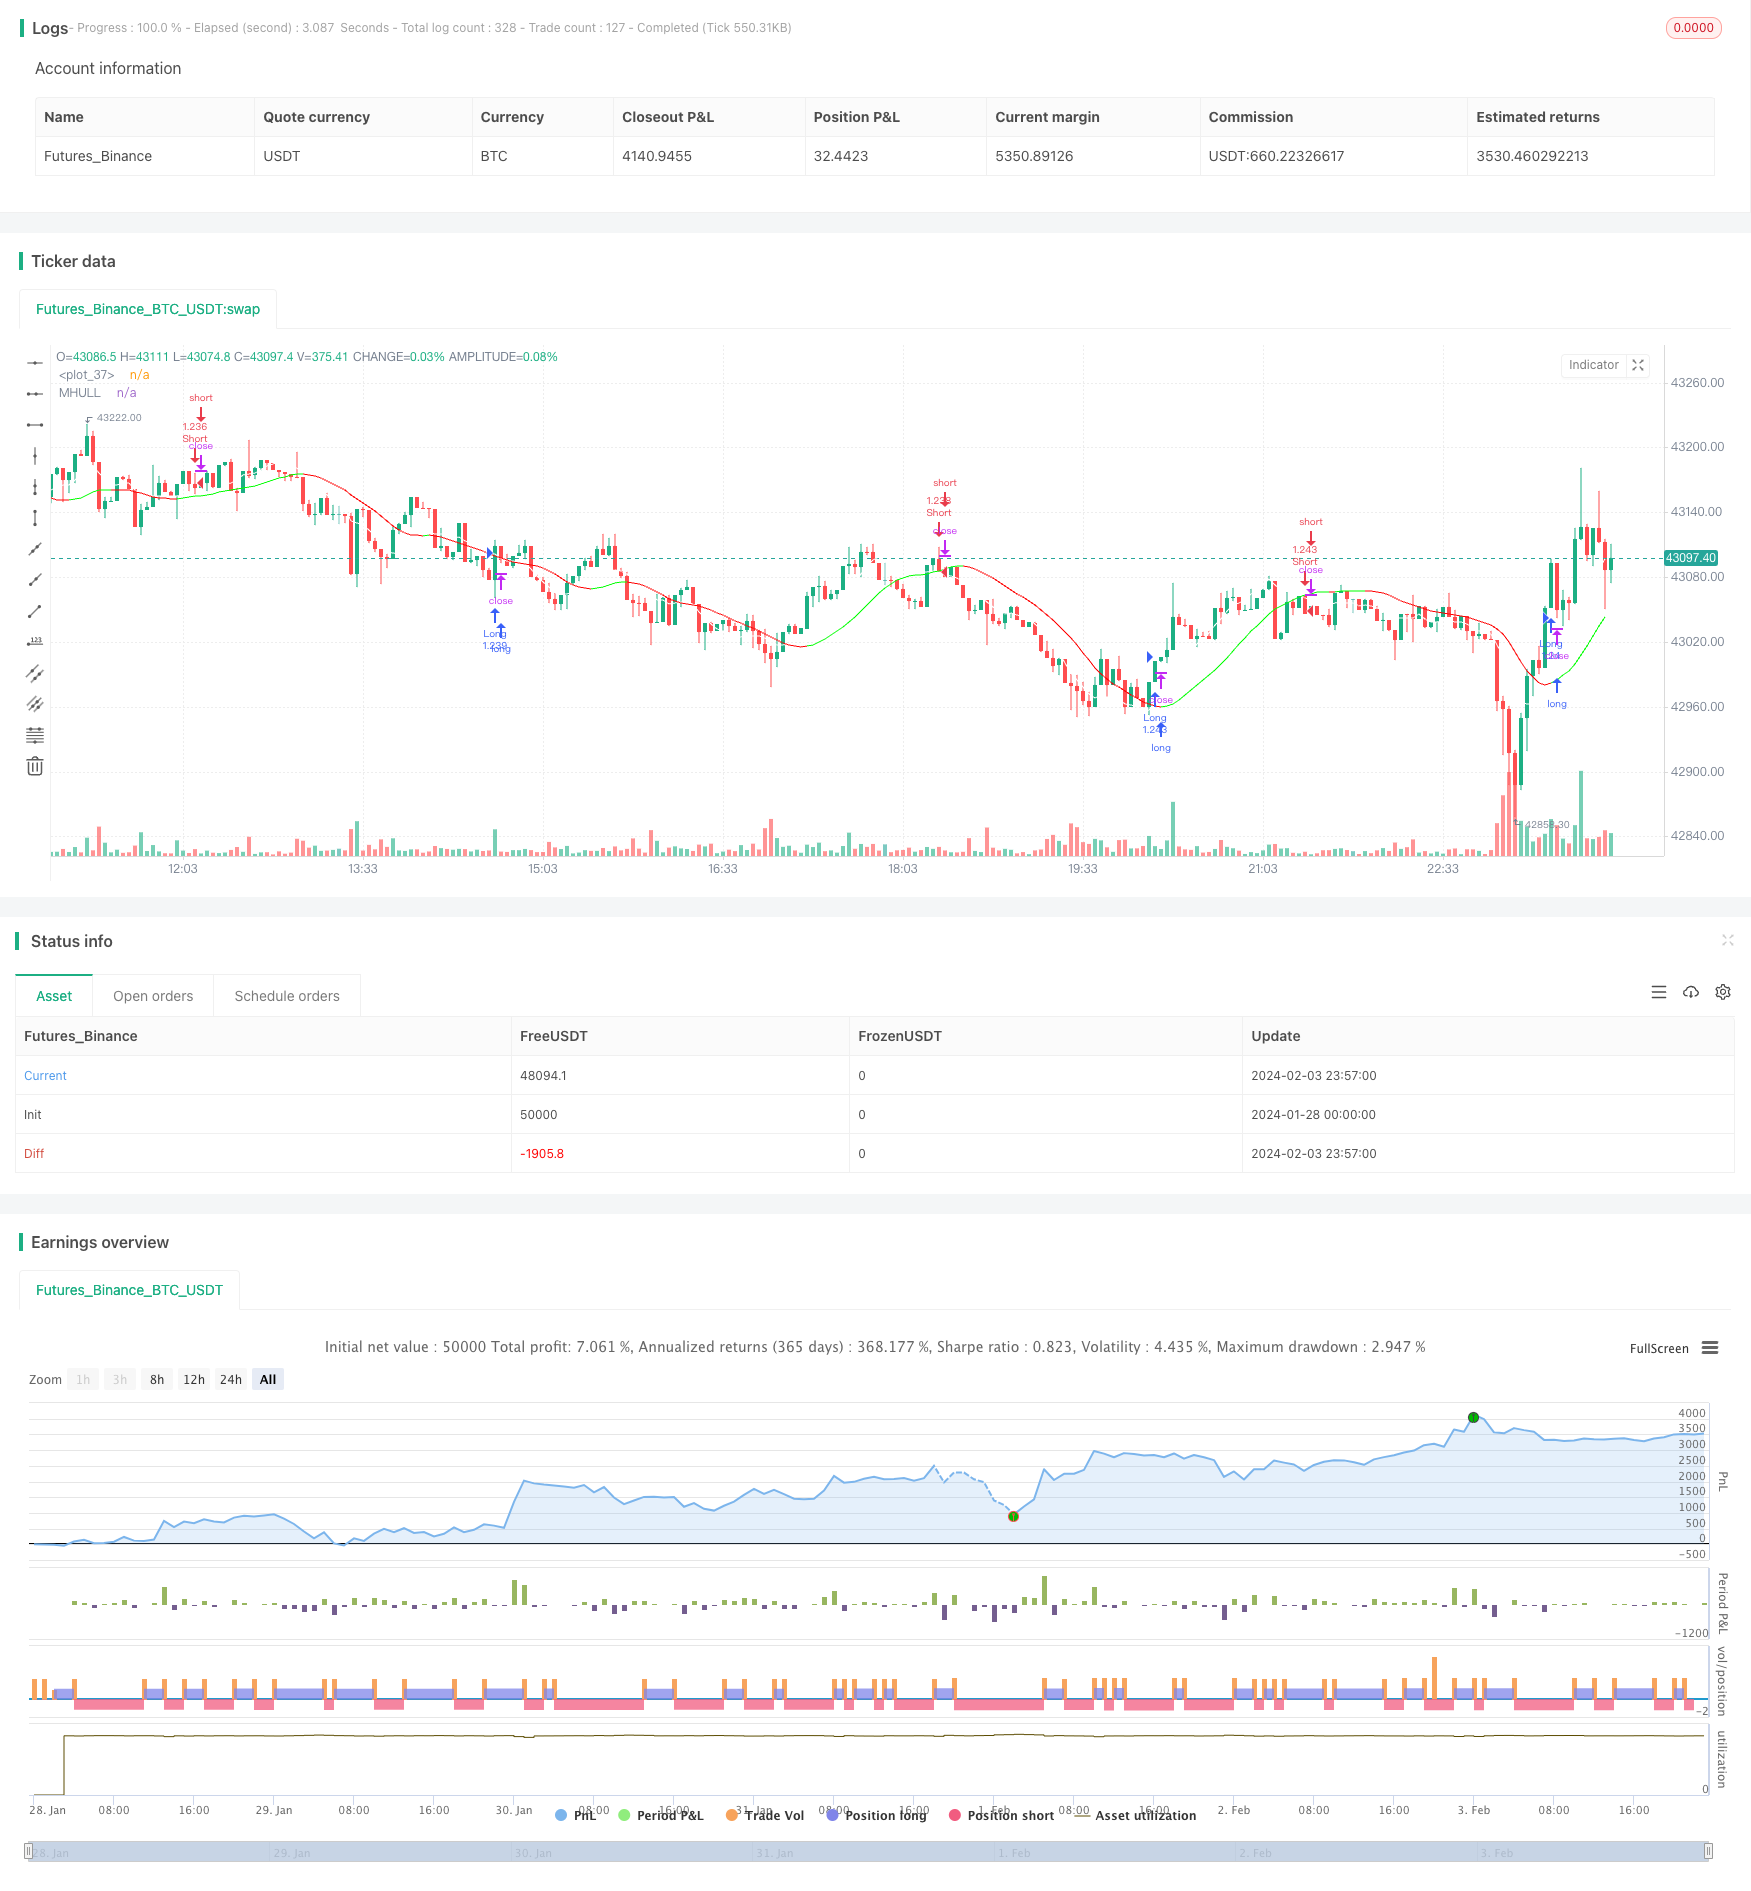
Cette stratégie permet de suivre la tendance en identifiant la direction de la tendance et les points d’inversion de la tendance en combinant l’indicateur Hull et l’indicateur LSMA (le plus petit deux fois la moyenne mobile). La stratégie est valable pour les transactions à basse et moyenne fréquence et peut être utilisée dans un délai d’une minute.
Principe de stratégie
L’indicateur de Hull est utilisé pour déterminer la direction de la tendance de la valeur. Lorsque la ligne médiane (MHULL) est au-dessus de la ligne inférieure (LHULL), elle indique une tendance à la hausse; inversement, elle indique une tendance à la baisse.
L’indicateur LSMA est utilisé pour identifier les points de retournement de tendance. Lorsque l’indicateur LSMA traverse MHULL, il indique la formation ou l’accélération d’une tendance à la hausse; lorsque l’indicateur LSMA traverse MHULL, il indique la formation ou l’accélération d’une tendance à la baisse.
Combinez les deux, faites plus lorsque l’indicateur de Hull montre une tendance à la hausse ((MHULL > LHULL) et que le LSMA traverse MHULL; faites moins lorsque l’indicateur de Hull montre une tendance à la baisse ((MHULL < LHULL) et que le LSMA traverse MHULL).
Le stop loss est le point de fluctuation le plus proche. Le stop plus est le point de fluctuation le plus proche. Le stop short est le point de fluctuation le plus proche.
Analyse des avantages
Cette stratégie présente les avantages suivants:
L’indicateur Hull réagit rapidement et capte les changements de tendance en temps opportun. L’indicateur LSMA est lisse et reconnaît les signaux de retournement avec précision et fiabilité.
Les faux signaux détectés par l’indicateur Hull traversant la LSMA réduisent la probabilité d’une transaction erronée.
Le point d’oscillation est utilisé comme point d’arrêt pour protéger au maximum la sécurité des fonds.
Il est adapté pour les transactions à basse ou moyenne fréquence, peut être utilisé dans un délai d’une minute ou moins, et est largement utilisé.
Analyse des risques
Cette stratégie comporte aussi des risques:
En cas de choc, il est possible que l’indicateur Hull et le LSMA se croisent plusieurs fois, ce qui entraîne des transactions trop fréquentes. Les paramètres doivent être ajustés de manière appropriée pour réduire la fréquence des transactions.
Le stop loss est défini comme un point de fluctuation qui peut être déclenché par un ajustement de prix à court terme, et l’intervalle entre les points de stop loss doit être élargi de manière appropriée.
Le risque d’erreur de jugement est faible en raison du retard de l’indicateur LSMA. Il doit être confirmé par d’autres indicateurs tels que la forme de la ligne K.
Direction d’optimisation
Cette stratégie peut être optimisée dans les domaines suivants:
Optimisation des paramètres de l’indicateur Hull et de la LSMA pour une meilleure adéquation des combinaisons avec les différentes variétés et périodes de temps.
Il a ajouté des conditions de filtrage basées sur la volatilité, le volume des transactions, etc. afin d’éviter les transactions erronées dans des conditions de choc.
L’ajout d’un algorithme d’apprentissage automatique pour détecter les tendances est un jugement auxiliaire.
Les techniques d’apprentissage en profondeur, combinées à la détection des zones de résistance de support critiques, rendent le stop loss plus raisonnable.
Résumer
La stratégie utilise la combinaison de l’indicateur de Hull et du LSMA pour juger des changements de direction de la tendance et mettre en œuvre des transactions de suivi de tendance. L’avantage est que l’opération est simple, la réponse est rapide et peut être largement appliquée à des transactions quantifiées de moyenne et basse fréquence.
/*backtest
start: 2024-01-28 00:00:00
end: 2024-02-04 00:00:00
period: 3m
basePeriod: 1m
exchanges: [{"eid":"Futures_Binance","currency":"BTC_USDT"}]
*/

// This source code is subject to the terms of the Mozilla Public License 2.0 at https://mozilla.org/MPL/2.0/
// © myn

//@version=5
strategy('Strategy Myth-Busting #9 - HullSuite+LSMA - [MYN]', max_bars_back=5000, overlay=true, pyramiding=0, initial_capital=1000, currency='USD', default_qty_type=strategy.percent_of_equity, default_qty_value=1.0, commission_value=0.075, use_bar_magnifier = false)

// Hull Suite by InSilico
// Least Squares Moving Average

// Long
// Hull Suite is red and LSMA crosses above HUll Suite while red
// Stop loss latest swing low

//Short
// Hull Suite is green and LSMA crosses under HUll Suite while green
// Stop loss latest swing high

//1:4 Risk ratio
// 1 minute timeframe


/////////////////////////////////////
//* Put your strategy logic below *//
/////////////////////////////////////
//72iE0gCVjvM


// LSMA
//░░░░░░░░░░░░░░░░░░░░░░░░░░░░░░░░░░░░░░░░░░░░░░░░░░░░░░░░░░░░░░░░░░░░░░░░░░░░░░░░░░░░░░░░░░░░░░░░░░░░░░░░░░░░░░░░░░░░░░░░░░░░░░░░░░░░░░░░░░░░░░░░░░

//@version=5
//indicator(title = "Least Squares Moving Average", shorttitle="LSMA", overlay=true, timeframe="", timeframe_gaps=true)
length1 = input(title="Length", defval=25, group="Least Squares Moving Average (LSMA)")
offset1 = input(title="Offset", defval=0)
src1 = input(close, title="Source")
lsma = ta.linreg(src1, length1, offset1)
plot(lsma, color=color.white)


// Hull Suite by InSilico
//░░░░░░░░░░░░░░░░░░░░░░░░░░░░░░░░░░░░░░░░░░░░░░░░░░░░░░░░░░░░░░░░░░░░░░░░░░░░░░░░░░░░░░░░░░░░░░░░░░░░░░░░░░░░░░░░░░░░░░░░░░░░░░░░░░░░░░░░░░░░░░░░░░

//@version=5
//Basic Hull Ma Pack tinkered by InSilico
//indicator('Hull Suite by InSilico', overlay=true)

//INPUT
src = input(close, title='Source', group="Hull Suite")
modeSwitch = input.string('Hma', title='Hull Variation', options=['Hma', 'Thma', 'Ehma'])
length = input(55, title='Length(180-200 for floating S/R , 55 for swing entry)')
lengthMult = input(1.0, title='Length multiplier (Used to view higher timeframes with straight band)')

useHtf = input(false, title='Show Hull MA from X timeframe? (good for scalping)')
htf = input.timeframe('240', title='Higher timeframe')

switchColor = input(true, 'Color Hull according to trend?')
candleCol = input(false, title='Color candles based on Hull\'s Trend?')
visualSwitch = input(false, title='Show as a Band?')
thicknesSwitch = input(1, title='Line Thickness')
transpSwitch = input.int(40, title='Band Transparency', step=5)

//FUNCTIONS
//HMA
HMA(_src, _length) =>
    ta.wma(2 * ta.wma(_src, _length / 2) - ta.wma(_src, _length), math.round(math.sqrt(_length)))
//EHMA
EHMA(_src, _length) =>
    ta.ema(2 * ta.ema(_src, _length / 2) - ta.ema(_src, _length), math.round(math.sqrt(_length)))
//THMA
THMA(_src, _length) =>
    ta.wma(ta.wma(_src, _length / 3) * 3 - ta.wma(_src, _length / 2) - ta.wma(_src, _length), _length)

//SWITCH
Mode(modeSwitch, src, len) =>
    modeSwitch == 'Hma' ? HMA(src, len) : modeSwitch == 'Ehma' ? EHMA(src, len) : modeSwitch == 'Thma' ? THMA(src, len / 2) : na

//OUT
_hull = Mode(modeSwitch, src, int(length * lengthMult))
HULL = useHtf ? request.security(syminfo.ticker, htf, _hull) : _hull
MHULL = HULL[0]
SHULL = HULL[2]

//COLOR
hullColor = switchColor ? HULL > HULL[2] ? #00ff00 : #ff0000 : #ff9800

//PLOT
///< Frame
Fi1 = plot(MHULL, title='MHULL', color=hullColor, linewidth=thicknesSwitch, transp=50)
Fi2 = plot(visualSwitch ? SHULL : na, title='SHULL', color=hullColor, linewidth=thicknesSwitch, transp=50)
alertcondition(ta.crossover(MHULL, SHULL), title='Hull trending up.', message='Hull trending up.')
alertcondition(ta.crossover(SHULL, MHULL), title='Hull trending down.', message='Hull trending down.')
///< Ending Filler
fill(Fi1, Fi2, title='Band Filler', color=hullColor, transp=transpSwitch)
///BARCOLOR
barcolor(color=candleCol ? switchColor ? hullColor : na : na)


// Long
// Hull Suite is red and LSMA crosses above HUll Suite while red
// Stop loss latest swing low

//Short
// Hull Suite is green and LSMA crosses under HUll Suite while green
// Stop loss latest swing high

//1:4 Risk ratio
longEntry = hullColor == #ff0000 and ta.crossover(lsma, MHULL )
shortEntry = hullColor == #00ff00 and ta.crossunder(lsma, MHULL)

//////////////////////////////////////
//* Put your strategy rules below *//
/////////////////////////////////////

longCondition = longEntry
shortCondition = shortEntry

//define as 0 if do not want to use
closeLongCondition = 0
closeShortCondition = 0


// ADX
//░░░░░░░░░░░░░░░░░░░░░░░░░░░░░░░░░░░░░░░░░░░░░░░░░░░░░░░░░░░░░░░░░░░░░░░░░░░░░░░░░░░░░░░░░░░░░░░░░░░░░░░░░░░░░░░░░░░░░░░░░░░░░░░░░░░░░░░░░░░░░░░░░░

adxEnabled = input.bool(defval = false , title = "Average Directional Index (ADX)", tooltip = "", group ="ADX" )
adxlen = input(14, title="ADX Smoothing", group="ADX")
adxdilen = input(14, title="DI Length", group="ADX")
adxabove = input(25, title="ADX Threshold", group="ADX")

adxdirmov(len) =>
	adxup = ta.change(high)
	adxdown = -ta.change(low)
	adxplusDM = na(adxup) ? na : (adxup > adxdown and adxup > 0 ? adxup : 0)
	adxminusDM = na(adxdown) ? na : (adxdown > adxup and adxdown > 0 ? adxdown : 0)
	adxtruerange = ta.rma(ta.tr, len)
	adxplus = fixnan(100 * ta.rma(adxplusDM, len) / adxtruerange)
	adxminus = fixnan(100 * ta.rma(adxminusDM, len) / adxtruerange)
	[adxplus, adxminus]
adx(adxdilen, adxlen) =>
	[adxplus, adxminus] = adxdirmov(adxdilen)
	adxsum = adxplus + adxminus
	adx = 100 * ta.rma(math.abs(adxplus - adxminus) / (adxsum == 0 ? 1 : adxsum), adxlen)

adxsig = adxEnabled ? adx(adxdilen, adxlen) : na
isADXEnabledAndAboveThreshold = adxEnabled ? (adxsig > adxabove) : true

//Backtesting Time Period (Input.time not working as expected as of 03/30/2021.  Giving odd start/end dates
//░░░░░░░░░░░░░░░░░░░░░░░░░░░░░░░░░░░░░░░░░░░░░░░░░░░░░░░░░░░░░░░░░░░░░░░░░░░░░░░░░░░░░░░░░░░░░░░░░░░░░░░░░░░░░░░░░░░░░░░░░░░░░░░░░░░░░░░░░░░░░░░░░░
useStartPeriodTime = input.bool(true, 'Start', group='Date Range', inline='Start Period')
startPeriodTime = input(timestamp('1 Jan 2019'), '', group='Date Range', inline='Start Period')
useEndPeriodTime = input.bool(true, 'End', group='Date Range', inline='End Period')
endPeriodTime = input(timestamp('31 Dec 2030'), '', group='Date Range', inline='End Period')

start = useStartPeriodTime ? startPeriodTime >= time : false
end = useEndPeriodTime ? endPeriodTime <= time : false
calcPeriod = true

// Trade Direction
// ░░░░░░░░░░░░░░░░░░░░░░░░░░░░░░░░░░░░░░░░░░░░░░░░░░░░░░░░░░░░░░░░░░░░░░░░░░░░░░░░░░░░░░░░░░░░░░░░░░░░░░░░░░░░░░░░░░░░░░░░░░░░░░░░░░░░░░░░░░░░░░░░░░
tradeDirection = input.string('Long and Short', title='Trade Direction', options=['Long and Short', 'Long Only', 'Short Only'], group='Trade Direction')

// Percent as Points
// ░░░░░░░░░░░░░░░░░░░░░░░░░░░░░░░░░░░░░░░░░░░░░░░░░░░░░░░░░░░░░░░░░░░░░░░░░░░░░░░░░░░░░░░░░░░░░░░░░░░░░░░░░░░░░░░░░░░░░░░░░░░░░░░░░░░░░░░░░░░░░░░░░░
per(pcnt) =>
    strategy.position_size != 0 ? math.round(pcnt / 100 * strategy.position_avg_price / syminfo.mintick) : float(na)

// Take profit 1
// ░░░░░░░░░░░░░░░░░░░░░░░░░░░░░░░░░░░░░░░░░░░░░░░░░░░░░░░░░░░░░░░░░░░░░░░░░░░░░░░░░░░░░░░░░░░░░░░░░░░░░░░░░░░░░░░░░░░░░░░░░░░░░░░░░░░░░░░░░░░░░░░░░░
tp1 = input.float(title='Take Profit 1 - Target %', defval=100, minval=0.0, step=0.5, group='Take Profit', inline='Take Profit 1')
q1 = input.int(title='% Of Position', defval=100, minval=0, group='Take Profit', inline='Take Profit 1')

// Take profit 2
// ░░░░░░░░░░░░░░░░░░░░░░░░░░░░░░░░░░░░░░░░░░░░░░░░░░░░░░░░░░░░░░░░░░░░░░░░░░░░░░░░░░░░░░░░░░░░░░░░░░░░░░░░░░░░░░░░░░░░░░░░░░░░░░░░░░░░░░░░░░░░░░░░░░
tp2 = input.float(title='Take Profit 2 - Target %', defval=100, minval=0.0, step=0.5, group='Take Profit', inline='Take Profit 2')
q2 = input.int(title='% Of Position', defval=100, minval=0, group='Take Profit', inline='Take Profit 2')

// Take profit 3
// ░░░░░░░░░░░░░░░░░░░░░░░░░░░░░░░░░░░░░░░░░░░░░░░░░░░░░░░░░░░░░░░░░░░░░░░░░░░░░░░░░░░░░░░░░░░░░░░░░░░░░░░░░░░░░░░░░░░░░░░░░░░░░░░░░░░░░░░░░░░░░░░░░░
tp3 = input.float(title='Take Profit 3 - Target %', defval=100, minval=0.0, step=0.5, group='Take Profit', inline='Take Profit 3')
q3 = input.int(title='% Of Position', defval=100, minval=0, group='Take Profit', inline='Take Profit 3')

// Take profit 4
// ░░░░░░░░░░░░░░░░░░░░░░░░░░░░░░░░░░░░░░░░░░░░░░░░░░░░░░░░░░░░░░░░░░░░░░░░░░░░░░░░░░░░░░░░░░░░░░░░░░░░░░░░░░░░░░░░░░░░░░░░░░░░░░░░░░░░░░░░░░░░░░░░░░
tp4 = input.float(title='Take Profit 4 - Target %', defval=100, minval=0.0, step=0.5, group='Take Profit')

/// Stop Loss
// ░░░░░░░░░░░░░░░░░░░░░░░░░░░░░░░░░░░░░░░░░░░░░░░░░░░░░░░░░░░░░░░░░░░░░░░░░░░░░░░░░░░░░░░░░░░░░░░░░░░░░░░░░░░░░░░░░░░░░░░░░░░░░░░░░░░░░░░░░░░░░░░░░░
stoplossPercent = input.float(title='Stop Loss (%)', defval=999, minval=0.01, group='Stop Loss') * 0.01
slLongClose = close < strategy.position_avg_price * (1 - stoplossPercent)
slShortClose = close > strategy.position_avg_price * (1 + stoplossPercent)

/// Leverage
// ░░░░░░░░░░░░░░░░░░░░░░░░░░░░░░░░░░░░░░░░░░░░░░░░░░░░░░░░░░░░░░░░░░░░░░░░░░░░░░░░░░░░░░░░░░░░░░░░░░░░░░░░░░░░░░░░░░░░░░░░░░░░░░░░░░░░░░░░░░░░░░░░░░
leverage = input.float(1, 'Leverage', step=.5, group='Leverage')
contracts = math.min(math.max(.000001, strategy.equity / close * leverage), 1000000000)


/// Trade State Management
// ░░░░░░░░░░░░░░░░░░░░░░░░░░░░░░░░░░░░░░░░░░░░░░░░░░░░░░░░░░░░░░░░░░░░░░░░░░░░░░░░░░░░░░░░░░░░░░░░░░░░░░░░░░░░░░░░░░░░░░░░░░░░░░░░░░░░░░░░░░░░░░░░░░

isInLongPosition = strategy.position_size > 0
isInShortPosition = strategy.position_size < 0

/// ProfitView Alert Syntax String Generation
// ░░░░░░░░░░░░░░░░░░░░░░░░░░░░░░░░░░░░░░░░░░░░░░░░░░░░░░░░░░░░░░░░░░░░░░░░░░░░░░░░░░░░░░░░░░░░░░░░░░░░░░░░░░░░░░░░░░░░░░░░░░░░░░░░░░░░░░░░░░░░░░░░░░

alertSyntaxPrefix = input.string(defval='CRYPTANEX_99FTX_Strategy-Name-Here', title='Alert Syntax Prefix', group='ProfitView Alert Syntax')
alertSyntaxBase = alertSyntaxPrefix + '\n#' + str.tostring(open) + ',' + str.tostring(high) + ',' + str.tostring(low) + ',' + str.tostring(close) + ',' + str.tostring(volume) + ','


/// Trade Execution
// ░░░░░░░░░░░░░░░░░░░░░░░░░░░░░░░░░░░░░░░░░░░░░░░░░░░░░░░░░░░░░░░░░░░░░░░░░░░░░░░░░░░░░░░░░░░░░░░░░░░░░░░░░░░░░░░░░░░░░░░░░░░░░░░░░░░░░░░░░░░░░░░░░░

longConditionCalc = (longCondition and isADXEnabledAndAboveThreshold)
shortConditionCalc = (shortCondition and isADXEnabledAndAboveThreshold)

if calcPeriod
    if longConditionCalc and tradeDirection != 'Short Only' and isInLongPosition == false
        strategy.entry('Long', strategy.long, qty=contracts)

        alert(message=alertSyntaxBase + 'side:long', freq=alert.freq_once_per_bar_close)

    if shortConditionCalc and tradeDirection != 'Long Only' and isInShortPosition == false
        strategy.entry('Short', strategy.short, qty=contracts)

        alert(message=alertSyntaxBase + 'side:short', freq=alert.freq_once_per_bar_close)

    //Inspired from Multiple %% profit exits example by adolgo https://www.tradingview.com/script/kHhCik9f-Multiple-profit-exits-example/
    strategy.exit('TP1', qty_percent=q1, profit=per(tp1))
    strategy.exit('TP2', qty_percent=q2, profit=per(tp2))
    strategy.exit('TP3', qty_percent=q3, profit=per(tp3))
    strategy.exit('TP4', profit=per(tp4))

    strategy.close('Long', qty_percent=100, comment='SL Long', when=slLongClose)
    strategy.close('Short', qty_percent=100, comment='SL Short', when=slShortClose)

    strategy.close_all(when=closeLongCondition or closeShortCondition, comment='Close Postion')

/// Dashboard
// ░░░░░░░░░░░░░░░░░░░░░░░░░░░░░░░░░░░░░░░░░░░░░░░░░░░░░░░░░░░░░░░░░░░░░░░░░░░░░░░░░░░░░░░░░░░░░░░░░░░░░░░░░░░░░░░░░░░░░░░░░░░░░░░░░░░░░░░░░░░░░░░░░░
// Inspired by https://www.tradingview.com/script/uWqKX6A2/ - Thanks VertMT

showDashboard = input.bool(group="Dashboard", title="Show Dashboard", defval=false)

f_fillCell(_table, _column, _row, _title, _value, _bgcolor, _txtcolor) =>
    _cellText = _title + "\n" + _value
    table.cell(_table, _column, _row, _cellText, bgcolor=_bgcolor, text_color=_txtcolor, text_size=size.auto)

// Draw dashboard table
if showDashboard
    var bgcolor = color.new(color.black,0)

    // Keep track of Wins/Losses streaks
    newWin  = (strategy.wintrades  > strategy.wintrades[1]) and (strategy.losstrades == strategy.losstrades[1]) and (strategy.eventrades == strategy.eventrades[1])
    newLoss = (strategy.wintrades == strategy.wintrades[1]) and (strategy.losstrades  > strategy.losstrades[1]) and (strategy.eventrades == strategy.eventrades[1])

    varip int winRow     = 0
    varip int lossRow    = 0
    varip int maxWinRow  = 0
    varip int maxLossRow = 0

    if newWin
        lossRow := 0
        winRow := winRow + 1
    if winRow > maxWinRow
        maxWinRow := winRow

    if newLoss
        winRow := 0
        lossRow := lossRow + 1
    if lossRow > maxLossRow
        maxLossRow := lossRow


    // Prepare stats table
    var table dashTable = table.new(position.bottom_right, 1, 15, border_width=1)


    if barstate.islastconfirmedhistory
        // Update table
        dollarReturn = strategy.netprofit
        f_fillCell(dashTable, 0, 0, "Start:", str.format("{0,date,long}", strategy.closedtrades.entry_time(0)) , bgcolor, color.white) // + str.format(" {0,time,HH:mm}", strategy.closedtrades.entry_time(0))
        f_fillCell(dashTable, 0, 1, "End:", str.format("{0,date,long}", strategy.opentrades.entry_time(0)) , bgcolor, color.white) // + str.format(" {0,time,HH:mm}", strategy.opentrades.entry_time(0))
        _profit = (strategy.netprofit / strategy.initial_capital) * 100
        f_fillCell(dashTable, 0, 2, "Net Profit:", str.tostring(_profit, '##.##') + "%", _profit > 0 ? color.green : color.red, color.white)
        _numOfDaysInStrategy = (strategy.opentrades.entry_time(0) - strategy.closedtrades.entry_time(0)) / (1000 * 3600 * 24)
        f_fillCell(dashTable, 0, 3, "Percent Per Day", str.tostring(_profit / _numOfDaysInStrategy, '#########################.#####')+"%", _profit > 0 ? color.green : color.red, color.white)
        _winRate = ( strategy.wintrades / strategy.closedtrades ) * 100
        f_fillCell(dashTable, 0, 4, "Percent Profitable:", str.tostring(_winRate, '##.##') + "%", _winRate < 50 ? color.red : _winRate < 75 ? #999900 : color.green, color.white)
        f_fillCell(dashTable, 0, 5, "Profit Factor:", str.tostring(strategy.grossprofit / strategy.grossloss,  '##.###'), strategy.grossprofit > strategy.grossloss ? color.green : color.red, color.white)
        f_fillCell(dashTable, 0, 6, "Total Trades:", str.tostring(strategy.closedtrades), bgcolor, color.white)
        f_fillCell(dashTable, 0, 8, "Max Wins In A Row:", str.tostring(maxWinRow, '######') , bgcolor, color.white)
        f_fillCell(dashTable, 0, 9, "Max Losses In A Row:", str.tostring(maxLossRow, '######') , bgcolor, color.white)