डबल ईएमए और आरएसआई को मिलाकर ट्रेंड फॉलोइंग रणनीति
अवलोकन
यह रणनीति दोहरे ईएमए और आरएसआई संकेतक के संयोजन का उपयोग करके मूल्य रुझानों की पहचान करती है और प्रवृत्ति की दिशा में बदलाव के समय समय पर प्रवेश करती है। विशेष रूप से, रणनीति लंबी अवधि के ईएमए का उपयोग करती है जो बड़ी प्रवृत्ति की दिशा का आकलन करती है, जबकि आरएसआई संकेतक का उपयोग अल्पकालिक ओवरबॉट ओवरसोल की घटना का आकलन करने के लिए करती है। जब कीमत मुख्य प्रवृत्ति की दिशा में होती है, तो आरएसआई संकेतक के माध्यम से एक व्यापारिक संकेत जारी किया जाता है, जो प्रवृत्ति की दिशा के अनुसार अधिक या कम होता है।
रणनीति सिद्धांत
200 चक्र ईएमए का उपयोग करके एक बड़ी प्रवृत्ति की दिशा का निर्धारण करें। ईएमए लाइन को ऊपर से पार करना एक उछाल संकेत है, और ईएमए लाइन को नीचे से पार करना एक गिरावट संकेत है।
आरएसआई सूचक पैरामीटर 10 चक्रों के लिए सेट किया गया है। जिसमें आरएसआई के ऊपर 40 ओवरबॉट सिग्नल के लिए और नीचे 60 ओवरबॉट सिग्नल के लिए है।
यदि आरएसआई 40 के नीचे एक ओवरसोल सिग्नल देता है, तो अधिक प्रविष्टि करें, जब बड़ी प्रवृत्ति ऊपर की ओर है (मूल्य ईएमए लाइन से ऊपर है) ।
यदि आरएसआई पर 60 के ओवरबॉय सिग्नल का संकेत मिलता है, तो कमोडिटी में प्रवेश करें, जब बड़ी प्रवृत्ति नीचे की ओर है (मूल्य ईएमए लाइन से नीचे है) ।
स्टॉप लॉस को एटीआर के चार गुना पर सेट किया गया है। स्टॉप लॉस को स्टॉप लॉस के दो गुना पर सेट किया गया है, जिससे 2: 1 जोखिम-लाभ अनुपात प्राप्त होता है।
श्रेष्ठता विश्लेषण
इस रणनीति का सबसे बड़ा लाभ यह है कि यह ट्रेंड और रिवर्स सूचकांकों को एक साथ जोड़ता है, और ट्रेंड के पीछे हटने पर समय पर प्रवेश करने में सक्षम होता है, इसलिए बेहतर प्रदर्शन प्राप्त किया जा सकता है। इसके विशिष्ट फायदे इस प्रकार हैंः
डबल ईएमए प्रणाली का उपयोग करके प्रमुख रुझानों की दिशा निर्धारित करने के लिए, मूल्य रुझानों को प्रभावी ढंग से ट्रैक किया जा सकता है।
आरएसआई संकेतक अल्पकालिक ओवरबॉय और ओवरसोल की पहचान करने में मदद करता है, यह निर्धारित करने में मदद करता है कि कब प्रवेश करना है।
एटीआर सूचकांक के माध्यम से सेट किया गया है, जो बाजार की अस्थिरता के आधार पर स्टॉप लॉस को समायोजित कर सकता है, जो जोखिम नियंत्रण के लिए फायदेमंद है।
ट्रेंड ट्रेडिंग के सिद्धांतों का सख्ती से पालन करने से अनावश्यक ट्रेडिंग को कम किया जा सकता है और सिस्टम जोखिम को कम किया जा सकता है।
जोखिम विश्लेषण
इस रणनीति में मुख्य रूप से निम्नलिखित जोखिम हैं:
प्रवृत्ति के उतार-चढ़ाव के कमजोर होने के दौरान, गलत ट्रेडिंग सिग्नल उत्पन्न हो सकते हैं। इस समय समय पर विचार करने और सावधानीपूर्वक प्रवेश करने की आवश्यकता है।
चरम स्थितियों में, एटीआर सूचक द्वारा निर्धारित रोकथाम बहुत बड़ी या बहुत छोटी हो सकती है, और इसे गतिशील रूप से समायोजित करने की आवश्यकता हो सकती है। अन्य रोकथाम विधियों के साथ प्रतिस्थापन पर भी विचार किया जा सकता है।
ट्रेडिंग सिग्नल उच्च आवृत्ति उत्पन्न कर सकते हैं, ध्यान देने की आवश्यकता है कि क्या यह अपनी ट्रेडिंग आवृत्ति वरीयताओं के अनुरूप है।
ध्यान दें कि आरएसआई पैरामीटर सही तरीके से सेट किए गए हैं या नहीं, और जब उपयुक्त हो तो पैरामीटर अनुकूलित करें।
अनुकूलन दिशा
इस रणनीति में निम्नलिखित प्रमुख अनुकूलन हैं:
अन्य रुझान संकेतकों जैसे कि MACD का परीक्षण किया जा सकता है, जो रुझान की दिशा का आकलन करने में मदद करता है।
बेहतर ट्रेडिंग सिग्नल के लिए आरएसआई के साथ केडीजे, बुलिन बैंड और अन्य रिवर्स इंडिकेटर का परीक्षण किया जा सकता है।
मशीन लर्निंग एल्गोरिदम को लागू किया जा सकता है, जो गतिशील स्टॉप लॉस और स्टॉप को समायोजित करने के लिए पैरामीटर को अनुकूलित कर सकता है।
भावनात्मक संकेतकों, समाचारों और अन्य कारकों के साथ निर्णय लेने से सिस्टम की समग्र स्थिरता में सुधार होता है।
संक्षेप
इस रणनीति के लिए कुल मिलाकर एक बहुत ही विशिष्ट संयोजन ट्रेंड ट्रैकिंग और उलटा सूचक की एक छोटी सी रणनीति है. यह दोहरी ईएमए का उपयोग करके बड़े रुझान का आकलन करने के लिए, जबकि आरएसआई सूचक की उलटा विशेषता का उपयोग प्रवृत्ति में पकड़ने के लिए Pullback अवसरों में शामिल है. सिद्धांत रूप में, इस रणनीति के विभिन्न संकेतकों के फायदे के संयोजन में एक साथ, फार्म एक अच्छा पूरक प्रभाव है. यदि बाद में पैरामीटर अनुकूलन, मॉडल एकीकरण आदि के माध्यम से सुधार किया जाता है, तो इस रणनीति की प्रभावशीलता में काफी सुधार की जगह है.
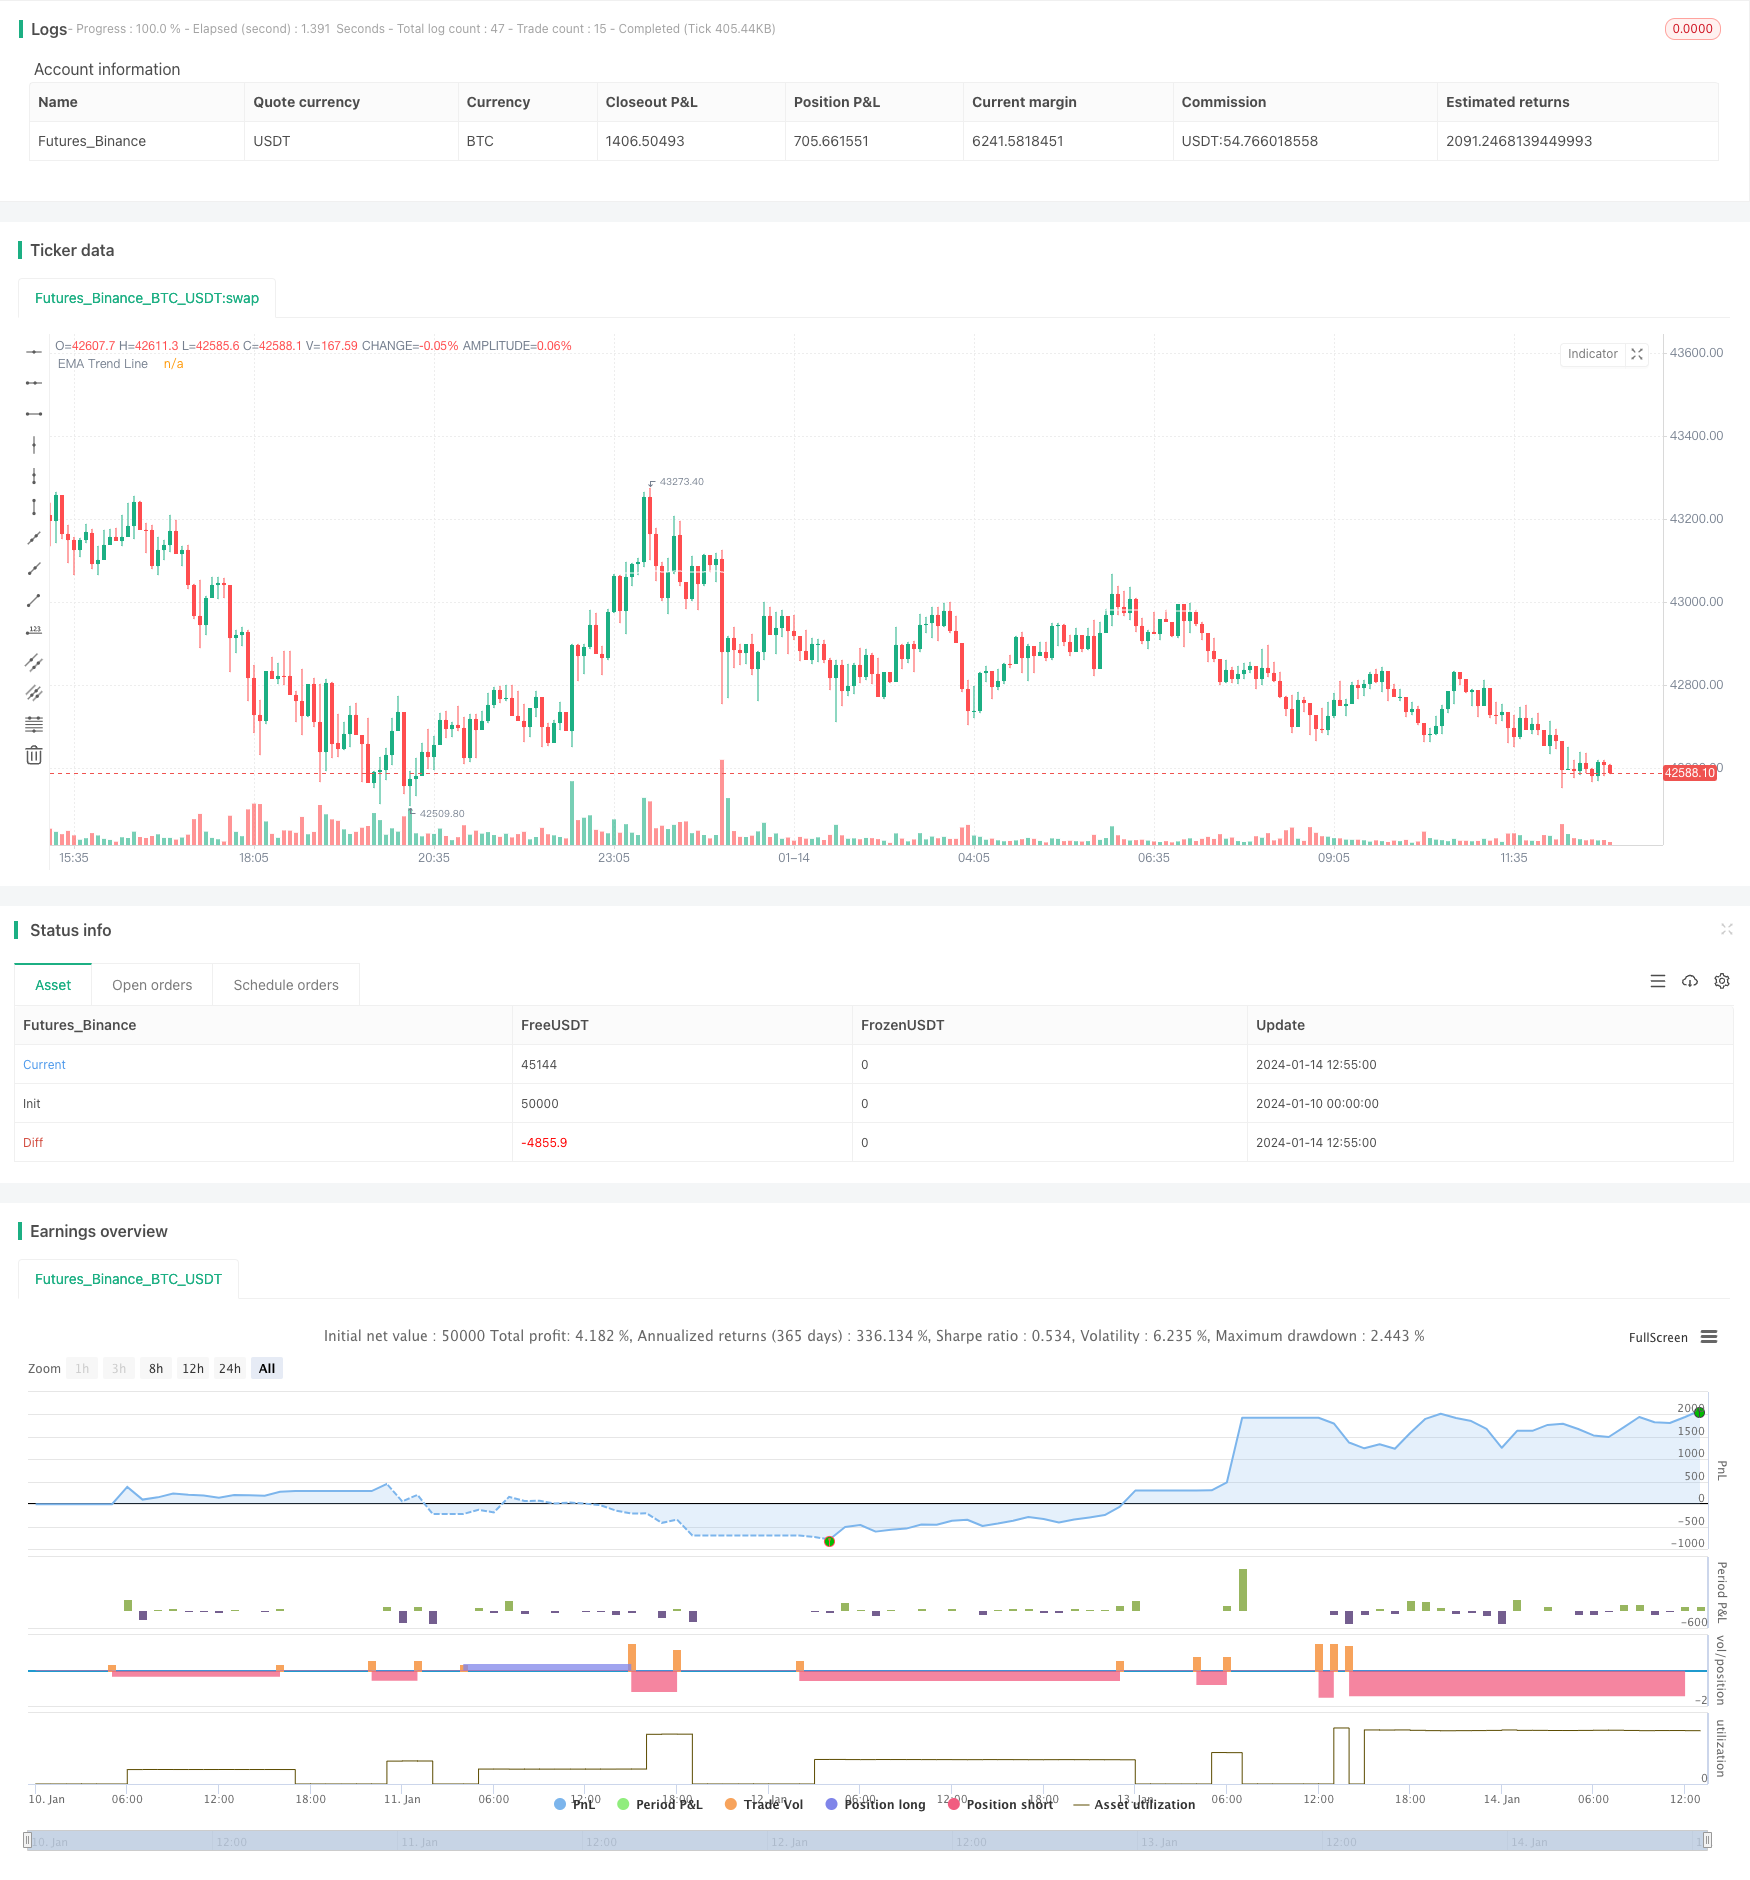
/*backtest
start: 2024-01-10 00:00:00
end: 2024-01-14 13:00:00
period: 5m
basePeriod: 1m
exchanges: [{"eid":"Futures_Binance","currency":"BTC_USDT"}]
*/

// This source code is subject to the terms of the Mozilla Public License 2.0 at https://mozilla.org/MPL/2.0/
// © kevinmck100

// @description
// This strategy is intended to be used as a base template for building new strategies.
//
// It incorporates the following features:
//
//      - Risk management:  Configurable X% loss per stop loss
//                          Configurable R:R ratio
//
//      - Trade entry:      Calculated position size based on risk tolerance
//
//      - Trade exit:       Stop Loss currently configurable ATR multiplier but can be replaced based on strategy
//                          Take Profit calculated from Stop Loss using R:R ratio
//
//      - Backtesting:      Configurable backtesting range by date
//
//      - Trade drawings:   TP/SL boxes drawn for all trades. Can be turned on and off
//                          Trade exit information labels. Can be turned on and off
//                          NOTE: Trade drawings will only be applicable when using overlay strategies
//
//      - Debugging:        Includes section with useful debugging techniques
//
// Strategy conditions:
//
//      - Trade entry:      LONG:   C1: Price is above EMA line
//                                  C2: RSI is crossing out of oversold area
//                          SHORT:  C1: Price is below EMA line
//                                  C2: RSI is crossing out of overbought area
//
//      - Trade exit:       Stop Loss:      Stop Loss ATR multiplier is hit
//                          Take Profit:    R:R multiplier * Stop Loss is hit
//
// The idea is to use RSI to catch pullbacks within the main trend. Note that
// this strategy is intended to be a simple base strategy for building upon.
// It was not designed to be traded in its current form.

//@version=5
INITIAL_CAPITAL = 1000
DEFAULT_COMMISSION = 0.02
MAX_DRAWINGS = 500
IS_OVERLAY = true

strategy("Risk Management Strategy Template", "Strategy Template", overlay = IS_OVERLAY, initial_capital = INITIAL_CAPITAL, currency = currency.NONE, max_labels_count = MAX_DRAWINGS, max_boxes_count = MAX_DRAWINGS, max_lines_count = MAX_DRAWINGS, default_qty_type = strategy.cash, commission_type = strategy.commission.percent, commission_value = DEFAULT_COMMISSION)

// =============================================================================
// INPUTS
// =============================================================================

// ------------------------ Replacable section - Start -------------------------
// ------------------
// Indicator Settings
// ------------------
emaLength           = input.int (200,   "EMA Length          ",             group = "Indicators: Settings",         inline = "IS1", minval = 1,                 tooltip = "EMA line to identify trend direction. Above EMA trend line is bullish. Below EMA trend line is bearish")
rsiLength           = input.int (10,    "RSI Length            ",           group = "Indicators: Settings",         inline = "IS2", minval = 1)

// ----------------------
// Trade Entry Conditions
// ----------------------
rsiOverbought       = input.int (60,    "RSI Overbought        ",           group = "Strategy: Conditions",         inline = "SC1", minval = 50, maxval = 100,  tooltip = "RSI overbought level used to identify pullbacks within the main trend. RSI crossing BELOW this level triggers a SHORT when in a DOWN trend")
rsiOversold         = input.int (40,    "RSI Oversold          ",           group = "Strategy: Conditions",         inline = "SC2", minval = 0,  maxval = 50,   tooltip = "RSI overbought level used to identify pullbacks within the main trend. RSI crossing ABOVE this level triggers a LONG when in an UP trend")

// ---------------------
// Trade Exit Conditions
// ---------------------
atrLength           = input.int  (14,   "Stop Loss ATR Length      ",       group = "Strategy: Exit Conditions",    inline = "EC1", minval = 0,                 tooltip = "Length of ATR used to calculate Stop Loss.")
slAtrMultiplier     = input.float(4,    "Stop Loss ATR Multiplier     ",    group = "Strategy: Exit Conditions",    inline = "EC2", minval = 0, step = 0.1,     tooltip = "Size of StopLoss is determined by multiplication of ATR value. Take Profit is derived from this also by multiplying the StopLoss value by the Risk:Reward multiplier.")
// ------------------------- Replacable section - End --------------------------

// ---------------
// Risk Management
// ---------------
riskReward          = input.float(2,    "Risk : Reward        1 :",         group = "Strategy: Risk Management",    inline = "RM1", minval = 0, step = 0.1,     tooltip = "Previous high or low (long/short dependant) is used to determine TP level. 'Risk : Reward' ratio is then used to calculate SL based of previous high/low level.\n\nIn short, the higher the R:R ratio, the smaller the SL since TP target is fixed by previous high/low price data.")
accountRiskPercent  = input.float(1,    "Portfolio Risk %         ",        group = "Strategy: Risk Management",    inline = "RM1", minval = 0, step = 0.1,     tooltip = "Percentage of portfolio you lose if trade hits SL.\n\nYou then stand to gain\n  Portfolio Risk % * Risk : Reward\nif trade hits TP.")

// ----------
// Date Range
// ----------
startYear           = input.int (2022,  "Start Date       ",                group = 'Strategy: Date Range',         inline = 'DR1', minval    = 1900, maxval = 2100)
startMonth          = input.int (1,     "",                                 group = 'Strategy: Date Range',         inline = 'DR1', options   = [1, 2, 3, 4, 5, 6, 7, 8, 9, 10, 11, 12])
startDate           = input.int (1,     "",                                 group = 'Strategy: Date Range',         inline = 'DR1', options   = [1, 2, 3, 4, 5, 6, 7, 8, 9, 10, 11, 12, 13, 14, 15, 16, 17, 18, 19, 20, 21, 22, 23, 24, 25, 26, 27, 28, 29, 30, 31])
endYear             = input.int (2100,  "End Date      ",                   group = 'Strategy: Date Range',         inline = 'DR2', minval    = 1900, maxval = 2100)
endMonth            = input.int (1,     "",                                 group = 'Strategy: Date Range',         inline = 'DR2', options   = [1, 2, 3, 4, 5, 6, 7, 8, 9, 10, 11, 12])
endDate             = input.int (1,     "",                                 group = 'Strategy: Date Range',         inline = 'DR2', options   = [1, 2, 3, 4, 5, 6, 7, 8, 9, 10, 11, 12, 13, 14, 15, 16, 17, 18, 19, 20, 21, 22, 23, 24, 25, 26, 27, 28, 29, 30, 31])

// ----------------
// Drawing Settings
// ----------------
showTpSlBoxes       = input.bool(false,  "Show TP / SL Boxes",               group = "Strategy: Drawings",           inline = "D1",  tooltip = "Show or hide TP and SL position boxes.\n\nNote: TradingView limits the maximum number of boxes that can be displayed to 500 so they may not appear for all price data under test.")
showLabels          = input.bool(false, "Show Trade Exit Labels",           group = "Strategy: Drawings",           inline = "D2",  tooltip = "Useful labels to identify Profit/Loss and cumulative portfolio capital after each trade closes.\n\nAlso note that TradingView limits the max number of 'boxes' that can be displayed on a chart (max 500). This means when you lookback far enough on the chart you will not see the TP/SL boxes. However you can check this option to identify where trades exited.")

// =============================================================================
// INDICATORS
// =============================================================================

// ------------------------ Replacable section - Start -------------------------
// ---
// EMA
// ---
ema = ta.ema(close, emaLength)
plot(ema, "EMA Trend Line", color.white)

// ---
// RSI
// ---
rsi = ta.rsi(close, rsiLength)
// ------------------------- Replacable section - End --------------------------


// =============================================================================
// STRATEGY LOGIC
// =============================================================================

// ---------
// FUNCTIONS
// ---------

percentAsPoints(pcnt) =>
    math.round(pcnt / 100 * close / syminfo.mintick)

calcStopLossPrice(pointsOffset, isLong) =>
    priceOffset = pointsOffset * syminfo.mintick
    if isLong
        close - priceOffset
    else
        close + priceOffset

calcProfitTrgtPrice(pointsOffset, isLong) =>
    calcStopLossPrice(-pointsOffset, isLong)


printLabel(barIndex, msg) => label.new(barIndex, close, msg)

printTpSlHitBox(left, right, slHit, tpHit, entryPrice, slPrice, tpPrice) =>
    if showTpSlBoxes
        box.new (left = left,   top = entryPrice,   right = right,  bottom = slPrice,   bgcolor = slHit ? color.new(color.red, 60)   : color.new(color.gray, 90), border_width = 0)
        box.new (left = left,   top = entryPrice,   right = right,  bottom = tpPrice,   bgcolor = tpHit ? color.new(color.green, 60) : color.new(color.gray, 90), border_width = 0)
        line.new(x1 = left,     y1 = entryPrice,    x2 = right,     y2 = entryPrice,    color = color.new(color.yellow, 20))
        line.new(x1 = left,     y1 = slPrice,       x2 = right,     y2 = slPrice,       color = color.new(color.red, 20))
        line.new(x1 = left,     y1 = tpPrice,       x2 = right,     y2 = tpPrice,       color = color.new(color.green, 20))

printTpSlNotHitBox(left, right, entryPrice, slPrice, tpPrice) =>
    if showTpSlBoxes
        box.new (left = left,   top = entryPrice,   right = right,  bottom = slPrice,   bgcolor = color.new(color.gray, 90), border_width = 0)
        box.new (left = left,   top = entryPrice,   right = right,  bottom = tpPrice,   bgcolor = color.new(color.gray, 90), border_width = 0)
        line.new(x1 = left,     y1 = entryPrice,    x2 = right,     y2 = entryPrice,    color = color.new(color.yellow, 20))
        line.new(x1 = left,     y1 = slPrice,       x2 = right,     y2 = slPrice,       color = color.new(color.red, 20))
        line.new(x1 = left,     y1 = tpPrice,       x2 = right,     y2 = tpPrice,       color = color.new(color.green, 20))

printTradeExitLabel(x, y, posSize, entryPrice, pnl) =>
    if showLabels
        labelStr = "Position Size: " + str.tostring(math.abs(posSize), "#.##") + "\nPNL: " + str.tostring(pnl, "#.##") + "\nCapital: " + str.tostring(strategy.equity, "#.##") + "\nEntry Price: " + str.tostring(entryPrice, "#.##")
        label.new(x = x, y = y, text = labelStr, color = pnl > 0 ? color.new(color.green, 60) : color.new(color.red, 60), textcolor = color.white, style = label.style_label_down)

// ----------
// CONDITIONS
// ----------

inDateRange         = time >= timestamp(syminfo.timezone, startYear, startMonth, startDate, 0, 0) and time < timestamp(syminfo.timezone, endYear, endMonth, endDate, 0, 0)

// ------------------------ Replacable section - Start -------------------------
// Condition 1: Price above EMA indicates bullish trend, price below EMA indicates bearish trend
bullEma             = close > ema
bearEma             = close < ema

// Condition 2: RSI crossing back from overbought/oversold indicates pullback within trend
bullRsi             = ta.crossover  (rsi, rsiOversold)
bearRsi             = ta.crossunder (rsi, rsiOverbought)

// Combine all entry conditions
goLong              = inDateRange and bullEma and bullRsi
goShort             = inDateRange and bearEma and bearRsi
// ------------------------- Replacable section - End --------------------------

// Trade entry and exit variables
var tradeEntryBar   = bar_index
var profitPoints    = 0.
var lossPoints      = 0.
var slPrice         = 0.
var tpPrice         = 0.
var inLong          = false
var inShort         = false

// Entry decisions
openLong            = (goLong and not inLong)
openShort           = (goShort and not inShort)
flippingSides       = (goLong and inShort) or (goShort and inLong)
enteringTrade       = openLong or openShort
inTrade             = inLong or inShort

// ------------------------ Replacable section - Start -------------------------
// Exit calculations
atr                 = ta.atr(atrLength)
slAmount            = atr * slAtrMultiplier
slPercent           = math.abs((1 - (close - slAmount) / close) * 100)
tpPercent           = slPercent * riskReward
// ------------------------- Replacable section - End --------------------------

// Risk calculations
riskAmt             = strategy.equity * accountRiskPercent / 100
entryQty            = math.abs(riskAmt / slPercent * 100)  / close

if openLong
    if strategy.position_size < 0
        printTpSlNotHitBox(tradeEntryBar + 1, bar_index + 1, strategy.position_avg_price, slPrice, tpPrice)
        printTradeExitLabel(bar_index + 1, math.max(tpPrice, slPrice), strategy.position_size, strategy.position_avg_price, strategy.openprofit)
    strategy.entry("Long", strategy.long, qty = entryQty, alert_message = "Long Entry")
    enteringTrade   := true
    inLong          := true
    inShort         := false

if openShort
    if strategy.position_size > 0
        printTpSlNotHitBox(tradeEntryBar + 1, bar_index + 1, strategy.position_avg_price, slPrice, tpPrice)
        printTradeExitLabel(bar_index + 1, math.max(tpPrice, slPrice), strategy.position_size, strategy.position_avg_price, strategy.openprofit)
    strategy.entry("Short", strategy.short, qty = entryQty, alert_message = "Short Entry")
    enteringTrade   := true
    inShort         := true
    inLong          := false

if enteringTrade
    profitPoints    := percentAsPoints(tpPercent)
    lossPoints      := percentAsPoints(slPercent)
    slPrice         := calcStopLossPrice(lossPoints, openLong)
    tpPrice         := calcProfitTrgtPrice(profitPoints, openLong)
    tradeEntryBar   := bar_index

strategy.exit("TP/SL", profit = profitPoints, loss = lossPoints, comment_profit = "TP Hit", comment_loss = "SL Hit", alert_profit = "TP Hit Alert", alert_loss = "SL Hit Alert")

// =============================================================================
// DRAWINGS
// =============================================================================

// -----------
// TP/SL Boxes
// -----------

slHit           = (inShort and high >= slPrice) or (inLong  and low <= slPrice)
tpHit           = (inLong  and high >= tpPrice) or (inShort and low <= tpPrice)
exitTriggered   = slHit or tpHit
entryPrice      = strategy.closedtrades.entry_price (strategy.closedtrades - 1)
pnl             = strategy.closedtrades.profit      (strategy.closedtrades - 1)
posSize         = strategy.closedtrades.size        (strategy.closedtrades - 1)

// Print boxes for trades closed at profit or loss
if (inTrade and exitTriggered)
    inShort    := false
    inLong     := false
    printTpSlHitBox(tradeEntryBar + 1, bar_index, slHit, tpHit, entryPrice, slPrice, tpPrice)
    printTradeExitLabel(bar_index, math.max(tpPrice, slPrice), posSize, entryPrice, pnl)

// Print TP/SL box for current open trade
if barstate.islastconfirmedhistory and strategy.position_size != 0
    printTpSlNotHitBox(tradeEntryBar + 1, bar_index + 1, strategy.position_avg_price, slPrice, tpPrice)

// =============================================================================
// DEBUGGING
// =============================================================================

// Data window plots
plotchar(slPrice,    "Stop Loss Price",     "")
plotchar(tpPrice,    "Take Profit Price",   "")

// Label plots
plotDebugLabels = false
if plotDebugLabels
    if bar_index == tradeEntryBar
        printLabel(bar_index, "Position size: " + str.tostring(entryQty * close, "#.##"))