चलती औसत विचलन की रणनीति

लेखक:चाओझांग, दिनांकः 2024-01-24 11:43:41
टैगः

img

अवलोकन

यह रणनीति मूल्य और चलती औसत रेखा के बीच विचलन का पता लगाती है, और उन्हें खरीद और बिक्री संकेत के रूप में उपयोग करती है। यह विचलन खोजने के लिए किसी भी थरथरानवाला पर लागू किया जा सकता है। यह एक मूल्यवान उपकरण है जिसका उपयोग बैकटेस्टिंग और लाइव ट्रेडिंग के लिए किया जा सकता है।

रणनीति तर्क

  1. लंबाई के चलती औसत (एमए) की गणना करें
  2. एमए के पिवोट लो (पीएल) और पिवोट हाई (पीएच) बिंदुओं का पता लगाना
  3. तेजी से विचलन की जाँच करें: कीमत नई निम्न बनाता है लेकिन एमए नहीं करता है या एमए नई निम्न बनाता है लेकिन कीमत नहीं करता है
  4. मंदी की भिन्नता की जाँच करें: कीमत नई उच्च बनाता है लेकिन एमए नहीं करता या एमए नई उच्च बनाता है लेकिन कीमत नहीं करता
  5. भिन्नता के आधार पर खरीद और बिक्री

लाभ विश्लेषण

  1. कीमत और एमए के बीच मतभेदों का स्वचालित रूप से पता लगाएं, मैन्युअल निर्णय त्रुटियों से बचें
  2. किसी भी ऑसिलेटर पर लागू, मजबूत विस्तार
  3. लाभप्रदता के बैकटेस्ट और सत्यापन के लिए इस्तेमाल किया जा सकता है
  4. संवेदनशीलता को समायोजित करने और झूठे संकेतों से बचने के लिए कॉन्फ़िगर करने योग्य पैरामीटर
  5. सटीक और व्यापक निर्णय के लिए कई विचलन प्रकार प्रदान करें

जोखिम विश्लेषण

  1. अमान्य ऑसिलेटर सेटिंग्स अत्यधिक झूठे संकेत उत्पन्न कर सकती हैं
  2. विचलन होने से पहले आवश्यक वैध पिव्हट पॉइंट्स, सिग्नल अपर्याप्त हो सकते हैं
  3. संवेदनशीलता को संतुलित करने और झूठे संकेतों को फ़िल्टर करने के लिए मापदंडों को समायोजित करने की आवश्यकता
  4. अन्य कारकों के साथ मिलकर बेहतर काम करता है, अकेले इस्तेमाल होने पर अपेक्षाकृत कम आत्मविश्वास

अनुकूलन दिशाएँ

  1. सर्वोत्तम पैरामीटर संयोजन खोजने के लिए एमए मापदंडों का अनुकूलन करें
  2. झूठे संकेतों से बचने के लिए वॉल्यूम जैसे अन्य संकेतकों के साथ संयोजन
  3. भिन्नता विश्वसनीयता का न्याय करने के लिए मशीन सीखने मॉडल जोड़ें
  4. प्रति व्यापार हानि को नियंत्रित करने के लिए जोखिम प्रबंधन तंत्र जोड़ें

सारांश

यह रणनीति स्वयंचलित निर्णय के लिए मूल्य और एमए के बीच विचलन का उपयोग करती है। यह व्यापक रूप से मजबूत विस्तार के साथ किसी भी थरथरानवाला पर लागू किया जा सकता है। सिग्नल विश्वसनीयता और सिस्टम स्थिरता में काफी सुधार के लिए पैरामीटर अनुकूलन और अन्य संकेतकों के साथ उपयोग की आवश्यकता होती है।


/*backtest
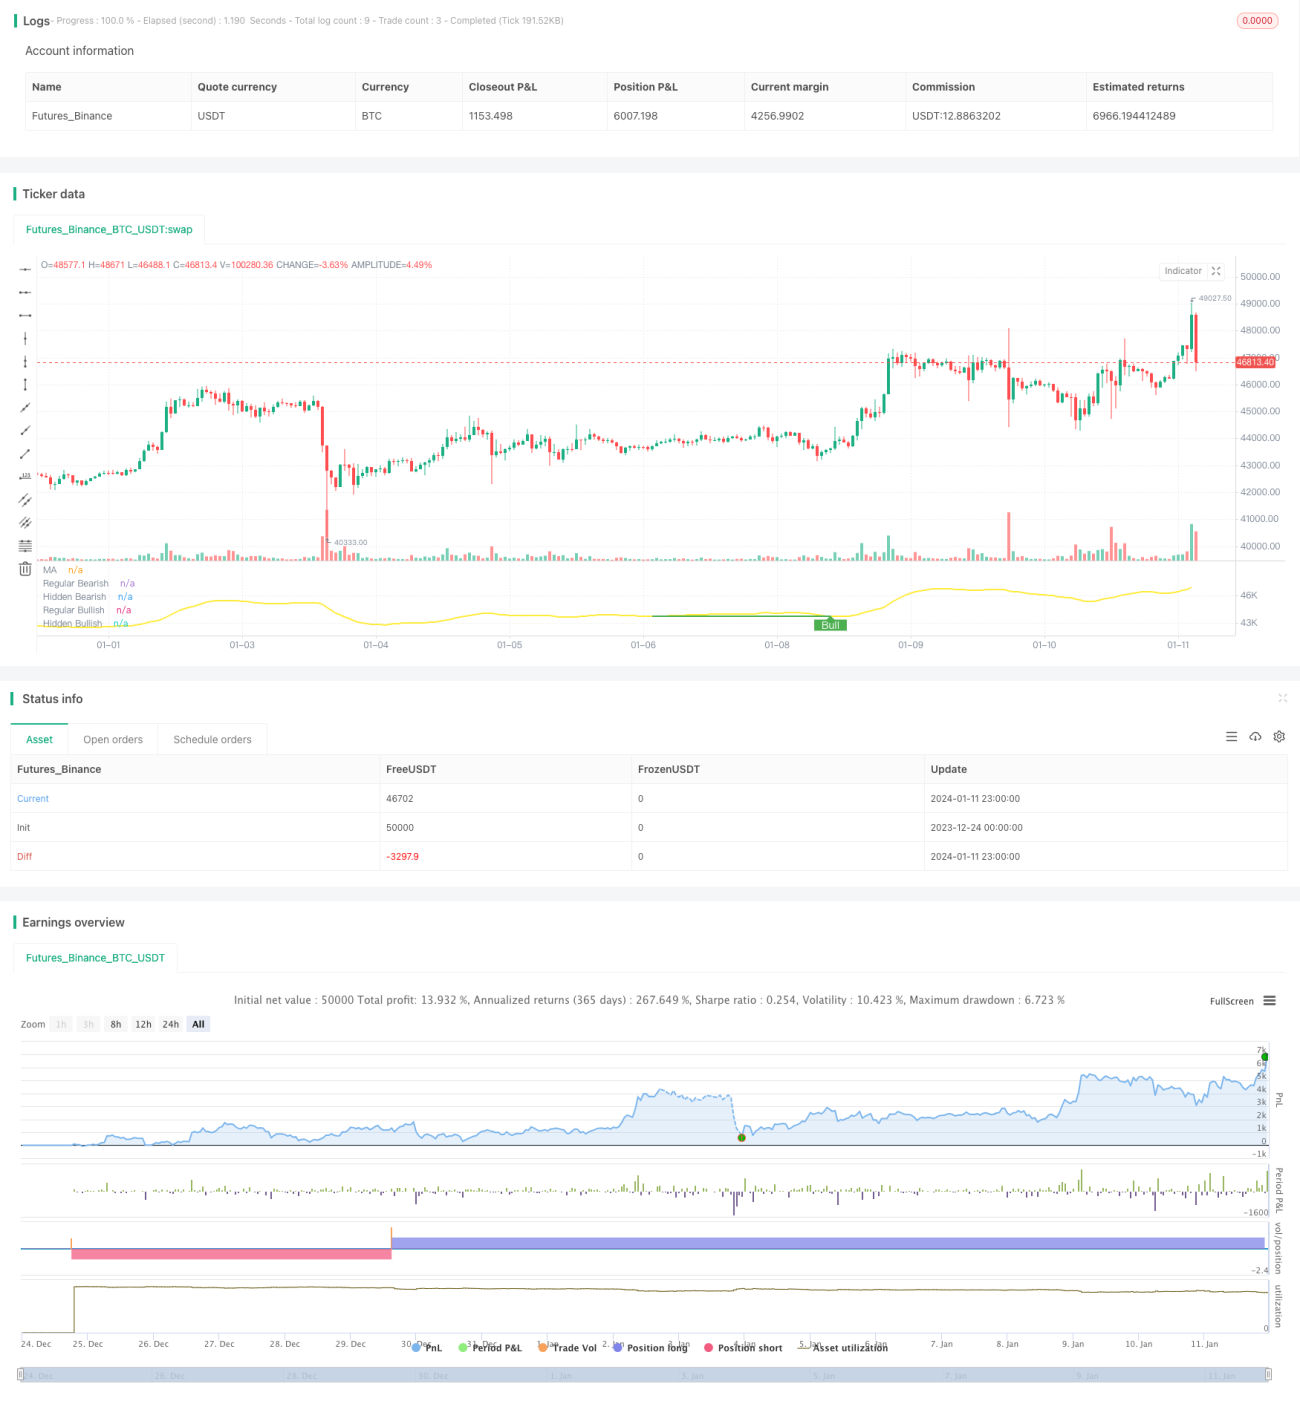
start: 2023-12-24 00:00:00
end: 2024-01-12 00:00:00
period: 1h
basePeriod: 15m
exchanges: [{"eid":"Futures_Binance","currency":"BTC_USDT"}]
*/

// This source code is subject to the terms of the Mozilla Public License 2.0 at https://mozilla.org/MPL/2.0/
// © tista 
//https://www.tradingview.com/u/tista/#published-scripts

//@version=4

strategy(title="MA Divergences", format=format.price)

//* Backtesting Period Selector | Component *//
//* https://www.tradingview.com/script/eCC1cvxQ-Backtesting-Period-Selector-Component *//
//* https://www.tradingview.com/u/pbergden/ *//
//* Modifications made *//
testStartYear = input(2021, "Backtest Start Year") 
testStartMonth = input(1, "Backtest Start Month")
testStartDay = input(1, "Backtest Start Day")
testPeriodStart = timestamp(testStartYear,testStartMonth,testStartDay,0,0)

testStopYear = input(999999, "Backtest Stop Year")
testStopMonth = input(9, "Backtest Stop Month")
testStopDay = input(26, "Backtest Stop Day")
testPeriodStop = timestamp(testStopYear,testStopMonth,testStopDay,0,0)

testPeriod() => true
/////////////// END - Backtesting Period Selector | Component ///////////////
len = input(title="MA Period", minval=1, defval=14)
src = input(title="MA Source", defval=close)
lbR = input(title="Pivot Lookback Right", defval=5)
lbL = input(title="Pivot Lookback Left", defval=5)
rangeUpper = input(title="Max of Lookback Range", defval=600)
rangeLower = input(title="Min of Lookback Range", defval=2)
plotBull = input(title="Plot Bullish", defval=true)
plotHiddenBull = input(title="Plot Hidden Bullish", defval=true)
plotBear = input(title="Plot Bearish", defval=true)
plotHiddenBear = input(title="Plot Hidden Bearish", defval=true)

bearColor = color.red
bullColor = color.green
hiddenBullColor = color.green
hiddenBearColor = color.red
textColor = color.white
noneColor = color.new(color.white, 100)

osc = wma(src, len)

plot(osc, title="MA", linewidth=2, color=color.yellow)

plFound = na(pivotlow(osc, lbL, lbR)) ? false : true
phFound = na(pivothigh(osc, lbL, lbR)) ? false : true

_inRange(cond) =>
    bars = barssince(cond == true)
    rangeLower <= bars and bars <= rangeUpper

alertcondition(osc[1] > 100.0 and osc[2] < 100.0, title="MA value crosses over 100.0", message="Check charts for a MA cross over 100.0")
alertcondition(osc[1] < 100.0 and osc[2] > 100.0, title="MA value crosses under 100.0", message="Check charts for a MA cross under 100.0")
alertcondition(osc[1] > -100. and osc[2] < -100.0, title="MA value crosses over -100.0", message="Check charts for a MA cross over -100.0")
alertcondition(osc[1] < -100.0 and osc[2] > -100.0, title="MA value crosses under -100.0", message="Check charts for a MA cross under -100.0")

//------------------------------------------------------------------------------
// Regular Bullish

// Osc: Higher Low
oscHL = osc[lbR] > valuewhen(plFound, osc[lbR], 1) and _inRange(plFound[1])

// Price: Lower Low
priceLL = low[lbR] < valuewhen(plFound, low[lbR], 1)

bullCond = plotBull and priceLL and oscHL and plFound

plot(
	 plFound ? osc[lbR] : na,
	 offset=-lbR,
	 title="Regular Bullish",
	 linewidth=2,
	 color=(bullCond ? bullColor : noneColor),
	 transp=0
	 )

plotshape(
	 bullCond ? osc[lbR] : na,
	 offset=-lbR,
	 title="Regular Bullish Label",
	 text=" Bull ",
	 style=shape.labelup,
	 location=location.absolute,
	 color=bullColor,
	 textcolor=textColor,
	 transp=0
	 )

alertcondition(bullCond, title="Regular bullish divergence in MA found", message="Check charts for a regular bullish divergence found with MA")

//------------------------------------------------------------------------------
// Hidden Bullish

// Osc: Lower Low
oscLL = osc[lbR] < valuewhen(plFound, osc[lbR], 1) and _inRange(plFound[1])

// Price: Higher Low
priceHL = low[lbR] > valuewhen(plFound, low[lbR], 1)

hiddenBullCond = plotHiddenBull and priceHL and oscLL and plFound

plot(
	 plFound ? osc[lbR] : na,
	 offset=-lbR,
	 title="Hidden Bullish",
	 linewidth=2,
	 color=(hiddenBullCond ? hiddenBullColor : noneColor),
	 transp=0
	 )

plotshape(
	 hiddenBullCond ? osc[lbR] : na,
	 offset=-lbR,
	 title="Hidden Bullish Label",
	 text=" H Bull ",
	 style=shape.labelup,
	 location=location.absolute,
	 color=bullColor,
	 textcolor=textColor,
	 transp=0
	 )

alertcondition(hiddenBullCond, title="Hidden bullish divergence in MA found", message="Check charts for a hidden bullish divergence found with MA")

//------------------------------------------------------------------------------
// Regular Bearish

// Osc: Lower High
oscLH = osc[lbR] < valuewhen(phFound, osc[lbR], 1) and _inRange(phFound[1])

// Price: Higher High
priceHH = high[lbR] > valuewhen(phFound, high[lbR], 1)

bearCond = plotBear and priceHH and oscLH and phFound

plot(
	 phFound ? osc[lbR] : na,
	 offset=-lbR,
	 title="Regular Bearish",
	 linewidth=2,
	 color=(bearCond ? bearColor : noneColor),
	 transp=0
	 )

plotshape(
	 bearCond ? osc[lbR] : na,
	 offset=-lbR,
	 title="Regular Bearish Label",
	 text=" Bear ",
	 style=shape.labeldown,
	 location=location.absolute,
	 color=bearColor,
	 textcolor=textColor,
	 transp=0
	 )

alertcondition(bearCond, title="Regular bearish divergence in MA found", message="Check charts for a regular bearish divergence found with MA")

//------------------------------------------------------------------------------
// Hidden Bearish

// Osc: Higher High
oscHH = osc[lbR] > valuewhen(phFound, osc[lbR], 1) and _inRange(phFound[1])

// Price: Lower High
priceLH = high[lbR] < valuewhen(phFound, high[lbR], 1)

hiddenBearCond = plotHiddenBear and priceLH and oscHH and phFound

plot(
	 phFound ? osc[lbR] : na,
	 offset=-lbR,
	 title="Hidden Bearish",
	 linewidth=2,
	 color=(hiddenBearCond ? hiddenBearColor : noneColor),
	 transp=0
	 )

plotshape(
	 hiddenBearCond ? osc[lbR] : na,
	 offset=-lbR,
	 title="Hidden Bearish Label",
	 text=" H Bear ",
	 style=shape.labeldown,
	 location=location.absolute,
	 color=bearColor,
	 textcolor=textColor,
	 transp=0
	 )

// Alerts
//alertcondition(bearCond or hiddenBearCond, title='Bear div', message='Bear div')
//alertcondition(bullCond or hiddenBullCond, title='Bull div', message='Bull div')
//alertcondition(bearCond or bullCond, title='Bull or beal div', message='Bull or bear div') 
//alertcondition(hiddenBearCond or hiddenBullCond, title='Bull or beal div', message='Hidden Bull or bear div') 
//alertcondition(hiddenBearCond or hiddenBullCond or bearCond or bullCond, title='Bull or beal div', message='Any Bull or bear div') 

if testPeriod()
    if bullCond or hiddenBullCond
        strategy.entry("Buy", strategy.long)
    if bearCond or hiddenBearCond
        strategy.entry("Sell", strategy.short)

अधिक