मोमेंटम ब्रेकआउट शॉर्ट-टर्म ट्रेडिंग रणनीति
अवलोकन
यह रणनीति एसपीवाई ट्रेडिंग डेटा को ट्रैक करने के माध्यम से, कई तकनीकी संकेतक संकेतों जैसे कि मूविंग एवरेज, एमएसीडी, आरएसआई और अन्य के साथ मिलकर, शॉर्ट-ट्रेड ट्रेडिंग के लिए शॉर्ट-ट्रेड ट्रेडिंग के लिए शॉर्ट-ट्रेड ट्रेडिंग के लिए शॉर्ट-ट्रेड ट्रेडिंग के लिए शॉर्ट-ट्रेड ट्रेडिंग के लिए शॉर्ट-ट्रेड ट्रेडिंग के लिए शॉर्ट-ट्रेड ट्रेडिंग के लिए शॉर्ट-ट्रेड ट्रेडिंग के लिए शॉर्ट-ट्रेड ट्रेडिंग के लिए शॉर्ट-ट्रेड ट्रेडिंग के लिए शॉर्ट-ट्रेड ट्रेडिंग के लिए शॉर्ट-ट्रेड ट्रेडिंग के लिए शॉर्ट-ट्रेड ट्रेडिंग के लिए शॉर्ट-ट्रेड ट्रेडिंग के लिए शॉर्ट-ट्रेड ट्रेडिंग को ट्रैक करती है।
रणनीति सिद्धांत
इस रणनीति का मुख्य तर्क निम्न तकनीकी संकेतकों पर आधारित है जो अल्पकालिक रुझानों और प्रवेश के समय को निर्धारित करते हैंः
- 5 व 13 वें सूचकांक चलती औसत (ईएमए) के गोल्ड और डेड फोर्क्स का उपयोग बहुभाषी रुझानों को बदलने के लिए किया जाता है।
- MACD सूचकांक यह निर्धारित करता है कि ऊपर की ओर कोई गति है या नहीं।
- ADX सूचकांक में रुझानों का आकलन किया गया है।
- आरएसआई प्रवृत्ति की ताकत का आकलन करता है।
उपरोक्त संकेतक मापदंडों का अनुकूलन करके, महत्वपूर्ण बहु-क्षेत्र मोड़ बिंदुओं का निर्धारण करें। 5⁄6 शर्तों को पूरा करने पर एक सफेद संकेत संकेत एल या एस प्रदर्शित करें, और जब पूरी तरह से छह शर्तों को पूरा किया जाता है, तो उस पट्टिका को बंद करते समय एक सुनहरा △ आकार का संकेत प्रदर्शित करें।
खरीद संकेतों के लिए शर्तेंः
5 दिन का ईएमए 13 दिन के ईएमए से अधिक है और एमएसीडी लाइन 0.5 से कम है और एडीएक्स 20 से अधिक है और एमएसीडी स्लिप 0 से अधिक है और सिग्नल लाइन -0.1 से अधिक है और आरएसआई 40 से अधिक है
विक्रय संकेतों की स्थितिः
5 दिन ईएमए 13 दिन ईएमए से कम है और एमएसीडी लाइन -0.5 से अधिक है और एडीएक्स 20 से अधिक है और सिग्नल लाइन 0 से कम है और एमएसीडी स्लिप 0 से कम है और आरएसआई 60 से कम है
श्रेष्ठता विश्लेषण
इस रणनीति के निम्नलिखित फायदे हैं:
- विभिन्न संकेतकों के संयोजन से निर्णय की सटीकता अधिक होती है।
- पैरामीटर अनुकूलन के माध्यम से, निर्णय की संवेदनशीलता और सटीकता को संतुलित किया जाता है।
- सिग्नल निर्णय संक्षिप्त और स्पष्ट है, ऑपरेशन थ्रेशोल्ड कम है
- शॉर्ट-लाइन ट्रेडिंग के लिए उपयुक्त, अधिकांश निवेशकों की जोखिम वरीयताओं के अनुरूप।
- फिक्स्ड डिस्क ऑपरेशन की आवश्यकताओं को ध्यान में रखते हुए, समापन समय के उच्च उतार-चढ़ाव से बचें।
जोखिम विश्लेषण
इस रणनीति के साथ निम्नलिखित जोखिम भी हैं:
- अनुचित पैरामीटर सेटिंग गलत निर्णय के जोखिम को जन्म दे सकती है। निरंतर परीक्षण और अनुकूलन की आवश्यकता है।
- एकल नस्ल, उद्योग और परिसंपत्ति आवंटन जोखिमों को विभाजित करने में असमर्थ।
- लेन-देन शुल्क और स्लिप पॉइंट जोखिम जो बार-बार लेनदेन के कारण होते हैं।
- ट्रेक समय में जमा नहीं हो सका, कुछ मौके छूट सकते हैं
अनुकूलन दिशा
इस रणनीति को निम्नलिखित आयामों से अनुकूलित किया जा सकता हैः
- परीक्षण पैरामीटर सेटिंग्स को संशोधित करने के लिए, निर्णय की सटीकता में सुधार।
- एकल हानि को नियंत्रित करने के लिए स्टॉप लॉस को बढ़ाएं।
- ऑप्टिमाइज़ेशन ओपन टाइम, स्टैक्स के उच्च उतार-चढ़ाव के समय को फ़िल्टर करें
- अन्य नस्लों को रणनीतिक उद्देश्यों के रूप में जोड़ना।
- मशीन लर्निंग एल्गोरिदम के साथ पैरामीटर अनुकूलन क्षमता में सुधार।
संक्षेप
यह रणनीति एसपीवाई डेटा को ट्रैक करने के लिए, और कई तकनीकी संकेतकों जैसे कि चलती औसत, एमएसीडी, आरएसआई और अन्य के संयोजन के माध्यम से अल्पकालिक रुझानों का आकलन करने के लिए, उच्च संचालन आवृत्ति, कम वापसी, शॉर्ट-लाइन ट्रेडिंग के लिए बहुत उपयुक्त है। इसे कई आयामों से अनुकूलित किया जा सकता है, जिसमें सुधार के लिए काफी जगह है।
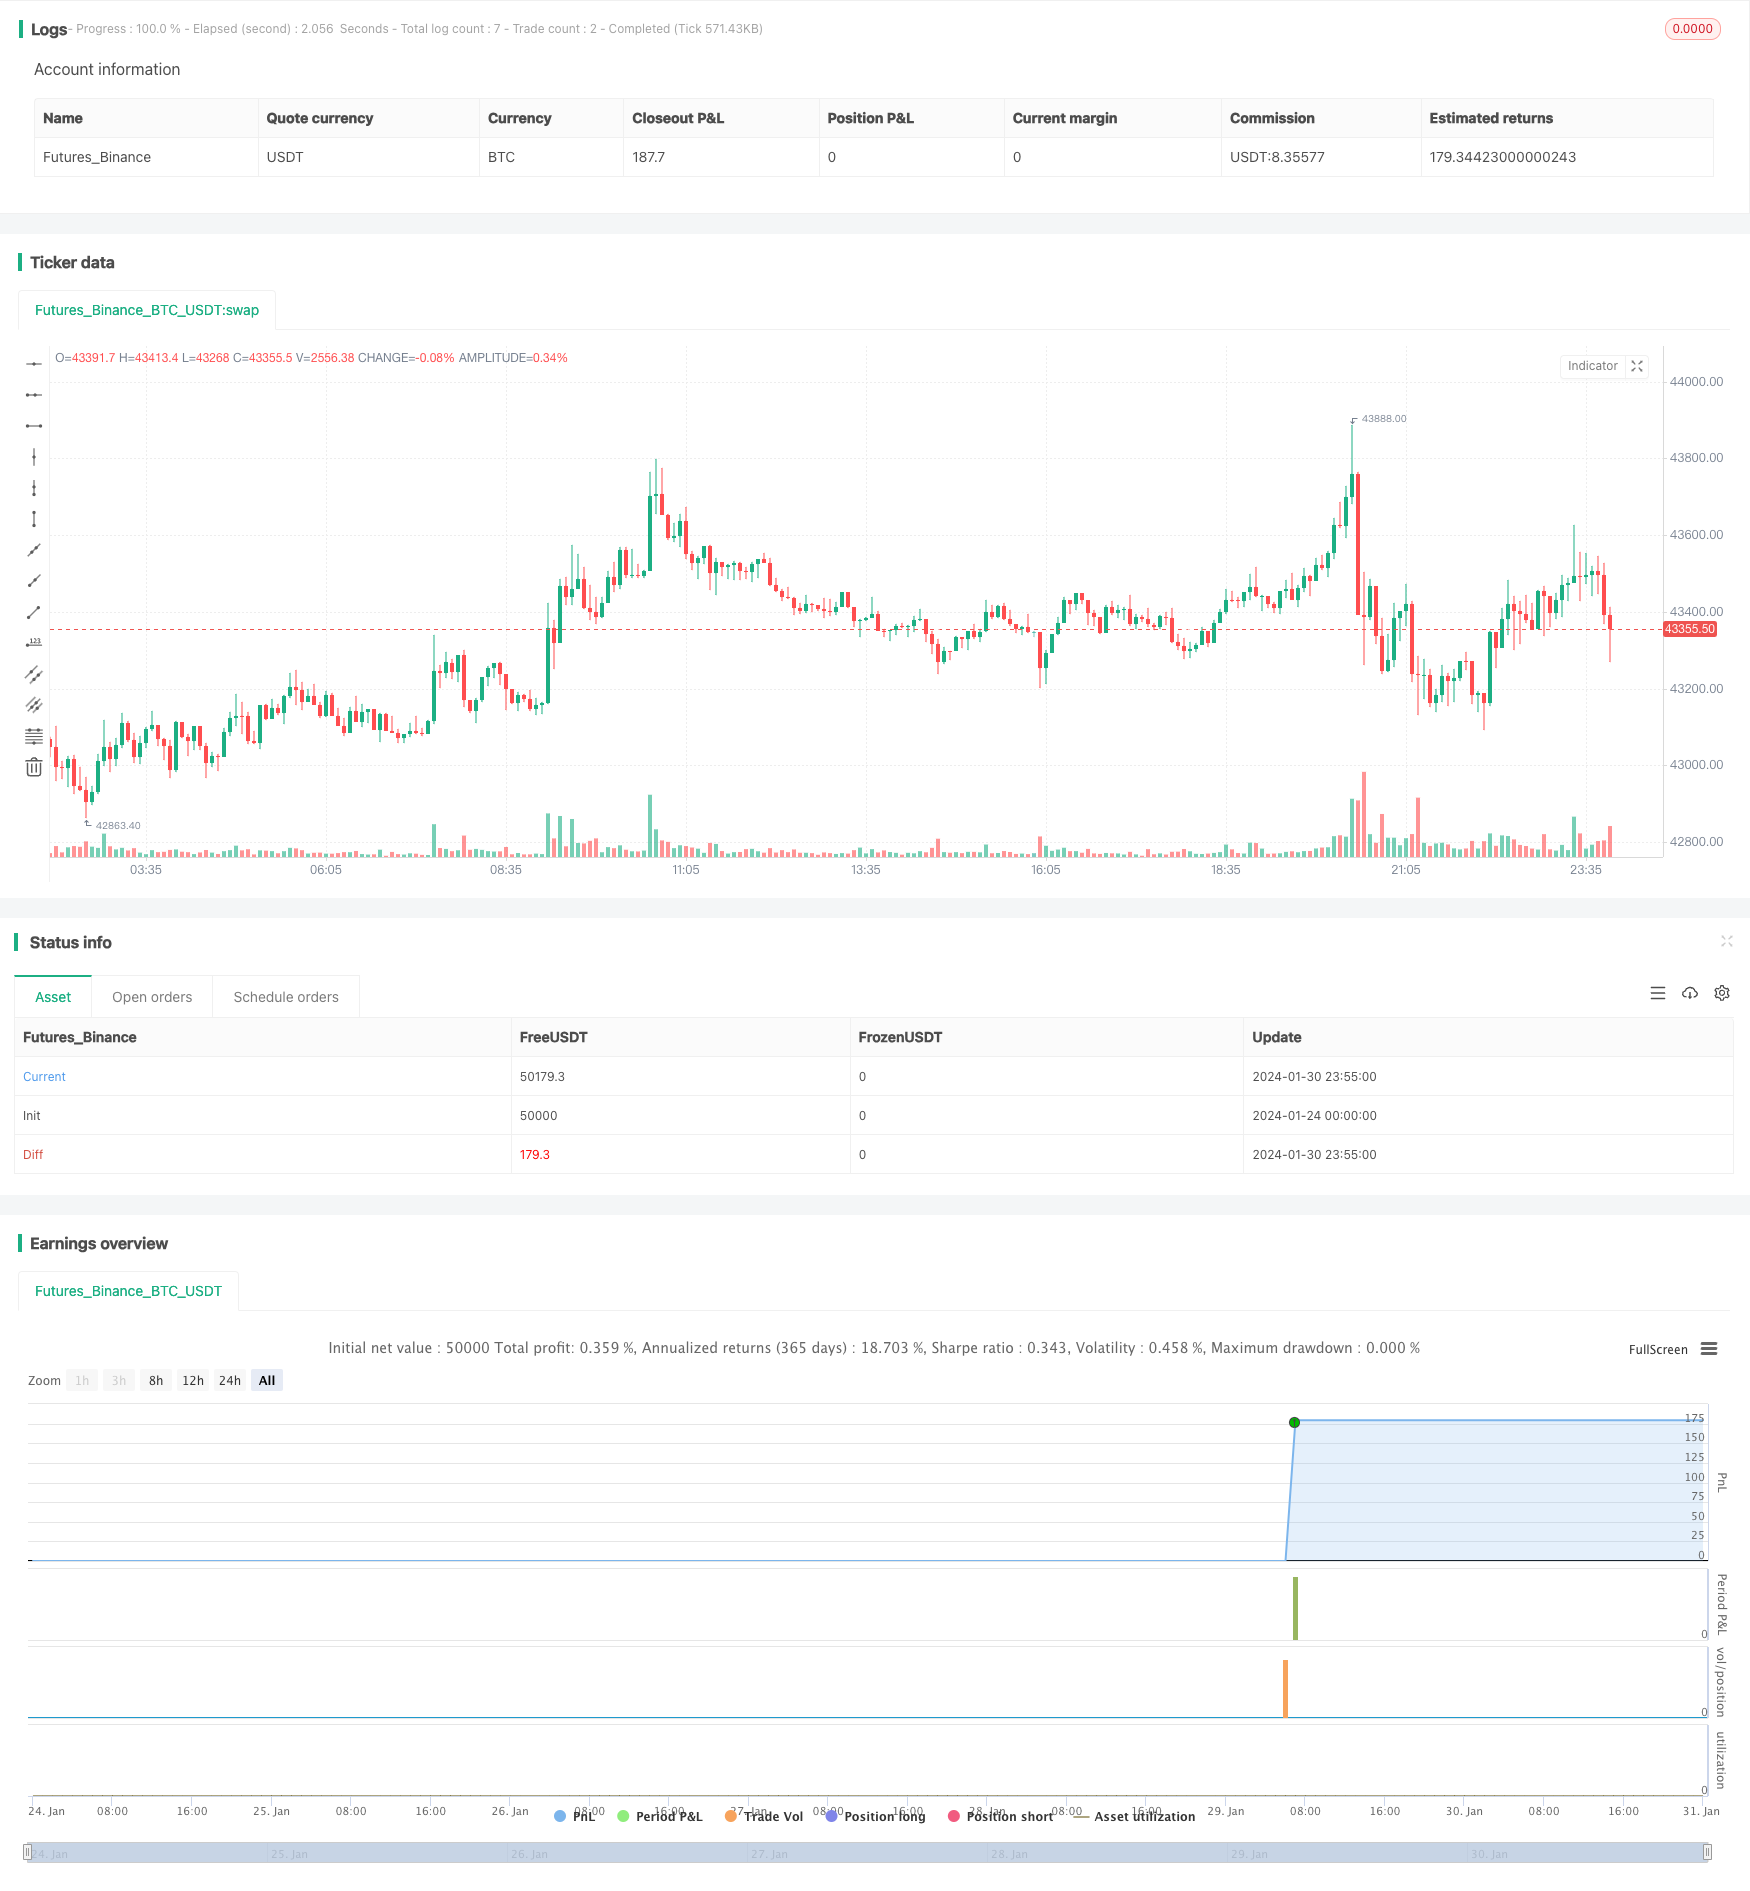
/*backtest
start: 2024-01-24 00:00:00
end: 2024-01-31 00:00:00
period: 5m
basePeriod: 1m
exchanges: [{"eid":"Futures_Binance","currency":"BTC_USDT"}]
*/

//@version=5
strategy(title="SPY 1 Minute Day Trader", overlay=true)

//This script has been created to take into account how the following variables impact trend for SPY 1 Minute
//The SPY stop losses/take profit have been set at 30 cents which equates to 15 cents on SPY 1 DTE ATM contracts
//5 ema vs 13 ema : A cross establishes start of trend
//MACD (Line, Signal & Slope) : If you have momentum
//ADX : if you are trending
//RSI : If the trend has strength
//The above has been optimized to determine pivot points in the trend using key values for these 6 indicators
//bounce up = ema5 > ema13 and macdLine < .5 and adx > 20 and macdSlope > 0 and signalLine > -.1 and rsiSignal > 40
//bounce down = ema5 < ema13 and macdLine > -.5 and adx > 20 and signalLine < 0 and macdSlope < 0 and rsiSignal < 60
//White L's indicate that 5 of 6 conditions are met due to impending uptrend w/ missing one in green below it
//Yellow L's indicate that 6 of 6 conditions still are met
//White S's indicate that 5 of 6 conditions are met due to impending downtrend w/ missing condition in red above it
//Yellow S's indicate that 6 of 6 conditions still are met
//After a downtrend or uptrend is established, once it closes it can't repeat for 10 minutes
//Won't open any trades on last two minutes of any hours to avoid volatility
//Will close any open trades going into last minute of hour

// Initialize variables
var float long_entry_price = na
var float short_entry_price = na
var float stop_loss = na
var float take_profit = na
var float short_stop_loss = na
var float short_take_profit = na
var float option_SL = 0.3 //approx 15 cents on SPY 1 DTE
var float option_TP = 0.3 //approx 15 cents on SPY 1 DTE
var long_entry_time = 0
var short_entry_time = 0
var allow_long_entry = true
var allow_short_entry = true
var allow_trades = true
var hourlyclose = 0
var notify = 0
var shortnotify = 0

// Calculate the EMAs & SMAs
ema5 = ta.ema(close, 5)
ema13 = ta.ema(close, 13)
sma20 = ta.sma(close, 20)

// Input parameters
fastLength = input.int(12, minval=1, title="Fast Length")
slowLength = input.int(26, minval=1, title="Slow Length")
signalLength = input.int(9, minval=1, title="Signal Smoothing")

// Inputs
length = input.int(14, "Length")
smoothK = input.int(3, "SmoothK")
src = input(close, "Source")
overbought = input.float(80, "Overbought")
oversold = input.float(20, "Oversold")

//Stochastic Calculation
highestHigh = ta.highest(src, length)
lowestLow = ta.lowest(src, length)
k = 100 * ((src - lowestLow) / (highestHigh - lowestLow))
d = ta.sma(k, smoothK)

// Calculate MACD
[macdLines, signalLines, _] = ta.macd(close, fastLength, slowLength, signalLength)

// Calculate slope of MACD line
macdSlope = (macdLines - macdLines[1]) / (bar_index - bar_index[1])

// Calculate the RSI
rsiValue = ta.rsi(close, 5)

// Calculate the signal line as the SMA of the RSI for 5 minute over 9 periods
rsiSignal = ta.sma(rsiValue, 9)

// Calculate MACD
[macdLine, signalLine, _] = ta.macd(close, 12, 26, 9)

// Length of the ATR
atr_length = input.int(14, title="ATR Length", minval=1)

// Calculate the True Range
tr = ta.tr(true)

// Calculate the ATR
atr = ta.atr(atr_length)

// Length of the ADX
len = input.int(14, minval=1)

// Set minimum number of bars between trades
min_bars_between_trades = 10

// Calculate the Directional Movement
up = ta.change(high)
down = -ta.change(low)
plusDM = na(up) ? na : (up > down and up > 0 ? up : 0)
minusDM = na(down) ? na : (down > up and down > 0 ? down : 0)

// Calculate the Smoothed Directional Movement
plusDI = 100 * ta.ema(plusDM, len) / ta.ema(tr, len)
minusDI = 100 * ta.ema(minusDM, len) / ta.ema(tr, len)

// Calculate the Directional Index (DX)
DX = 100 * math.abs(plusDI - minusDI) / (plusDI + minusDI)

// Calculate the ADX
adx = ta.ema(DX, len)

// Get high, low, and close prices
highPrice = high
lowPrice = low
closePrice = close

// Determine buy and sell signals - Tried to optimize as much as possible - changing these do impact results
buy_signal = ema5 > ema13 and macdLine < .5 and adx > 20 and macdSlope > 0 and signalLine > -.1 and rsiSignal > 40
short_buy_signal = ema5 < ema13 and macdLine > -.5 and adx > 20 and signalLine < 0 and macdSlope < 0 and rsiSignal < 60

// Define long entry conditions
C1 = ema5 > ema13 ? 1 : 0 //E below bar when only one missing
C2 = d < 70 ? 1 : 0 //no longer part of signal - but was Smoothed Stoicastic
C3 = macdLine < .5 ? 1 : 0 //M below bar when only one missing
C4 = adx > 20 ? 1 : 0 //A below bar when only one missing
C5 = macdSlope > 0 ? 1 : 0 //% below bar when only one missing
C6 = signalLine > -.01 ? 1 : 0 //S (MACD Signal) below bar when only one missing
C7 = rsiSignal > 50 ? 1 : 0 //R below bar when only one missing

// Define short entry conditions
C8 = ema5 < ema13 ? 1 : 0 //E above bar when only one missing
C9 = d > 40 ? 1 : 0 //no longer part of signal - but was Smoothed Stoicastic
C10 = macdLine > -0.5 ? 1 : 0 //M above bar when only one missing
C11 = adx > 20 ? 1 : 0 //A above bar when only one missing
C12 = macdSlope < 0 ? 1 : 0 //% above bar when only one missing
C13 = signalLine < 0 ? 1 : 0 //S (MACD Signal) above bar when only one missing
C14 = rsiSignal < 50 ? 1 : 0 //R above bar when only one missing

// Long or Short Incoming denoted by white color and gold means all conditions met
plotchar((C1 + C3 + C4 + C5 + C6 + C7) == 5 ? 1 : na, title="Pivot Up White", char="L", location=location.belowbar, color=color.white, size = size.tiny)
plotchar((C8 + C10 + C11 + C12 + C13 + C14) == 5 ? 1 : na, title="Pivot Down White", char="S", location=location.abovebar, color=color.white, size = size.tiny)
plotchar((C1 + C3 + C4 + C5 + C6 + C7) > 5 ? 1 : na, title="Pivot Up Gold", char="L", location=location.belowbar, color=color.yellow, size = size.tiny)
plotchar((C8 + C10 + C11 + C12 + C13 + C14) > 5 ? 1 : na, title="Pivot Down Gold", char="S", location=location.abovebar, color=color.yellow, size = size.tiny)
plotchar((C1 + C3 + C4 + C5 + C6 + C7) >= 5 and (C1) != 1 ? 1 : na, title="Missing", char = "", text="E", location=location.belowbar, color=color.green, size = size.small)
plotchar((C1 + C3 + C4 + C5 + C6 + C7) >= 5 and (C3) != 1 ? 1 : na, title="Missing", char = "", text="M", location=location.belowbar, color=color.green, size = size.small)
plotchar((C1 + C3 + C4 + C5 + C6 + C7) >= 5 and (C4) != 1 ? 1 : na, title="Missing", char = "", text="A", location=location.belowbar, color=color.green, size = size.small)
plotchar((C1 + C3 + C4 + C5 + C6 + C7) >= 5 and (C5) != 1 ? 1 : na, title="Missing", char = "", text="%", location=location.belowbar, color=color.green, size = size.small)
plotchar((C1 + C3 + C4 + C5 + C6 + C7) >= 5 and (C6) != 1 ? 1 : na, title="Missing", char = "", text="S", location=location.belowbar, color=color.green, size = size.small)
plotchar((C1 + C3 + C4 + C5 + C6 + C7) >= 5 and (C7) != 1 ? 1 : na, title="Missing", char = "", text="R", location=location.belowbar, color=color.green, size = size.small)
plotchar((C8 + C10 + C11 + C12 + C13 + C14) >= 5 and (C8) != 1 ? 1 : na, title="Missing", char = "", text="E", location=location.abovebar, color=color.red, size = size.small)
plotchar((C8 + C10 + C11 + C12 + C13 + C14) >= 5 and (C10) != 1 ? 1 : na, title="Missing", char = "", text="M", location=location.abovebar, color=color.red, size = size.small)
plotchar((C8 + C10 + C11 + C12 + C13 + C14) >= 5 and (C11) != 1 ? 1 : na, title="Missing", char = "", text="A", location=location.abovebar, color=color.red, size = size.small)
plotchar((C8 + C10 + C11 + C12 + C13 + C14) >= 5 and (C12) != 1 ? 1 : na, title="Missing", char = "", text="%", location=location.abovebar, color=color.red, size = size.small)
plotchar((C8 + C10 + C11 + C12 + C13 + C14) >= 5 and (C13) != 1 ? 1 : na, title="Missing", char = "", text="S", location=location.abovebar, color=color.red, size = size.small)
plotchar((C8 + C10 + C11 + C12 + C13 + C14) >= 5 and (C14) != 1 ? 1 : na, title="Missing", char = "", text="R", location=location.abovebar, color=color.red, size = size.small)

// Execute buy and sell orders
if buy_signal and allow_trades and allow_long_entry  //Don't buy on last 2 minutes of hour
    long_entry_price := open
    strategy.entry("Pivot Up", strategy.long)
    stop_loss := long_entry_price - option_SL
    take_profit := long_entry_price + option_TP
    long_entry_time := time
    allow_long_entry := false
    allow_trades := false
    notify := 1
plotshape(notify == 1 ? 1 : na, "Pivot Up", style=shape.triangleup, offset = 1, location=location.belowbar, size=size.normal, textcolor = color.orange, color=color.orange)
if notify == 1
    notify := notify - 1

if short_buy_signal and allow_trades and allow_short_entry  //Don't buy on last 2 minutes of hour
    short_entry_price := open
    strategy.entry("Pivot Down", strategy.short)
    short_stop_loss := short_entry_price + option_SL
    short_take_profit := short_entry_price - option_TP
    short_entry_time := time
    allow_short_entry := false
    allow_trades := false
    shortnotify := 1
plotshape(shortnotify == 1 ? 1 : na, "Pivot Down", style=shape.triangledown, offset = 1, location=location.abovebar, size=size.normal, textcolor = color.orange, color=color.orange)
if shortnotify == 1
    shortnotify := shortnotify - 1

// Take scalp when in a position and 5 or more parameters are met!
if strategy.position_size != 0 and (C1 + C3 + C4 + C5 + C6 + C7) >5
    strategy.exit("Exit Longs", "Pivot Up", stop=stop_loss, limit = take_profit)
else if strategy.position_size != 0 and (C8 + C10 + C11 + C12 + C13 + C14) >5
    strategy.exit("Exit Shorts", "Pivot Down", stop=short_stop_loss, limit = short_take_profit)

// Reset allow_trades after cool-down period of min_bars_between_trades bars set above
if time > long_entry_time + (time - time[1]) * min_bars_between_trades
    allow_long_entry := true
    allow_trades := true

if time > short_entry_time + (time - time[1]) * min_bars_between_trades
    allow_short_entry := true
    allow_trades := true

// Close all positions at the end of the trading day and when volatile hours approach!
if  strategy.position_size != 0
    strategy.close("Pivot Up")
    strategy.close("Pivot Down")
    hourlyclose := 1
plotshape(hourlyclose == 1 ? 1 : na, "Suggested Volatile Hour Close", text="Suggested Volatile Hour Close", offset = 1, style=shape.triangledown, location=location.abovebar, size=size.tiny, textcolor = color.orange, color=color.orange)
if hourlyclose == 1
    hourlyclose := hourlyclose - 1