तीन के-लाइन प्रवृत्ति उत्क्रमण रणनीति
अवलोकन
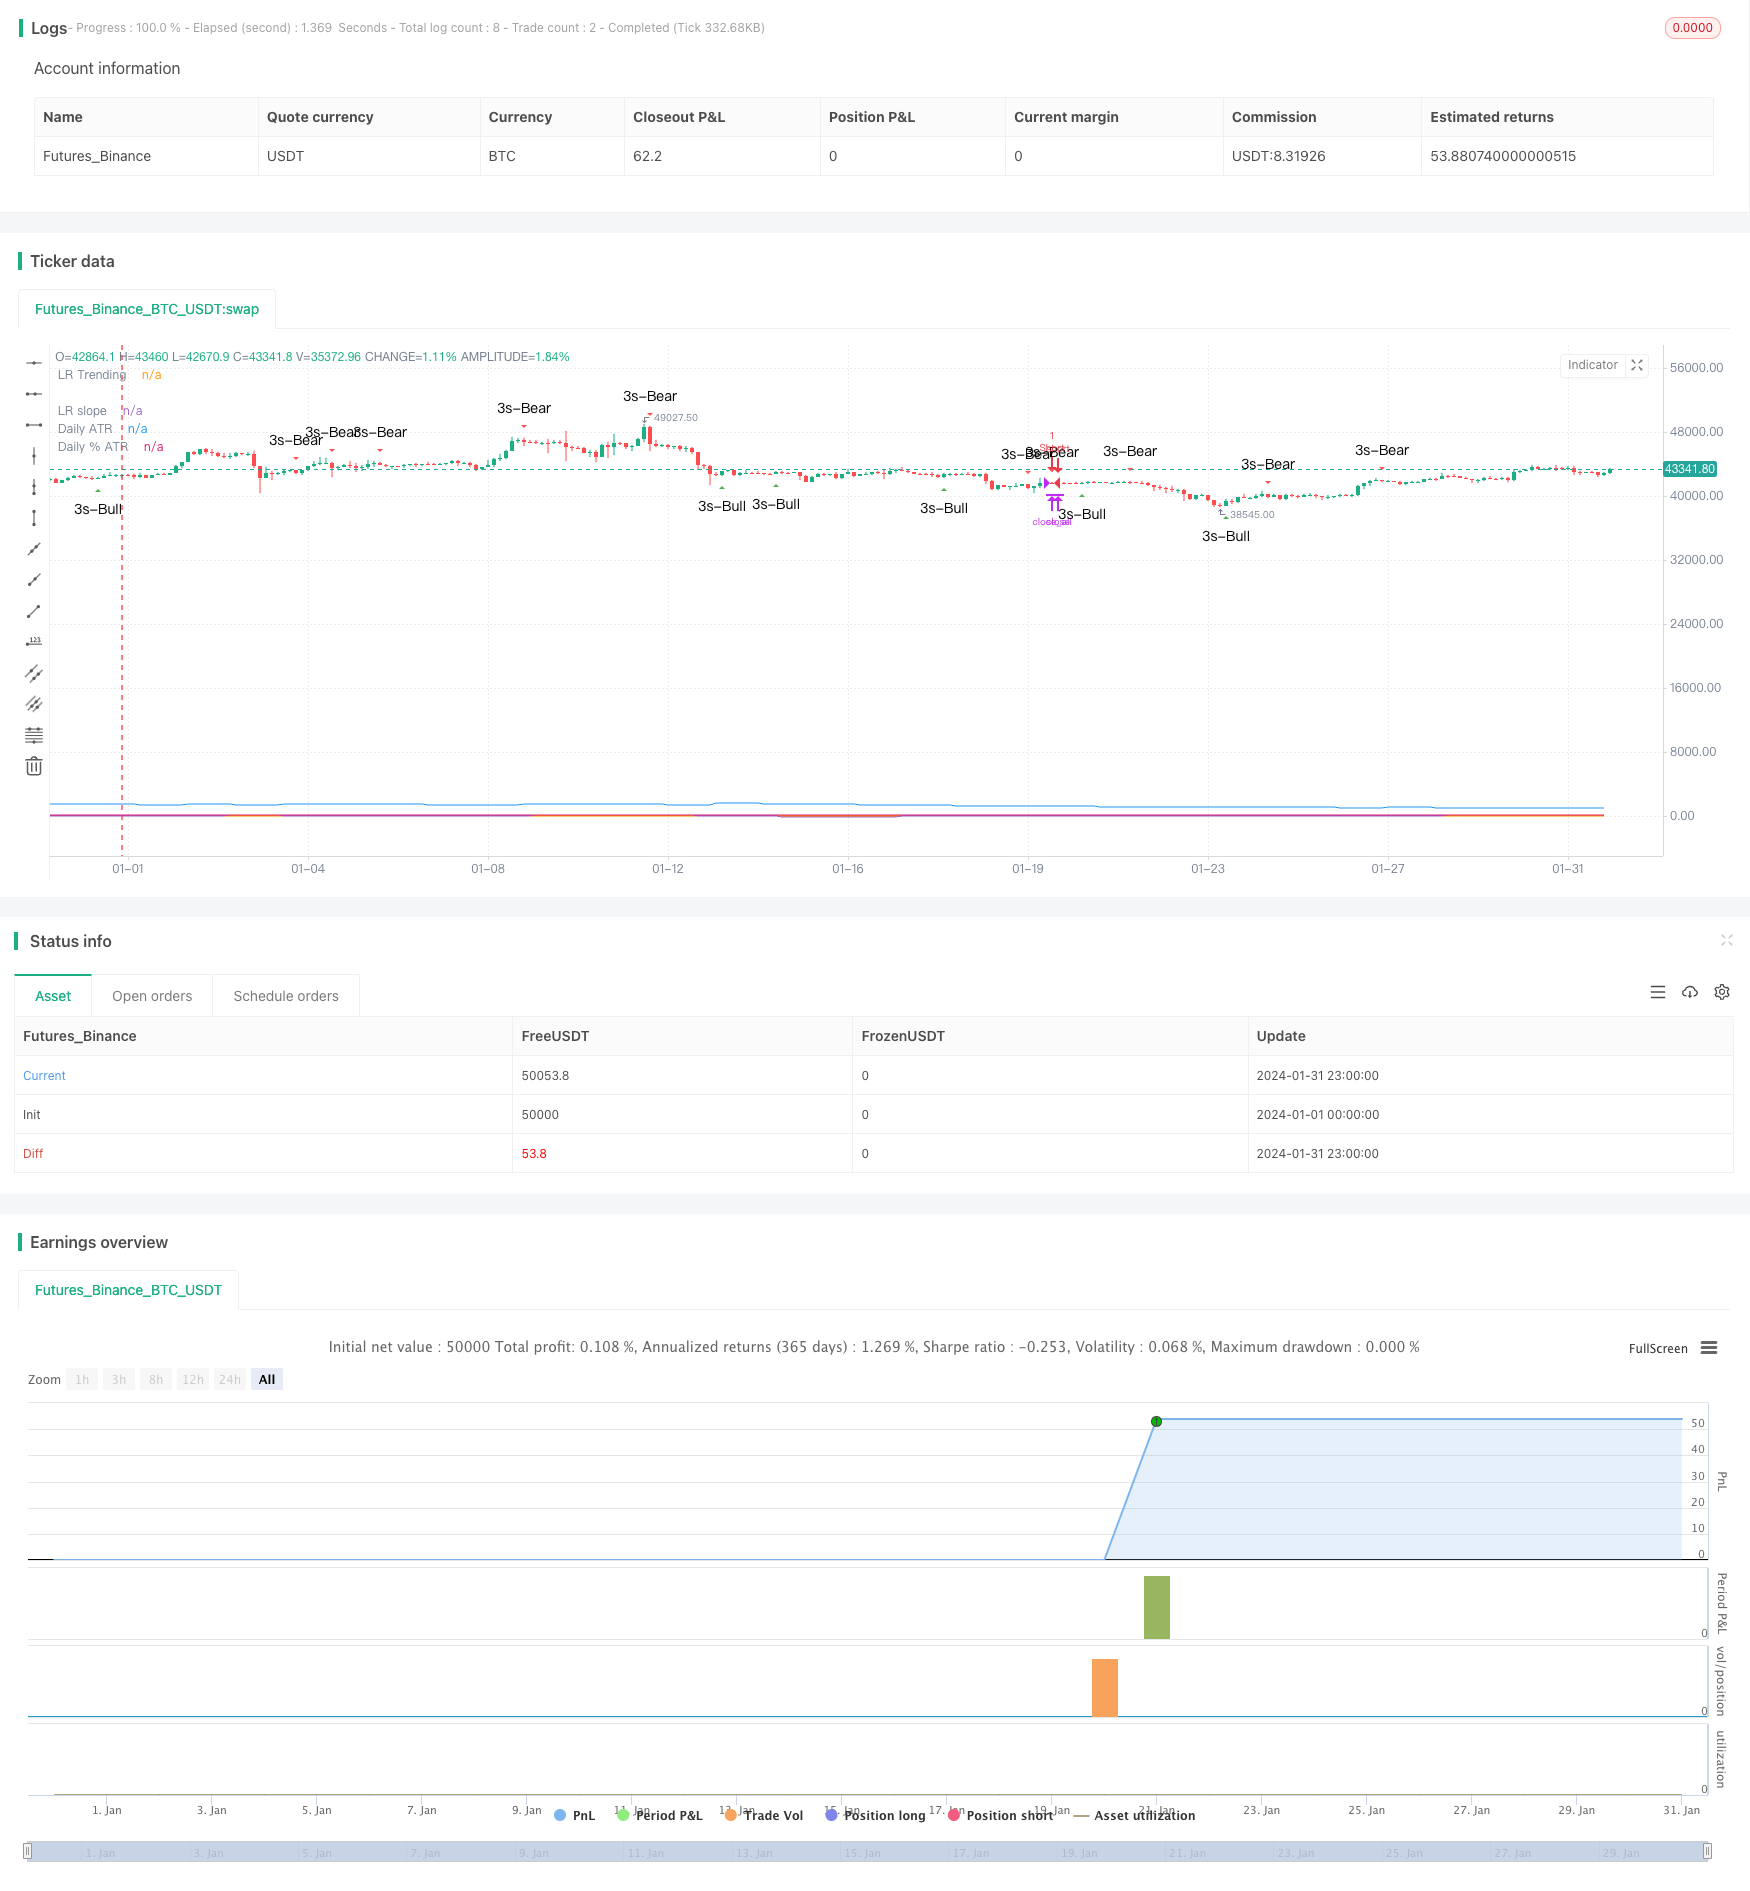
थ्री कैंडल रिवर्सल ट्रेंड स्ट्रैटेजी एक शॉर्ट-लाइन ट्रेडिंग रणनीति है, जो तीन लगातार तारों की पहचान करके शॉर्ट-लाइन ट्रेंड के रिवर्सल का आकलन करती है, जिसके बाद एक चखने वाली के-लाइन होती है, जो कई तकनीकी संकेतकों के संयोजन के साथ प्रवेश करने का समय निर्धारित करती है। यह रणनीति 1: 3 स्टॉप-लॉस-स्टॉप अनुपात के साथ व्यापार करती है, जो अतिरिक्त लाभ प्राप्त करने के लिए अनुकूल है।
रणनीति सिद्धांत
इस रणनीति का मूल तर्क यह है कि तीन लगातार सकारात्मक या नकारात्मक रेखाओं के K-लाइन पैटर्न की पहचान करना, जो आमतौर पर अल्पकालिक प्रवृत्ति के उलट होने का संकेत देता है। जब तीन नकारात्मक रेखाओं का पता लगाया जाता है, तो अगले अवशोषित सकारात्मक रेखा के आने तक प्रतीक्षा करें, अधिक करें; इसके विपरीत, जब तीन सकारात्मक रेखाओं का पता लगाया जाता है, तो अगले अवशोषित नकारात्मक रेखा के आने तक प्रतीक्षा करें, खाली करें।
इसके अलावा, रणनीति में प्रवेश के समय को फ़िल्टर करने के लिए कई तकनीकी संकेतक भी शामिल हैं। दो अलग-अलग पैरामीटर सेटिंग्स के साथ SMA औसत, केवल धीमी रेखा को पार करने पर प्रवेश पर विचार करना शुरू कर दिया गया है। इसके अलावा, बाजार के उतार-चढ़ाव और प्रवृत्ति की स्थिति को निर्धारित करने के लिए रैखिक रिवर्सन संकेतक के माध्यम से, केवल प्रवृत्ति की स्थिति में व्यापार किया जाता है। रणनीति एक स्विच भी प्रदान करती है, जिसमें यह चुनने का विकल्प दिया जाता है कि क्या गोल्डन क्रॉसिंग होने पर K लाइन आकृति के साथ प्रवेश करना है। इन संकेतकों के समग्र निर्णय के माध्यम से, अधिकांश शोर को फ़िल्टर किया जा सकता है और प्रवेश की सटीकता में सुधार किया जा सकता है।
स्टॉप लॉस स्टॉप सेट पर, रणनीति को कम से कम 1: 3 का रिस्क-रिटर्न अनुपात की आवश्यकता होती है। हाल ही में एन रूट के लाइन में उतार-चढ़ाव की मात्रा की गणना करके एटीआर संकेतक, उतार-चढ़ाव की मात्रा के प्रतिशत के साथ मिलकर स्टॉप लॉस सेट करें, और फिर स्टॉप लॉस स्तर की गणना करें। इस प्रकार, एक निश्चित जोखिम की शर्त पर उचित अतिरिक्त रिटर्न प्राप्त किया जा सकता है।
रणनीतिक लाभ
तीन के-लाइन रिवर्स ट्रेंड रणनीतियों के निम्नलिखित फायदे हैंः
- अल्पकालिक रुझानों को पहचानें और समय पर अवसरों का लाभ उठाएं
- प्रवेश की सटीकता में सुधार के लिए कई सूचकांकों को फ़िल्टर करना
- स्टॉप-डैमेज-स्टॉप-फ्रीज व्यवस्था उचित है, रिस्क-रिटर्न अनुपात मध्यम है
- सरल पैरामीटर सेटिंग, आसान समझ ऑपरेशन
रणनीतिक जोखिम
इस रणनीति के कुछ जोखिम भी हैं, जिनके बारे में ध्यान देने की आवश्यकता हैः
- एक छोटी अवधि में पलटाव जरूरी नहीं कि एक लंबी अवधि के रुझान के पलटाव का प्रतिनिधित्व करता है, और अधिक समय अवधि के रुझान पर ध्यान देने की आवश्यकता होती है। एक लंबी अवधि की औसत रेखा को फ़िल्टर शर्त के रूप में सेट किया जा सकता है।
- एक एकल K-लाइन आकृति सिग्नल में गलतफहमी हो सकती है, अन्य सहायक निर्णय संकेतों को जोड़ने पर विचार किया जा सकता है।
- स्टॉप लॉस पॉइंट सेटिंग्स शायद बहुत आशावादी हैं, स्टॉप लॉस रेंज को उचित रूप से संकीर्ण किया जा सकता है।
- यह भी कहा गया है कि इस तरह की घटनाओं के बाद से, “हमारे पास कोई वास्तविक डेटा नहीं है, और हम अनिश्चित हैं कि यह कैसे होगा।
रणनीति अनुकूलन दिशा
इस रणनीति को निम्नलिखित दिशाओं में अनुकूलित किया जा सकता हैः
- औसत रेखा और रैखिक प्रतिगमन मापदंडों को समायोजित करें और रुझान की स्थिति का आकलन करने के लिए अनुकूलित करें
- सिग्नल की सटीकता को अनुकूलित करने के लिए स्टोच सूचक जैसे अन्य सहायक निर्णय सूचकांकों को जोड़ना
- एटीआर पैरामीटर और स्टॉप लॉस पैमाना पैरामीटर की सेटिंग को अनुकूलित करें, जोखिम और लाभ को संतुलित करें
- ट्रेंड ब्रेकिंग प्वाइंट ट्रैकिंग और लाभप्रदता में वृद्धि
- ट्रेडिंग जोखिमों को नियंत्रित करने के लिए अधिक सख्त धन प्रबंधन रणनीतियों का निर्माण
संक्षेप
कुल मिलाकर, तीन के-लाइन रिवर्स ट्रेंड रणनीति सरल मूल्य पैटर्न के साथ-साथ कई सहायक सूचकांक निर्णयों का उपयोग करती है, जो उचित जोखिम-लाभ संतुलन के आधार पर एक छोटी लाइन ट्रेडिंग रणनीति है। यह कम जटिलता के साथ अच्छा प्रदर्शन कर रहा है, निवेशकों के लिए ध्यान देने योग्य और परीक्षण योग्य है, और सुधार के लिए बहुत सारे स्थान हैं। पैरामीटर अनुकूलन और नियम के पूरक के साथ, यह एक स्थिर और उच्च-कुशल मात्रात्मक ट्रेडिंग रणनीति के रूप में विकसित होने की उम्मीद है।
/*backtest
start: 2024-01-01 00:00:00
end: 2024-01-31 23:59:59
period: 3h
basePeriod: 15m
exchanges: [{"eid":"Futures_Binance","currency":"BTC_USDT"}]
*/

// This source code is subject to the terms of the Mozilla Public License 2.0 at https://mozilla.org/MPL/2.0/
// © platsn
//
// Mainly developed for SPY trading on 1 min chart. But feel free to try on other tickers.

// Basic idea of this strategy is to look for 3 candle reversal pattern within trending market structure. The 3 candle reversal pattern consist of 3 consecutive bullish or bearish candles,
// followed by an engulfing candle in the opposite direction. This pattern usually signals a reversal of short term trend. This strategy also uses multiple moving averages to filter long or short
// entries. ie. if the 21 smoothed moving average is above the 50, only look for long (bullish) entries, and vise versa. There is option change these moving average periods to suit your needs.
// I also choose to use Linear Regression to determine whether the market is ranging or trending. It seems the 3 candle pattern is more successful under trending market. Hence I use it as a filter.

// There is also an option to combine this strategy with moving average crossovers. The idea is to look for 3 canddle pattern right after a fast moving average crosses over a slow moving average.
// By default , 21 and 50 smoothed moving averages are used. This gives additional entry opportunites and also provides better results.

// This strategy aims for 1:3 risk to reward ratio. Stop losses are calculated using the closest low or high values for long or short entries, respectively, with an offset using a percentage of
// the daily ATR value. This allows some price flucuation without being stopped out prematurely. Price target is calculated by multiplying the difference between the entry price and the stop loss
// by a factor of 3. When price target is reach, this strategy will set stop loss at the price target and wait for exit considion to maximize potential profit.

// This strategy will exit an order if an opposing 3 candle pattern is detected, this could happend before stop loss or price target is reached, and may also happen after price target is reached.

// *Note that this strategy is designed for same day SPY option scalping. I haven't determined an easy way to calculate the # of contracts to represent the equivalent option values. Plus the option
// prices varies greatly depending on which strike and expiry that may suits your trading style. Therefore, please be mindful of the net profit shown. By default, each entry is approxiately equal
// to buying 10 of same day or 1 day expiry call or puts at strike $1 - $2 OTM. This strategy will close all open trades at 3:45pm EST on Mon, Wed, and Fri.

// **Note that this strategy also takes into account of extended market data.

// ***Note pyramiding is set to 2 by default, so it allows for multiple entries on the way towards price target.

// Remember that market conditions are always changing. This strategy was only able to be backtested using 1 month of data. This strategy may not work the next month. Please keep that in mind.

// *****************************************************************************************************************************************************************************************************

//@version=5
strategy("3 Candle Strike Stretegy", overlay=true, pyramiding=2, initial_capital=5000, commission_type=strategy.commission.cash_per_contract, commission_value = 0.01)

// ******************** Period **************************************
startY = input(title='Start Year', defval=2011, group = "Trading window")
startM = input.int(title='Start Month', defval=1, minval=1, maxval=12, group = "Trading window")
startD = input.int(title='Start Day', defval=1, minval=1, maxval=31, group = "Trading window")
finishY = input(title='Finish Year', defval=2050, group = "Trading window")
finishM = input.int(title='Finish Month', defval=12, minval=1, maxval=12, group = "Trading window")
finishD = input.int(title='Finish Day', defval=31, minval=1, maxval=31, group = "Trading window")
timestart = timestamp(startY, startM, startD, 00, 00)
timefinish = timestamp(finishY, finishM, finishD, 23, 59)
t1 = time(timeframe.period, "0930-1545:23456")
window = true

// *****************************************************

isSPY = input.bool(defval=true,title="SPY trading only", group = "Trading Options")
SPY_option = input.int(defval=10,title="# of SPY options per trade", group = "Trading Options")
reinvest = input.bool(defval=false,title="reinvest profit?", group = "Trading Options")
src = close

// ***************************************************************************************************** Daily ATR *****************************************************
// Inputs
atrlen = input.int(14, minval=1, title="ATR period", group = "Daily ATR")
iPercent = input.float(5, minval=1, maxval=100, step=0.1, title="% ATR to use for SL / PT", group = "Daily ATR")
// PTPercent = input.int(100, minval=1, title="% ATR for PT")

// Logic
percentage = iPercent * 0.01
datr = request.security(syminfo.tickerid, "1D", ta.rma(ta.tr, atrlen))
datrp = datr * percentage
// datrPT = datr * PTPercent * 0.01

plot(datr,"Daily ATR")
plot(datrp, "Daily % ATR")

// ***************************************************************************************************************** Moving Averages ************************

len0 = input.int(8, minval=1, title='Fast EMA', group= "Moving Averages")
ema1 = ta.ema(src, len0)

len1 = input.int(21, minval=1, title='Fast SMMA', group= "Moving Averages")
smma1 = 0.0
sma_1 = ta.sma(src, len1)
smma1 := na(smma1[1]) ? sma_1 : (smma1[1] * (len1 - 1) + src) / len1

len2 = input.int(50, minval=1, title='Slow SMMA', group= "Moving Averages")
smma2 = 0.0
sma_2 = ta.sma(src, len2)
smma2 := na(smma2[1]) ? sma_2 : (smma2[1] * (len2 - 1) + src) / len2

len3 = input.int(200, minval=1, title='Slow SMMA', group= "Moving Averages")
smma3 = 0.0
sma_3 = ta.sma(src, len3)
smma3 := na(smma3[1]) ? sma_3 : (smma3[1] * (len3 - 1) + src) / len3

ma_bull = smma1 > smma2 and smma1 > smma1[1]
ma_bear = smma1 < smma2 and smma1 < smma1[1]

ma_bull_macro = smma1 > smma3 and smma2 > smma3
ma_bear_macro = smma1 < smma3 and smma2 < smma3

// plot(ma_bull? 1 : 0, "MA bull")
// plot(ma_bear? 1 : 0 , "MA bear")

// **************************************************************************************************************** Linear Regression *************************

//Input
clen = input.int(defval = 50, minval = 1, title = "Linear Regression Period", group = "Linear Regression")
slen = input.int(defval=50, minval=1, title="LR Slope Period" , group = "Linear Regression")
glen = input.int(defval=14, minval=1, title="LR Signal Period", group = "Linear Regression")
LR_thres = input.float(0.03, minval=0, step=0.001, title="LR Threshold for Ranging vs Trending" , group = "Linear Regression")

//Linear Regression Curve
lrc = ta.linreg(src, clen, 0)
//Linear Regression Slope
lrs = (lrc-lrc[1])/1
//Smooth Linear Regression Slope
slrs = ta.ema(lrs, slen)
//Signal Linear Regression Slope
alrs = ta.sma(slrs, glen)

up_accel = lrs > alrs and lrs > 0
down_accel = lrs < alrs and lrs < 0

LR_ranging  = math.abs(slrs) <= LR_thres
LR_trending = math.abs(slrs) > LR_thres

plot(slrs, "LR slope")
plot(LR_trending?1:0, "LR Trending")

// *********************************************************************************************************************************** Candle conditions **************************

bull_3s = close[3] <= open[3] and close[2] <= open[2] and close[1] <= open[1] and close > open[1]
bear_3s = close[3] >= open[3] and close[2] >= open[2] and close[1] >= open[1] and close < open[1]

plotshape(bull_3s, style=shape.triangleup, color=color.new(color.green, 0), location=location.belowbar, size=size.small, text='3s-Bull', title='3 Line Strike Up')
plotshape(bear_3s, style=shape.triangledown, color=color.new(color.red, 0), location=location.abovebar, size=size.small, text='3s-Bear', title='3 Line Strike Down')

// ***************************************************************************************************************************************** SL & PT ***********************************
RR = input.float(3.0, minval = 1, step = 0.1, title="Reward to Risk Ratio", group = "Trading Options")

barsSinceLastEntry()=>
    strategy.opentrades > 0 ? (bar_index - strategy.opentrades.entry_bar_index(strategy.opentrades-1)) : na

last_high = math.max(high, high[1], high[2], high[3])
last_low = math.min(low, low[1], low[2], low[3])

long_SL = last_low - datrp
short_SL = last_high + datrp

long_PT = last_high
short_PT = last_low

last_entry = strategy.opentrades.entry_price(strategy.opentrades-1)
risk = last_entry - long_SL

if strategy.opentrades > 0
    long_SL := math.min(long_SL[barsSinceLastEntry()], last_low)
    short_SL := math.max(short_SL[barsSinceLastEntry()], last_high)
    risk := last_entry - long_SL
    long_PT := last_entry + (last_entry - long_SL) * RR
    short_PT := last_entry - (short_SL - last_entry) * RR
else
    long_PT := open + (open - long_SL) * RR
    short_PT := open - (short_SL - open) * RR

// plot(short_SL,title = "Short SL", color=color.new(color.purple,30))
// plot(long_SL,title = "Long SL", color=color.new(color.purple,30))
// plot(long_PT,title = "Long PT", color=color.new(color.white,50))
// plot(short_PT,title = "Short PT", color=color.new(color.white,50))
// plot(last_entry, title = "Last entry")
// plot(risk, title = "Risk")

// **************************************************************************************************************************************** Trade Pauses ****************************************
bool trade_pause = false
bool trade_pause2 = false

if high - low > datr*0.3
    trade_pause := true
else
    trade_pause := false

no_longat10 = input.bool(true, title="No long entry between 10 - 10:30 (Avoid 10 am dump)", group = "Trading Options")

// ************************************************************************************************************************************ Entry conditions **************************

trade_3s = input.bool(title='Trade 3s candle pattern', defval=true, group = "Trading Options")
L_entry1 = bull_3s and ma_bull and LR_trending
S_entry1 = bear_3s and ma_bear and LR_trending

trade_ma_reversal = input.bool(title='Trade MA Cross Reversal Signal', defval=true, group = "Trading Options")
L_entry2 = ma_bear_macro and ema1 > smma1 and bull_3s and ta.barssince(ta.cross(ema1,smma1)) < 10
S_entry2 = ma_bull_macro and ema1 < smma1 and bear_3s and ta.barssince(ta.cross(ema1,smma1)) < 10

// ************************************************************************************************************************************** Exit Conditions ********************************

// bsle_thres = input.int(0, "Bar since entry threshold")

// exit0 = barsSinceLastEntry() >= bsle_thres
exit0 = true

L_exit1 = bear_3s
S_exit1 = bull_3s

// ************************************************************************************************************************************ Entry and Exit orders *****************************
strategy.initial_capital = 50000
trade_amount = math.floor(strategy.initial_capital / close)

if isSPY
    if strategy.netprofit > 0 and reinvest
        trade_amount := math.floor((strategy.initial_capital + strategy.netprofit) * 0.2 / 600) * 10 * SPY_option
    else
        trade_amount := math.floor(strategy.initial_capital * 0.2 / 600) * 10 * SPY_option


if not(trade_pause) and not(trade_pause2) and time(timeframe.period, "0930-1540:23456")
    if trade_3s
        if not(time(timeframe.period, "1000-1030:23456")) and no_longat10
            strategy.entry("Long", strategy.long, 1, when = L_entry1 and window, comment="Long 3s" + " SL=" + str.tostring(math.round(long_SL,2)) + " PT=" + str.tostring(math.round(long_PT,2)))
        strategy.entry("Short", strategy.short, 1, when = S_entry1 and window, comment = "Short 3s" + " SL=" + str.tostring(math.round(short_SL,2)) + " PT=" + str.tostring(math.round(short_PT,2)))
    if trade_ma_reversal
        strategy.entry("Long", strategy.long, 1, when = L_entry2 and window, comment="Long MA cross" + " SL=" + str.tostring(math.round(long_SL,2)) + " PT=" + str.tostring(math.round(long_PT,2)))
        strategy.entry("Short", strategy.short, 1, when = S_entry2 and window, comment = "Short MA corss" + " SL=" + str.tostring(math.round(short_SL,2)) + " PT=" + str.tostring(math.round(short_PT,2)))

if high > long_PT
    long_SL := low[1]
    strategy.exit("Exit", "Long", when = exit0 and low < long_PT, stop= long_SL, comment = "Exit Long SL/PT hit")
strategy.close("Long", when = L_exit1, comment = "Exit on Bear Signal")

if low < short_PT
    short_SL := high[1]
    strategy.exit("Exit", "Short", when= exit0 and high > short_PT, stop= short_SL, comment = "Exit Short SL/PT hit")
strategy.close("Short", when = S_exit1, comment = "Exit on Bull Signal")

if time(timeframe.period, "1545-1600:246")
    strategy.close_all()