Strategi Pantulan dari Titik Rendah Pembalikan

[trans]
Ikhtisar
Strategi Rebound Titik Terendah adalah strategi perdagangan saham yang sederhana dan efektif. Strategi ini menangkap peluang rebound dari titik terendah, masuk ke pasar saat harga saham berbalik naik, menggunakan operasi jangka pendek, dan keluar dengan cepat setelah mengambil untung atau berhenti rugi.
Logika Strategi
Strategi ini terutama didasarkan pada dua indikator: harga terendah 5 hari untuk menentukan waktu masuk, dan RSI 2 hari untuk menentukan waktu keluar.
Prosedur operasi spesifik adalah sebagai berikut:
-
Jika harga penutupan hari ini lebih rendah dari harga terendah 5 hari kemarin, maka lakukan posisi beli (long) saat penutupan.
-
Jika RSI 2 hari menutup di atas zona overbought (standar 50), maka tutup posisi pada penutupan hari itu untuk mengambil untung.
-
Jika setelah masuk posisi selama 5 hari tidak memicu kondisi ambil untung, maka lakukan keluar paksa dengan stop loss.
Dengan demikian, kita masuk posisi beli di dekat titik kritis ketika harga saham sedang berbalik naik, menggunakan sinyal overbought dari RSI untuk mengunci keuntungan, sekaligus menetapkan batas waktu stop loss untuk mengendalikan risiko.
Analisis Keunggulan
Strategi ini memiliki keunggulan sebagai berikut:
-
Operasi sederhana, mudah diterapkan. Hanya perlu mengamati dua indikator, aturan jelas, dapat membuat keputusan perdagangan dengan cepat.
-
Menggunakan ide pembalikan tren, masuk sebelum harga saham berbalik naik, menangkap pergerakan besar.
-
Menetapkan titik ambil untung dan stop loss, dapat mengendalikan kerugian tunggal, mencapai profit yang stabil.
-
Perputaran modal cepat, tidak perlu menunggu lama, dapat melakukan banyak transaksi berulang.
-
Dapat diterapkan secara luas pada sebagian besar saham, terutama saham yang memiliki karakteristik pembalikan harga rendah jangka pendek yang jelas.
Analisis Risiko
Strategi ini juga memiliki beberapa risiko:
-
Salah memilih waktu pembalikan, dapat menyebabkan kerugian. Menentukan waktu pembalikan membutuhkan pengalaman praktis.
-
Penempatan stop loss yang tidak tepat, dapat memperbesar kerugian. Perlu mempertimbangkan besaran stop loss yang wajar.
-
Harga bergerak fluktuatif, titik ambil untung sulit terpicu. Parameter RSI dapat disesuaikan dengan tepat.
-
Hanya cocok untuk operasi jangka pendek, tidak cocok untuk ditahan lama.
-
Frekuensi perputaran yang tinggi meningkatkan biaya transaksi dan biaya slippage.
Arah Optimalisasi
Strategi ini dapat lebih dioptimalkan dari beberapa aspek berikut:
-
Menggabungkan indikator tren, untuk menghindari operasi melawan tren. Misalnya MACD, KDJ, dll.
-
Menguji parameter jumlah hari yang berbeda untuk harga terendah, menemukan indikator konfirmasi pembalikan yang lebih tepat.
-
Menguji ukuran parameter RSI, mengoptimalkan kondisi ambil untung.
-
Mempertimbangkan penambahan modul optimalisasi stop loss, menggunakan ATR untuk menetapkan stop loss secara dinamis.
-
Mengoptimalkan waktu masuk, dapat menunggu setelah konfirmasi pembalikan, menyaring false breakout.
-
Setelah mempertimbangkan biaya transaksi, menetapkan target ambil untung yang wajar. Mengontrol frekuensi perdagangan.
Kesimpulan
Strategi Rebound Titik Terendah adalah strategi perdagangan jangka pendek yang khas. Strategi ini memanfaatkan peluang rebound dari titik terendah, menggunakan kombinasi indikator sederhana untuk menentukan waktu masuk dan keluar, mencapai ambil untung dan stop loss dengan cepat. Dibandingkan dengan buy and hold, strategi ini memiliki keunggulan rasio risiko-pengembalian yang lebih tinggi. Dengan terus mengoptimalkan parameter dan aturan, strategi ini dapat disesuaikan dengan karakteristik sebagian besar saham, menghasilkan keuntungan yang stabil. Namun, juga perlu waspada terhadap masalah biaya transaksi akibat perdagangan yang terlalu sering. Secara keseluruhan, Strategi Rebound Titik Terendah adalah strategi perdagangan saham yang sederhana, praktis, dan efektif untuk menghasilkan keuntungan.
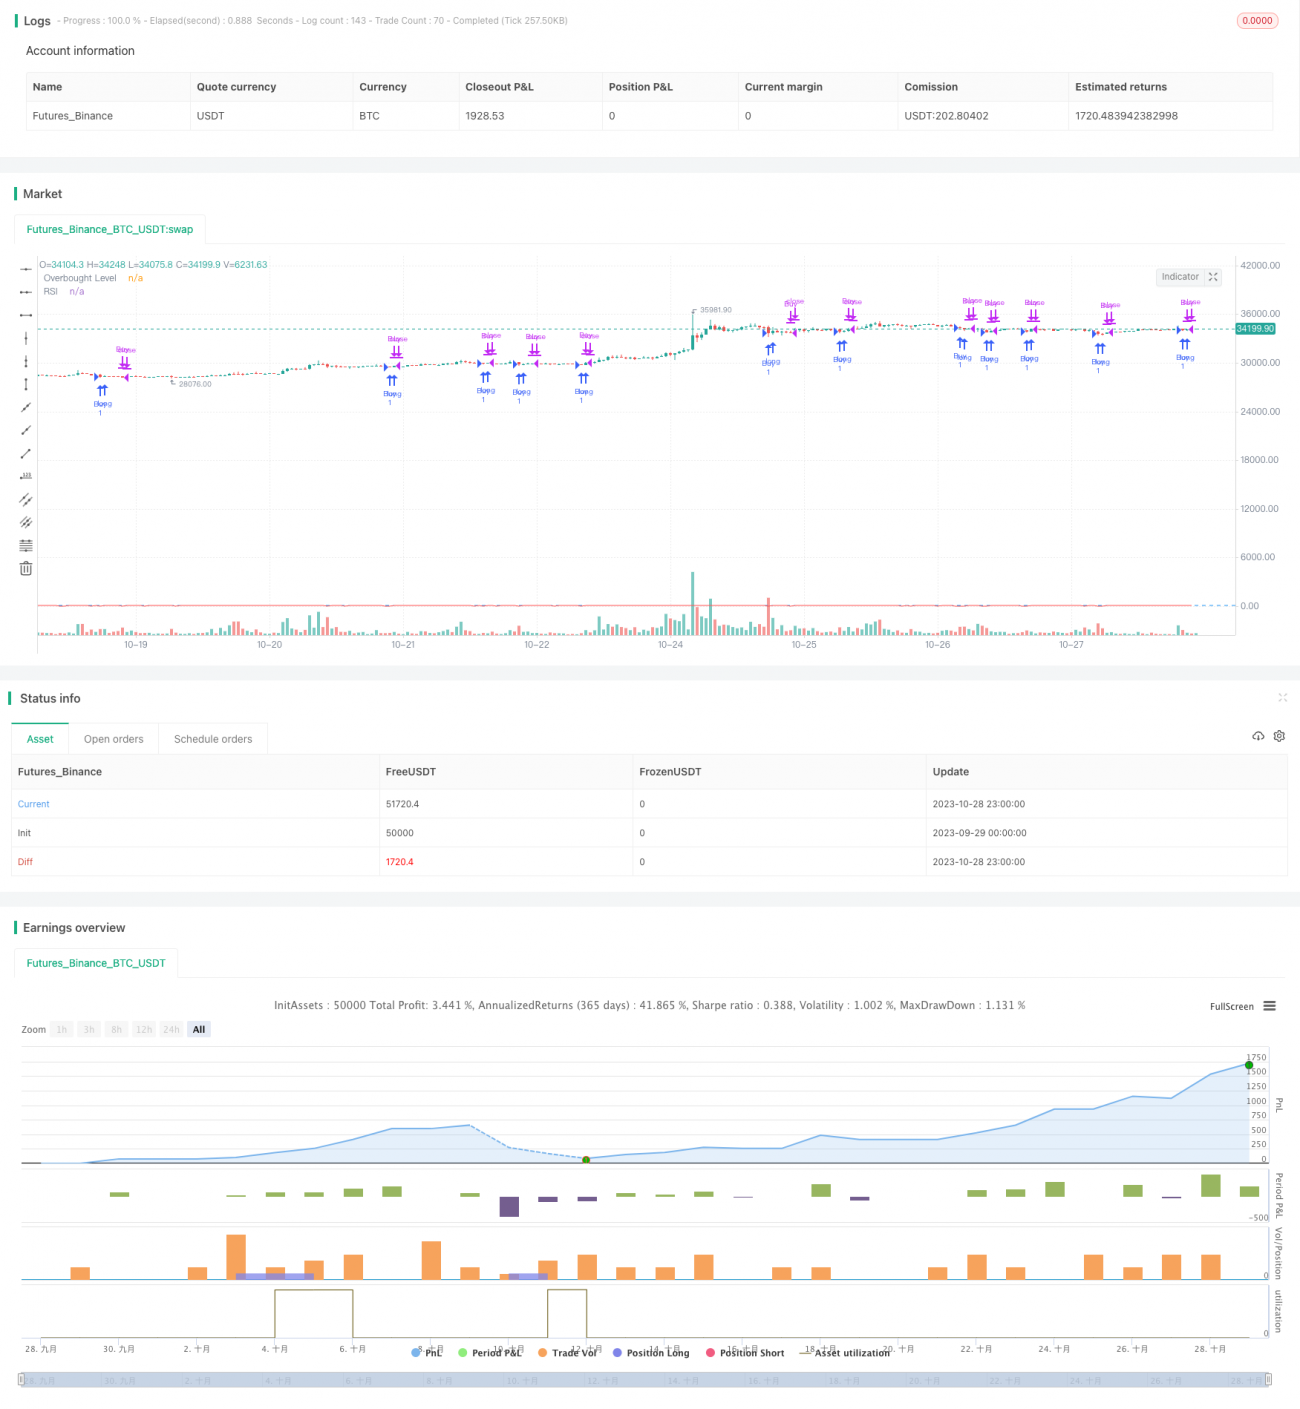
/*backtest
start: 2023-09-29 00:00:00
end: 2023-10-29 00:00:00
period: 1h
basePeriod: 15m
exchanges: [{"eid":"Futures_Binance","currency":"BTC_USDT"}]
*/

// This source code is subject to the terms of the Mozilla Public License 2.0 at https://mozilla.org/MPL/2.0/
// © hobbiecode

// If today’s close is below yesterday’s five-day low, go long at the close.- 1