Strategi trailing stop loss dinamis
Ringkasan
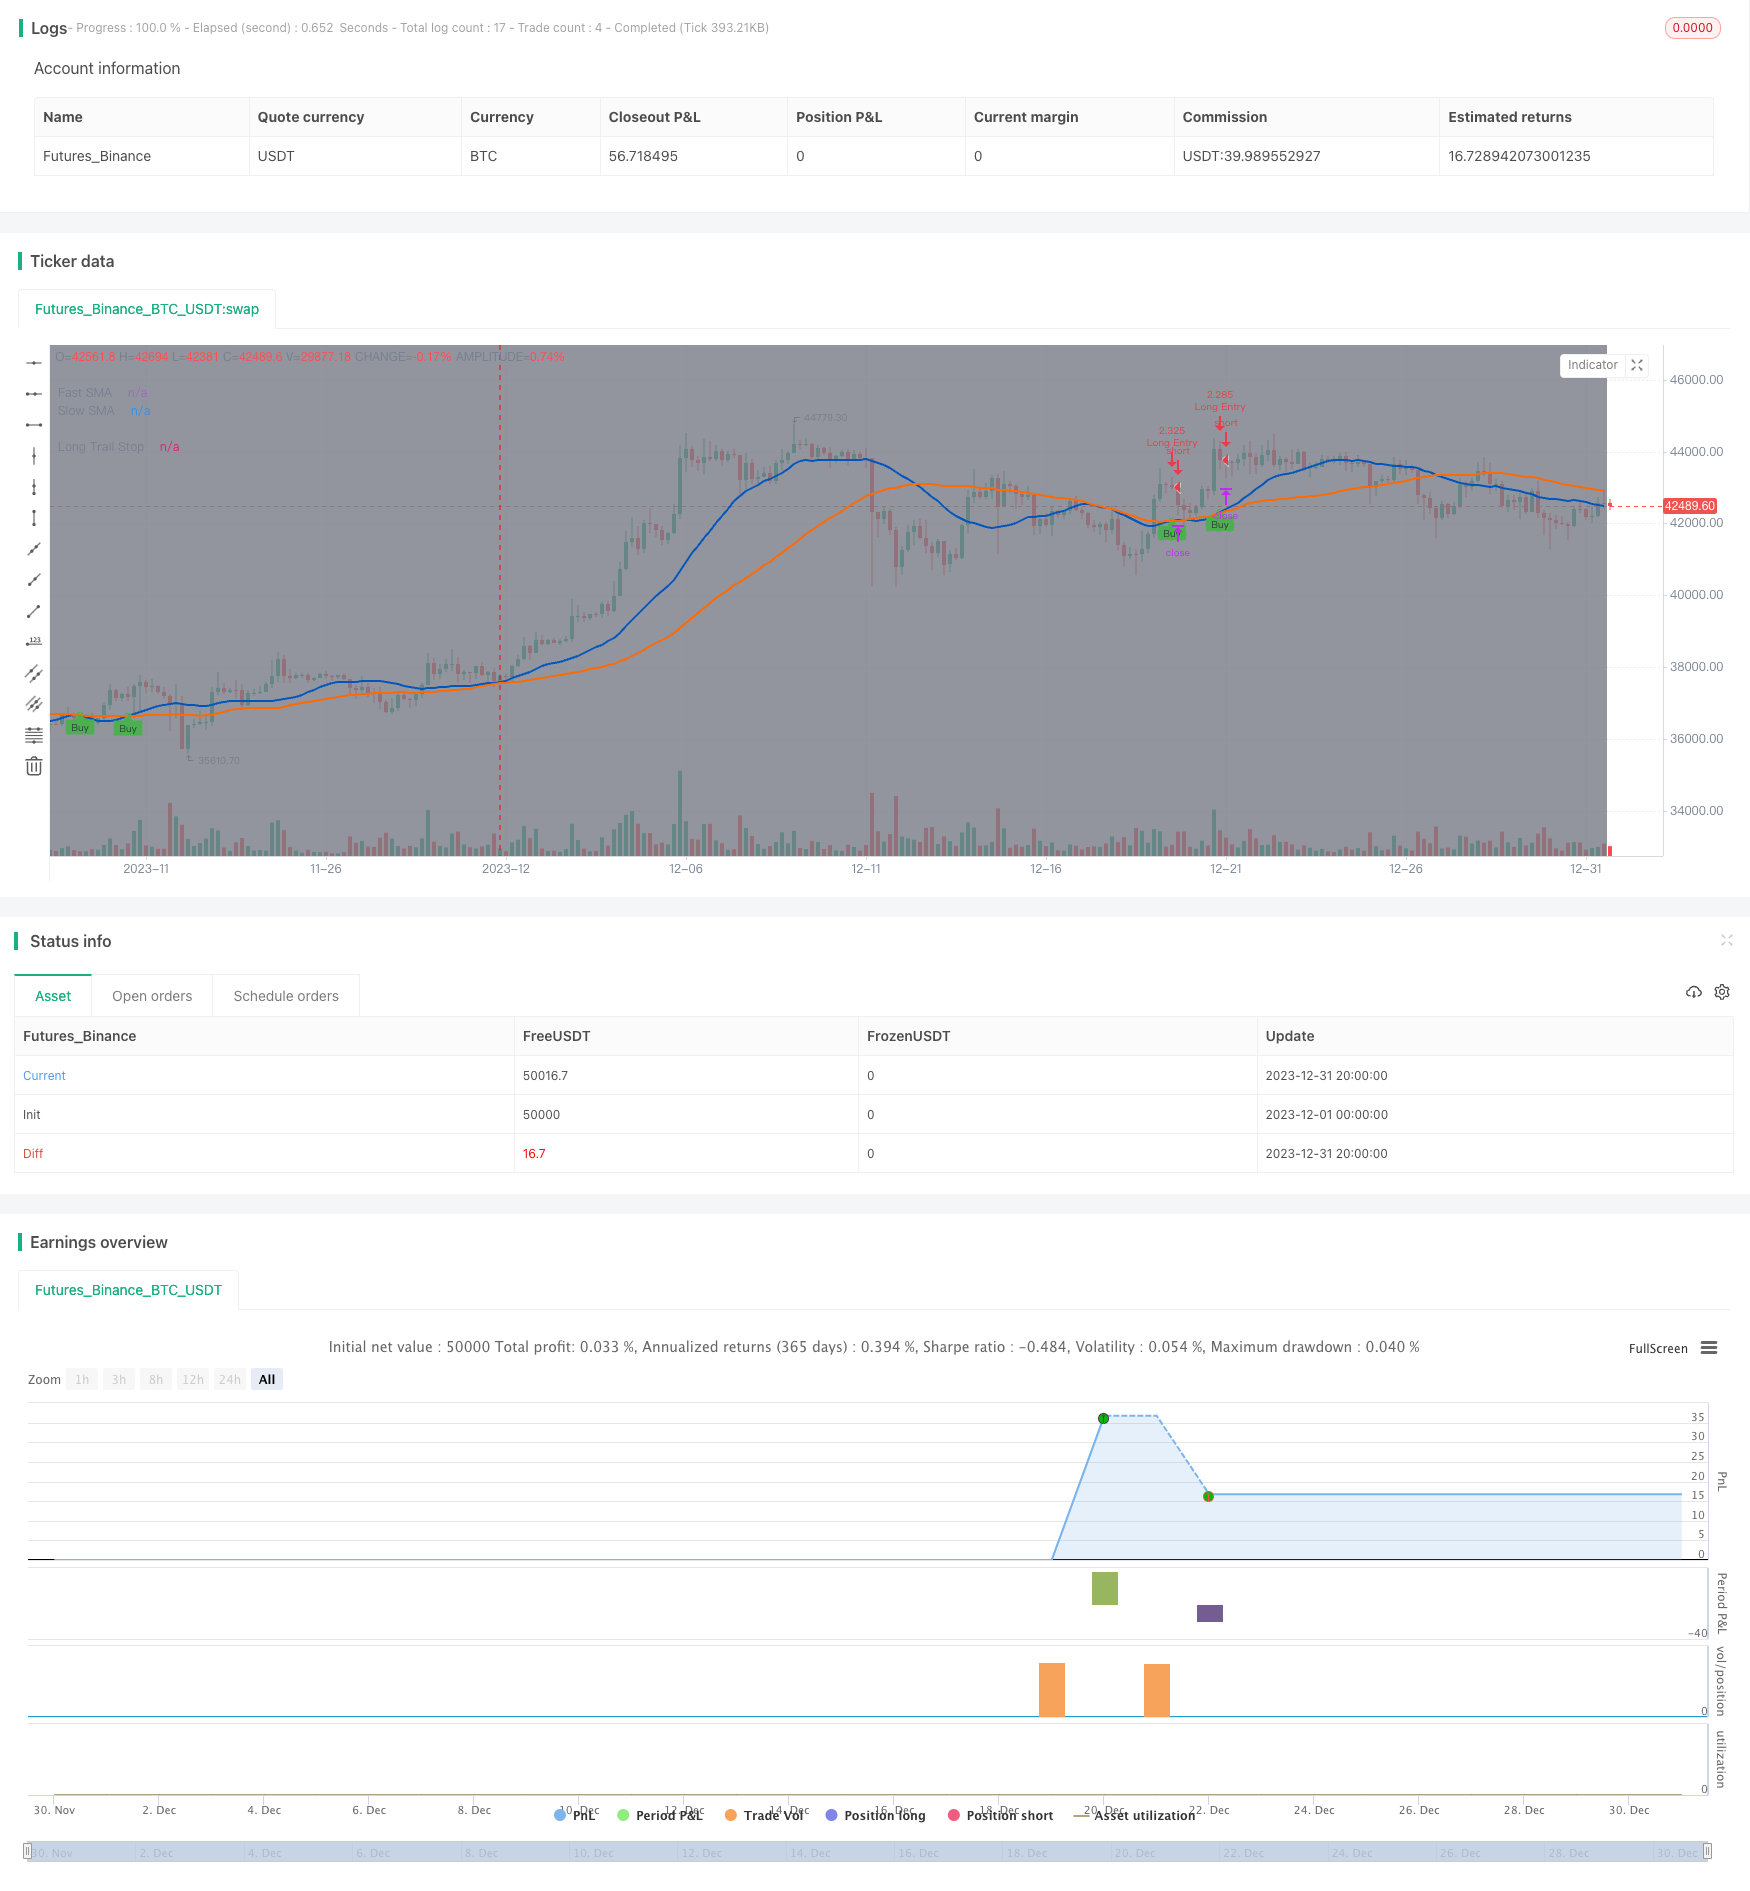
Strategi ini menilai tren dengan menghitung persilangan rata-rata bergerak cepat dan rata-rata bergerak lambat, melakukan over pada rata-rata bergerak cepat saat melintasi rata-rata bergerak lambat, dan mengatur garis stop loss yang dilacak secara dinamis untuk mengunci keuntungan, dan stop loss keluar pada persentase perubahan harga.
Prinsip Strategi
Strategi ini menggunakan laju bergerak cepat dan laju bergerak lambat untuk menentukan awal dari tren multihead. Secara khusus, adalah menghitung nilai rata-rata bergerak sederhana dari harga penutupan dalam periode tertentu, dibandingkan dengan rata-rata cepat dan rata-rata lambat, ketika laju bergerak cepat melewati rata-rata bergerak lambat, dinilai sebagai awal dari tren multihead, saat ini membuka posisi lebih banyak.
Setelah melakukan over, strategi ini tidak menetapkan stop loss tetap, tetapi menggunakan stop loss line yang dilacak secara dinamis untuk mengunci keuntungan. Metode pengaturan stop loss line ini adalah:*Hal ini memungkinkan stop loss line untuk naik dengan harga naik, dan stop loss keluar ketika turun dalam proporsi tertentu.
Keuntungan dari metode ini adalah bahwa Anda dapat mengejar keuntungan tanpa batas dan dapat mengunci keuntungan dengan stop loss setelah keuntungan mencapai tingkat tertentu.
Analisis Keunggulan
Keuntungan utama dari strategi stop loss ini adalah:
Anda dapat mengejar tanpa batas dan tidak akan kehilangan permainan besar. Dengan menggunakan stop loss tetap, Anda dapat dengan mudah terhenti setelah permainan besar dimulai.
Anda dapat mengunci keuntungan dengan mengatur persentase stop loss. Jika Anda hanya mengejar kerugian, Anda mungkin akan rugi di akhir perdagangan. Dengan mengatur stop loss, Anda dapat mengunci keuntungan.
Lebih fleksibel dari stop loss tetap. Stop loss tetap hanya dapat ditetapkan pada satu harga, dan stop loss di sini akan berubah sesuai dengan harga tertinggi.
Resiko penarikan lebih kecil. Dengan stop loss tetap, harga stop loss lebih jauh dari harga tertinggi, dan mungkin akan terhenti dalam penarikan normal.
Analisis risiko
Strategi ini juga memiliki beberapa risiko:
Indikator sinyal masuk tidak stabil, dapat menghasilkan sinyal yang salah.
Stop loss tunggal, tanpa mempertimbangkan faktor-faktor lain. Pasar mungkin tiba-tiba perubahan besar menyebabkan strategi gagal.
Tidak ada batasan stop loss, tergantung pada stop loss. Jika stop loss gagal, bisa menyebabkan kerugian yang lebih besar.
Pengaturan data perlu dioptimalkan. Parameter seperti siklus rata-rata bergerak perlu disesuaikan dengan optimal.
Arah optimasi
Strategi ini juga dapat dioptimalkan dalam beberapa hal:
Menambahkan lebih banyak indikator untuk mengkonfirmasi masuk dan menghindari sinyal yang salah.
Tambahkan pengaturan stop. Stop ketika keuntungan mencapai proporsi tertentu.
Peningkatan keamanan stop loss. Penyesuaian jarak stop loss secara drastis ketika terjadi ketidaknormalan pasar.
Adaptasi yang optimal untuk varietas perdagangan, waktu perdagangan, dll. Parameter varietas dan waktu perdagangan yang berbeda perlu disesuaikan.
Menambahkan pembelajaran mesin untuk menyesuaikan parameter secara dinamis. Biarkan model mengoptimalkan indikator penilaian dan stop loss secara otomatis.
Meringkaskan
Strategi ini memiliki konsep yang jelas dan masuk akal, menggunakan tren penilaian garis rata-rata yang cepat dan lambat adalah metode yang lebih klasik, dan menggunakan metode stop loss yang dilacak secara dinamis dapat secara efektif mengunci keuntungan dan mengurangi risiko. Namun, indikator dan parameter ini perlu terus diuji dan dioptimalkan untuk membuat strategi stabil dan menguntungkan. Selain itu, juga harus mencegah dampak perubahan besar pasar terhadap strategi, yang perlu dicapai dengan menyempurnakan konsep dan kerangka kerja keseluruhan, meningkatkan mekanisme keamanan.
/*backtest
start: 2023-12-01 00:00:00
end: 2023-12-31 23:59:59
period: 4h
basePeriod: 15m
exchanges: [{"eid":"Futures_Binance","currency":"BTC_USDT"}]
*/

//@version=4
//
// ▒▒▒▒▒▒▒▒▒▒▒▒▒▒▒▒▒▒▒▒▒▒▒▒▒▒▒▒▒▒▒▒▒▒▒▒▒▒▒▒▒▒▒▒▒▒▒▒▒▒▒▒▒▒▒▒▒▒▒▒▒▒▒▒▒▒▒▒▒▒▒▒▒▒▒▒▒▒▒▒▒▒▒▒▒▒▒▒▒▒▒▒▒▒▒▒▒▒▒▒▒▒▒▒▒▒▒▒▒▒▒▒▒▒
//  -----------------------------------------------------------------------------
//  Copyright 2021 Iason Nikolas | jason5480
//  Trainiling Take Profit Trailing Stop Loss script may be freely distributed under the MIT license.
//
//  Permission is hereby granted, free of charge,
//  to any person obtaining a copy of this software and associated documentation files (the "Software"),
//  to deal in the Software without restriction, including without limitation the rights to use, copy, modify, merge,
//  publish, distribute, sublicense, and/or sell copies of the Software, and to permit persons to whom the Software is furnished to do so,
//  subject to the following conditions:
//
//  The above copyright notice and this permission notice shall be included in all copies or substantial portions of the Software.
//
//  THE SOFTWARE IS PROVIDED "AS IS", WITHOUT WARRANTY OF ANY KIND,
//  EXPRESS OR IMPLIED, INCLUDING BUT NOT LIMITED TO THE WARRANTIES OF MERCHANTABILITY,
//  FITNESS FOR A PARTICULAR PURPOSE AND NONINFRINGEMENT. IN NO EVENT SHALL THE AUTHORS OR COPYRIGHT HOLDERS BE LIABLE FOR ANY CLAIM,
//  DAMAGES OR OTHER LIABILITY, WHETHER IN AN ACTION OF CONTRACT, TORT OR OTHERWISE, ARISING FROM,
//  OUT OF OR IN CONNECTION WITH THE SOFTWARE OR THE USE OR OTHER DEALINGS IN THE SOFTWARE.
//
//  -----------------------------------------------------------------------------
//
//  Authors:  @jason5480
//  Revision: v1.0.0
//  Date:     05-May-2021
//
//  Description
//  =============================================================================
//  This strategy will go long if fast MA crosses over slow MA.
//  The strategy will exit from long position when the price increases by a fixed percentage.
//  If the trailing take profit is checked then the strategy instead of setting a limit order in a predefined price (based on the percentage)
//  it will follow the price with small steps (percentagewise)
//  If the price drops by this percentage then the exit order will be executed
//
//  The strategy has the following parameters:
//
//  Fast SMA Length - How many candles back to calculte the fast SMA.
//  Slow SMA Length - How many candles back to calculte the slow SMA.
//  Enable Trailing - Enable or disable the trailing.
//  Stop Loss % - The percentage of the price decrease to set the stop loss price target for long positions.
//
//  -----------------------------------------------------------------------------
//  Disclaimer:
//    1. I am not licensed financial advisors or broker dealer. I do not tell you
//       when or what to buy or sell. I developed this software which enables you
//       execute manual or automated trades using TradingView. The
//       software allows you to set the criteria you want for entering and exiting
//       trades.
//    2. Do not trade with money you cannot afford to lose.
//    3. I do not guarantee consistent profits or that anyone can make money with no
//       effort. And I am not selling the holy grail.
//    4. Every system can have winning and losing streaks.
//    5. Money management plays a large role in the results of your trading. For
//       example: lot size, account size, broker leverage, and broker margin call
//       rules all have an effect on results. Also, your Take Profit and Stop Loss
//       settings for individual pair trades and for overall account equity have a
//       major impact on results. If you are new to trading and do not understand
//       these items, then I recommend you seek education materials to further your
//       knowledge.
//
//    YOU NEED TO FIND AND USE THE TRADING SYSTEM THAT WORKS BEST FOR YOU AND YOUR
//    TRADING TOLERANCE.
//
//    I HAVE PROVIDED NOTHING MORE THAN A TOOL WITH OPTIONS FOR YOU TO TRADE WITH THIS PROGRAM ON TRADINGVIEW.
//
//    I accept suggestions to improve the script.
//    If you encounter any problems I will be happy to share with me.
//  -----------------------------------------------------------------------------
//
// ▒▒▒▒▒▒▒▒▒▒▒▒▒▒▒▒▒▒▒▒▒▒▒▒▒▒▒▒▒▒▒▒▒▒▒▒▒▒▒▒▒▒▒▒▒▒▒▒▒▒▒▒▒▒▒▒▒▒▒▒▒▒▒▒▒▒▒▒▒▒▒▒▒▒▒▒▒▒▒▒▒▒▒▒▒▒▒▒▒▒▒▒▒▒▒▒▒▒▒▒▒▒▒▒▒▒▒▒▒▒▒▒▒▒
// SETUP ============================================================================================================
strategy(title = "Trailing Stop Loss",
         shorttitle = "TSL",
         overlay = true,
         pyramiding = 0,
         calc_on_every_tick = true,
         default_qty_type = strategy.cash,
         default_qty_value = 100000,
         initial_capital = 100000)

//
// ▒▒▒▒▒▒▒▒▒▒▒▒▒▒▒▒▒▒▒▒▒▒▒▒▒▒▒▒▒▒▒▒▒▒▒▒▒▒▒▒▒▒▒▒▒▒▒▒▒▒▒▒▒▒▒▒▒▒▒▒▒▒▒▒▒▒▒▒▒▒▒▒▒▒▒▒▒▒▒▒▒▒▒▒▒▒▒▒▒▒▒▒▒▒▒▒▒▒▒▒▒▒▒▒▒▒▒▒▒▒▒▒▒▒
// INPUTS ===========================================================================================================

// STRATEGY INPUT ===================================================================================================
fastMALen = input(defval = 21, title = "Fast SMA Length", type = input.integer, group = "Strategy", tooltip = "How many candles back to calculte the fast SMA.")
slowMALen = input(defval = 49, title = "Slow SMA Length", type = input.integer, group = "Strategy", tooltip = "How many candles back to calculte the slow SMA.")

enableStopLossTrailing = input(defval = true, title = "Enable Trailing", type = input.bool, group = "Strategy", tooltip = "Enable or disable the trailing for stop loss.")
longTrailingStopLossPerc = input(defval = 7.5, title = 'Long Stop Loss %', type = input.float, minval = 0.1, maxval = 100, step = 0.1, inline = "Trailing Stop Loss Perc", group = "Strategy") / 100

// BACKTEST PERIOD INPUT ============================================================================================
fromDate = input(defval = timestamp("01 Jan 2021 00:00 UTC"), title = "From Date", type = input.time, minval = timestamp("01 Jan 1970 00:00 UTC"), group = "Backtest Period") // backtest start date
toDate   = input(defval = timestamp("31 Dec 2121 23:59 UTC"), title = "To Date",   type = input.time, minval = timestamp("01 Jan 1970 00:00 UTC"), group = "Backtest Period") // backtest finish date

isWithinBacktestPeriod() => true

// SHOW PLOT INPUT ==================================================================================================
showDate = input(defval = true, title = "Show Backtest Range", type = input.bool, group = "Plot", tooltip = "Gray out the backround of the backtest period.")

//
// ▒▒▒▒▒▒▒▒▒▒▒▒▒▒▒▒▒▒▒▒▒▒▒▒▒▒▒▒▒▒▒▒▒▒▒▒▒▒▒▒▒▒▒▒▒▒▒▒▒▒▒▒▒▒▒▒▒▒▒▒▒▒▒▒▒▒▒▒▒▒▒▒▒▒▒▒▒▒▒▒▒▒▒▒▒▒▒▒▒▒▒▒▒▒▒▒▒▒▒▒▒▒▒▒▒▒▒▒▒▒▒▒▒▒
// STRATEGY LOGIC ===================================================================================================

fastMA = sma(close, fastMALen)
slowMA = sma(close, slowMALen)

bool startLongDeal = crossover(fastMA, slowMA)

bool longIsActive = startLongDeal or strategy.position_size > 0

// determine trailing stop loss price
float longTrailingStopLossPrice = na
longTrailingStopLossPrice := if (longIsActive)
    stopValue = high * (1 - longTrailingStopLossPerc)
    max(stopValue, nz(longTrailingStopLossPrice[1]))
else
    na

//
// ▒▒▒▒▒▒▒▒▒▒▒▒▒▒▒▒▒▒▒▒▒▒▒▒▒▒▒▒▒▒▒▒▒▒▒▒▒▒▒▒▒▒▒▒▒▒▒▒▒▒▒▒▒▒▒▒▒▒▒▒▒▒▒▒▒▒▒▒▒▒▒▒▒▒▒▒▒▒▒▒▒▒▒▒▒▒▒▒▒▒▒▒▒▒▒▒▒▒▒▒▒▒▒▒▒▒▒▒▒▒▒▒▒▒
// STRATEGY EXECUTION ===============================================================================================

if (isWithinBacktestPeriod())
    // getting into LONG position
    strategy.entry(id = "Long Entry", long = strategy.long, when = startLongDeal, alert_message = "Long(" + syminfo.ticker + "): Started")
    // submit exit orders for trailing stop loss price
    strategy.exit(id = "Long Stop Loss", from_entry = "Long Entry", stop = longTrailingStopLossPrice, when = longIsActive, alert_message = "Long(" + syminfo.ticker + "): Stop Loss activated")


//
// ▒▒▒▒▒▒▒▒▒▒▒▒▒▒▒▒▒▒▒▒▒▒▒▒▒▒▒▒▒▒▒▒▒▒▒▒▒▒▒▒▒▒▒▒▒▒▒▒▒▒▒▒▒▒▒▒▒▒▒▒▒▒▒▒▒▒▒▒▒▒▒▒▒▒▒▒▒▒▒▒▒▒▒▒▒▒▒▒▒▒▒▒▒▒▒▒▒▒▒▒▒▒▒▒▒▒▒▒▒▒▒▒▒▒
// PLOT DATE POSITION MA AND TRAILING TAKE PROFIT STOP LOSS =========================================================

bgcolor(color = showDate and isWithinBacktestPeriod() ? color.gray : na, transp = 90)

plot(series = fastMA, title = "Fast SMA", color = #0056BD, linewidth = 2, style = plot.style_line)
plot(series = slowMA, title = "Slow SMA", color = #FF6A00, linewidth = 2, style = plot.style_line)
plotshape(series = isWithinBacktestPeriod() and startLongDeal and strategy.position_size <= 0 ? fastMA : na, title = "UpTrend Begins", style = shape.circle, location = location.absolute, color = color.green, transp = 0, size = size.tiny)
plotshape(series = isWithinBacktestPeriod() and startLongDeal and strategy.position_size <= 0 ? fastMA : na, title = "Buy", text = "Buy", style = shape.labelup, location = location.absolute, color = color.green, textcolor = color.black, transp = 0, size = size.tiny)

plot(series = strategy.position_avg_price, title = "Position", color = color.blue, linewidth = 2, style = plot.style_linebr, offset = 1)
plot(series = longTrailingStopLossPrice, title = "Long Trail Stop", color = color.fuchsia, linewidth = 2, style = plot.style_linebr, offset = 1)

// ==================================================================================================================