Strategi perdagangan divergensi abnormal RSI
Nama kebijakan
RSI Bullish/Bearish Divergence Trading Strategy
Ringkasan
Strategi ini menggunakan indikator RSI untuk mengidentifikasi sinyal deviasi multihead dan blank yang normal dan tersembunyi, dan melakukan lebih banyak blank sesuai dengan keputusan deviasi sinyal yang tidak normal.
Prinsip Strategi
Ketika harga inovasi harga tinggi, RSI tidak inovasi highs membentuk headline abnormal deviation, dianggap sebagai sinyal menjual. Ketika harga inovasi lows, RSI tidak inovasi lows membentuk headline abnormal deviation, dianggap sebagai sinyal beli. Regular deviation adalah jelas deviasi antara harga dan RSI indikator.
Analisis Keunggulan
- Ketergantungan yang lebih tinggi dan tingkat kemenangan yang lebih tinggi.
- Pada saat yang sama, identifikasi konstan dan tersembunyi dari polygon, yang mencakup area luas.
- Parameter indikator RSI dapat disesuaikan untuk kondisi pasar yang berbeda.
Analisis risiko
- “Kalau ada yang tersembunyi dari sinyal, kemungkinan besar ada kesalahan pengertian”.
- Periksa manual untuk memfilter sinyal misdiagnosis.
- Efeknya berkaitan dengan pengaturan parameter RSI.
Arah optimasi
- Mengoptimalkan parameter RSI, mencari kombinasi parameter optimal.
- Menambahkan algoritma pembelajaran mesin untuk mengidentifikasi sinyal yang sebenarnya secara otomatis.
- Tergabung dengan lebih banyak indikator untuk memverifikasi keandalan sinyal.
Meringkaskan
Strategi ini mengidentifikasi RSI yang tidak normal dari sinyal perdagangan, dan membuat keputusan untuk melakukan lebih banyak shorting berdasarkan acak dan tersembunyi. Dengan mengoptimalkan parameter RSI, menambahkan indikator verifikasi lainnya, dapat meningkatkan efektivitas strategi lebih lanjut.
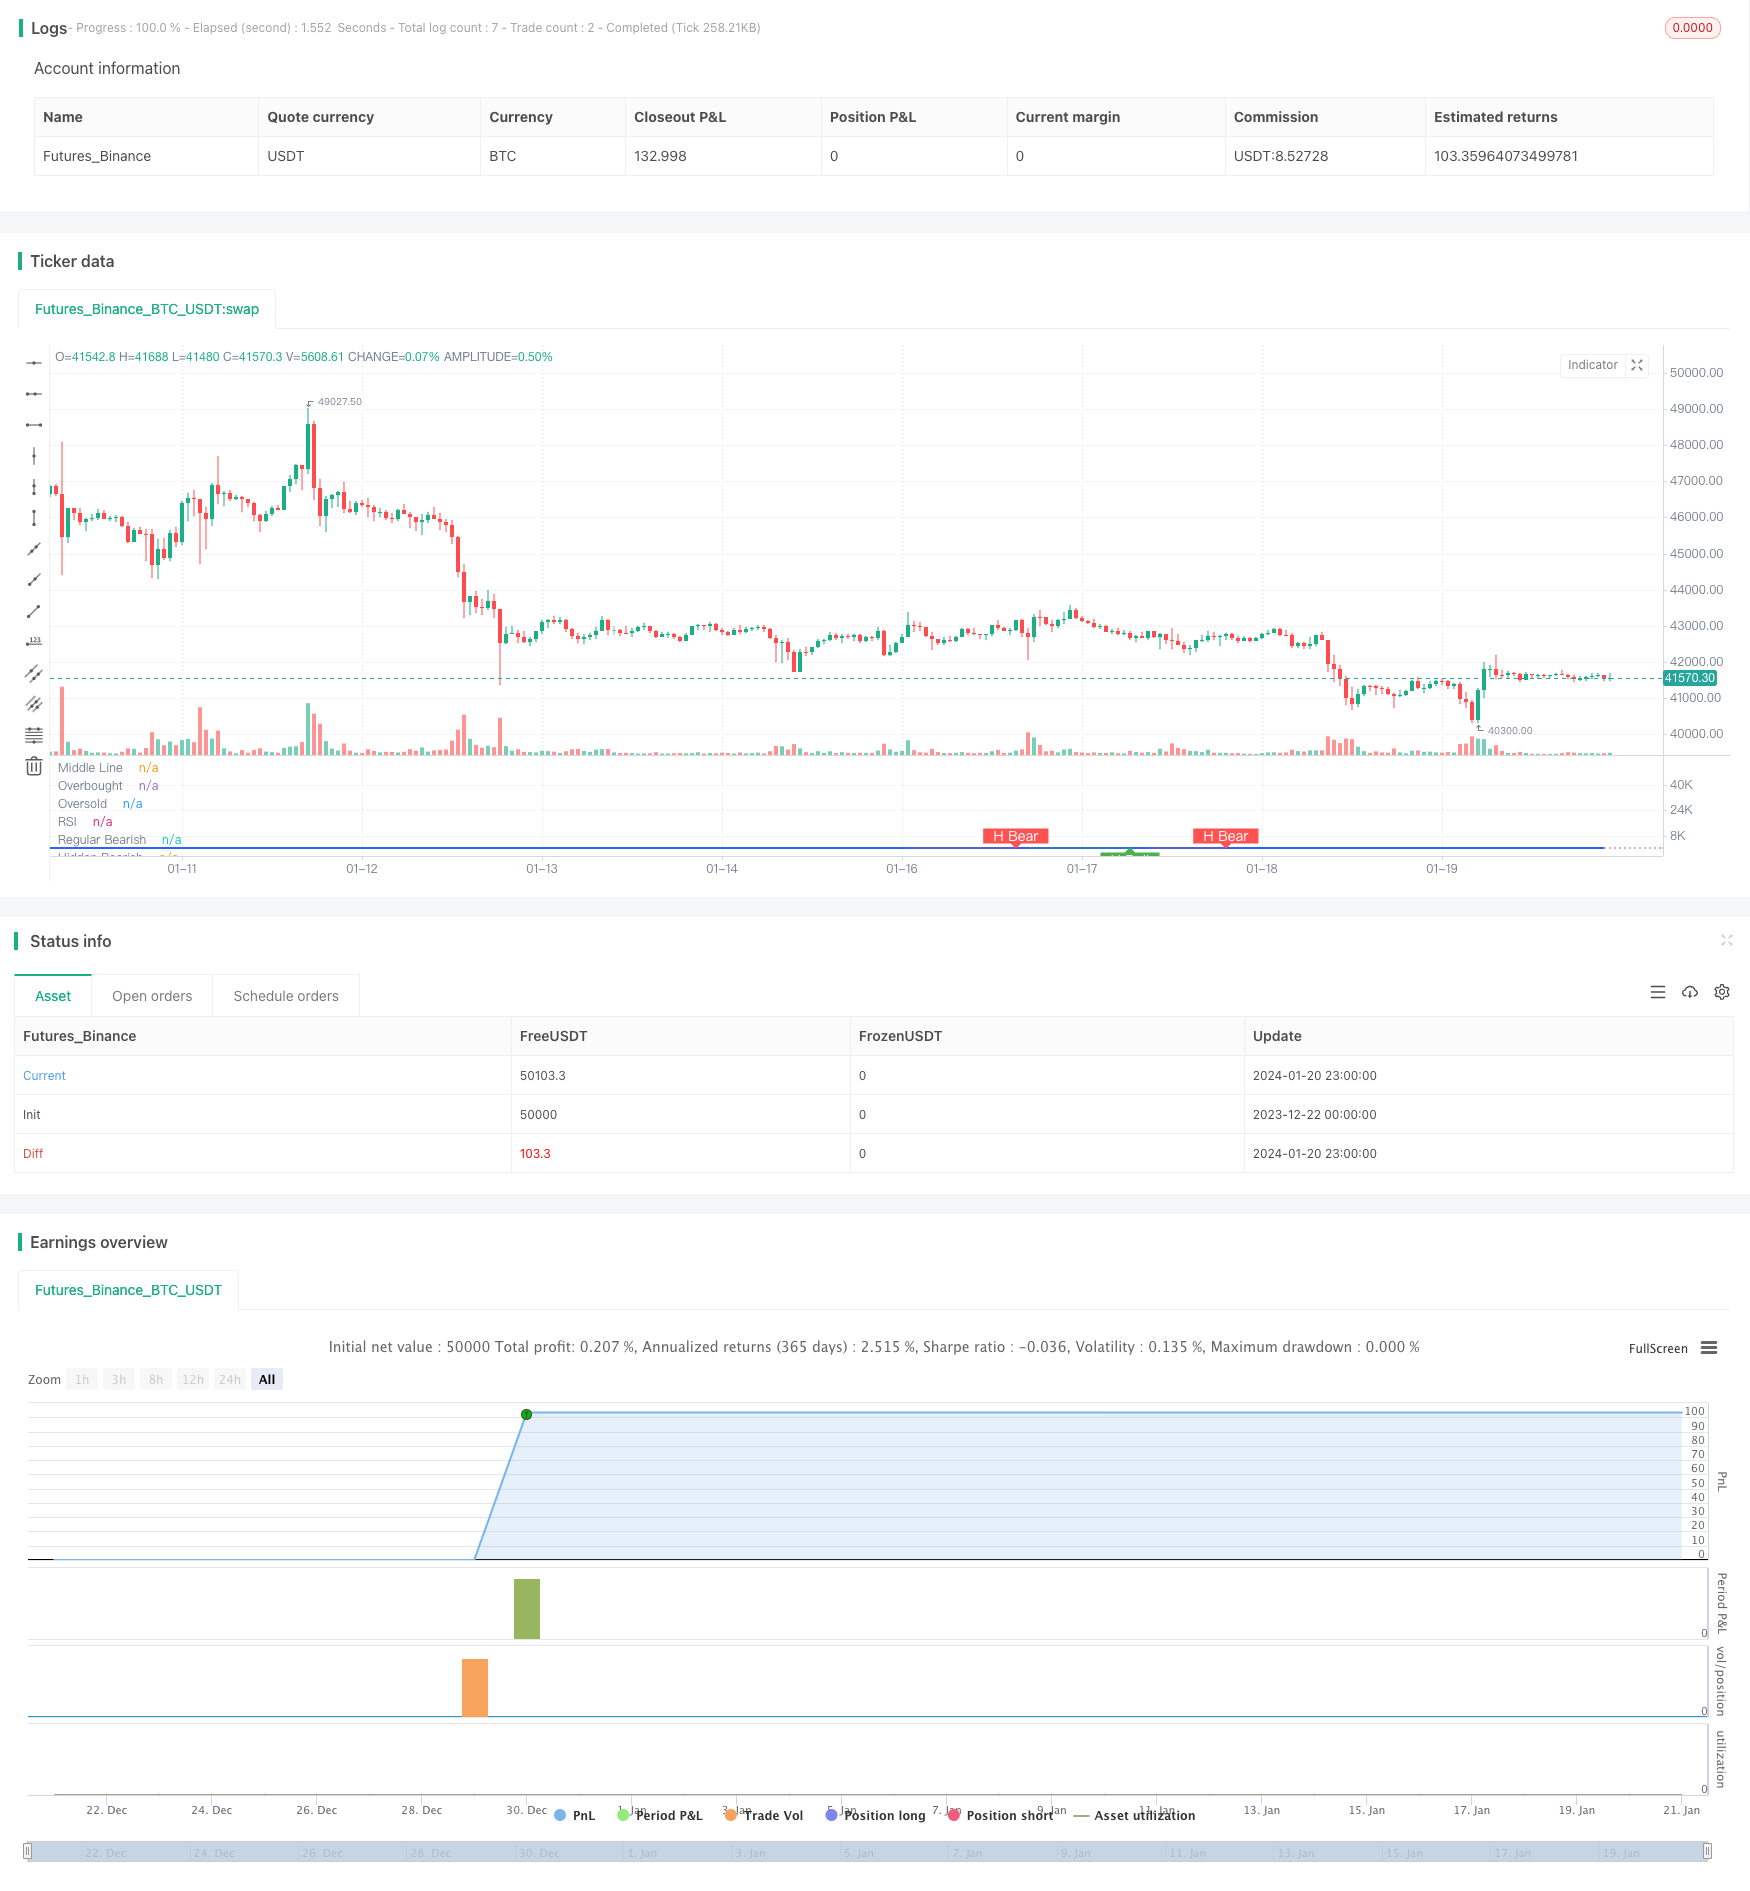
/*backtest
start: 2023-12-22 00:00:00
end: 2024-01-21 00:00:00
period: 1h
basePeriod: 15m
exchanges: [{"eid":"Futures_Binance","currency":"BTC_USDT"}]
*/

//@version=5
strategy(title="Divergence Indicator")
len = input.int(title="RSI Period", minval=1, defval=14)
src = input(title="RSI Source", defval=close)
lbR = input(title="Pivot Lookback Right", defval=5)
lbL = input(title="Pivot Lookback Left", defval=5)
rangeUpper = input(title="Max of Lookback Range", defval=60)
rangeLower = input(title="Min of Lookback Range", defval=5)
plotBull = input(title="Plot Bullish", defval=true)
plotHiddenBull = input(title="Plot Hidden Bullish", defval=true)
plotBear = input(title="Plot Bearish", defval=true)
plotHiddenBear = input(title="Plot Hidden Bearish", defval=true)
bearColor = color.red
bullColor = color.green
hiddenBullColor = color.new(color.green, 80)
hiddenBearColor = color.new(color.red, 80)
textColor = color.white
noneColor = color.new(color.white, 100)
osc = ta.rsi(src, len)

plot(osc, title="RSI", linewidth=2, color=#2962FF)
hline(50, title="Middle Line", color=#787B86, linestyle=hline.style_dotted)
obLevel = hline(70, title="Overbought", color=#787B86, linestyle=hline.style_dotted)
osLevel = hline(30, title="Oversold", color=#787B86, linestyle=hline.style_dotted)
fill(obLevel, osLevel, title="Background", color=color.rgb(33, 150, 243, 90))

plFound = na(ta.pivotlow(osc, lbL, lbR)) ? false : true
phFound = na(ta.pivothigh(osc, lbL, lbR)) ? false : true
_inRange(cond) =>
	bars = ta.barssince(cond == true)
	rangeLower <= bars and bars <= rangeUpper

//------------------------------------------------------------------------------
// Regular Bullish
// Osc: Higher Low

oscHL = osc[lbR] > ta.valuewhen(plFound, osc[lbR], 1) and _inRange(plFound[1])

// Price: Lower Low

priceLL = low[lbR] < ta.valuewhen(plFound, low[lbR], 1)
// bull : 상승 Condition : 조건
bullCond = plotBull and priceLL and oscHL and plFound // 상승다이버전스?
strategy.entry("상승 다이버전스 진입", strategy.long, when = bullCond)
strategy.close("상승 다이버전스 진입", when = ta.crossover(osc, 50))
plot(
     plFound ? osc[lbR] : na,
     offset=-lbR,
     title="Regular Bullish",
     linewidth=2,
     color=(bullCond ? bullColor : noneColor)
     )

plotshape(
	 bullCond ? osc[lbR] : na,
	 offset=-lbR,
	 title="Regular Bullish Label",
	 text=" Bull ",
	 style=shape.labelup,
	 location=location.absolute,
	 color=bullColor,
	 textcolor=textColor
	 )

//------------------------------------------------------------------------------
// Hidden Bullish
// Osc: Lower Low

oscLL = osc[lbR] < ta.valuewhen(plFound, osc[lbR], 1) and _inRange(plFound[1])

// Price: Higher Low

priceHL = low[lbR] > ta.valuewhen(plFound, low[lbR], 1)
hiddenBullCond = plotHiddenBull and priceHL and oscLL and plFound
// strategy.entry("히든 상승 다이버전스 진입", strategy.long, when = hiddenBullCond)
// strategy.close("히든 상승 다이버전스 진입", when = ta.crossover(osc, 50))
plot(
	 plFound ? osc[lbR] : na,
	 offset=-lbR,
	 title="Hidden Bullish",
	 linewidth=2,
	 color=(hiddenBullCond ? hiddenBullColor : noneColor)
	 )

plotshape(
	 hiddenBullCond ? osc[lbR] : na,
	 offset=-lbR,
	 title="Hidden Bullish Label",
	 text=" H Bull ",
	 style=shape.labelup,
	 location=location.absolute,
	 color=bullColor,
	 textcolor=textColor
	 )

//------------------------------------------------------------------------------
// Regular Bearish
// Osc: Lower High

oscLH = osc[lbR] < ta.valuewhen(phFound, osc[lbR], 1) and _inRange(phFound[1])

// Price: Higher High

priceHH = high[lbR] > ta.valuewhen(phFound, high[lbR], 1)
// bear : 하락
bearCond = plotBear and priceHH and oscLH and phFound
// strategy.entry("하락 다이버전스 진입", strategy.short, when = bearCond)
// strategy.close("하락 다이버전스 진입", when = ta.crossunder(osc, 50))
plot(
	 phFound ? osc[lbR] : na,
	 offset=-lbR,
	 title="Regular Bearish",
	 linewidth=2,
	 color=(bearCond ? bearColor : noneColor)
	 )

plotshape(
	 bearCond ? osc[lbR] : na,
	 offset=-lbR,
	 title="Regular Bearish Label",
	 text=" Bear ",
	 style=shape.labeldown,
	 location=location.absolute,
	 color=bearColor,
	 textcolor=textColor
	 )

//------------------------------------------------------------------------------
// Hidden Bearish
// Osc: Higher High

oscHH = osc[lbR] > ta.valuewhen(phFound, osc[lbR], 1) and _inRange(phFound[1])

// Price: Lower High

priceLH = high[lbR] < ta.valuewhen(phFound, high[lbR], 1)

hiddenBearCond = plotHiddenBear and priceLH and oscHH and phFound
// strategy.entry("히든 하락 다이버전스 진입", strategy.short, when = hiddenBearCond)
// strategy.close("히든 하락 다이버전스 진입", when = ta.crossunder(osc, 50))
plot(
	 phFound ? osc[lbR] : na,
	 offset=-lbR,
	 title="Hidden Bearish",
	 linewidth=2,
	 color=(hiddenBearCond ? hiddenBearColor : noneColor)
	 )

plotshape(
	 hiddenBearCond ? osc[lbR] : na,
	 offset=-lbR,
	 title="Hidden Bearish Label",
	 text=" H Bear ",
	 style=shape.labeldown,
	 location=location.absolute,
	 color=bearColor,
	 textcolor=textColor
	 )