3 倍移動平均取引戦略


作成日: 2023-11-02 14:47:45 最終変更日: 2023-11-02 14:47:45
コピー: 1 クリック数: 898
1
フォロー
1617
フォロワー

3 倍移動平均取引戦略

概要

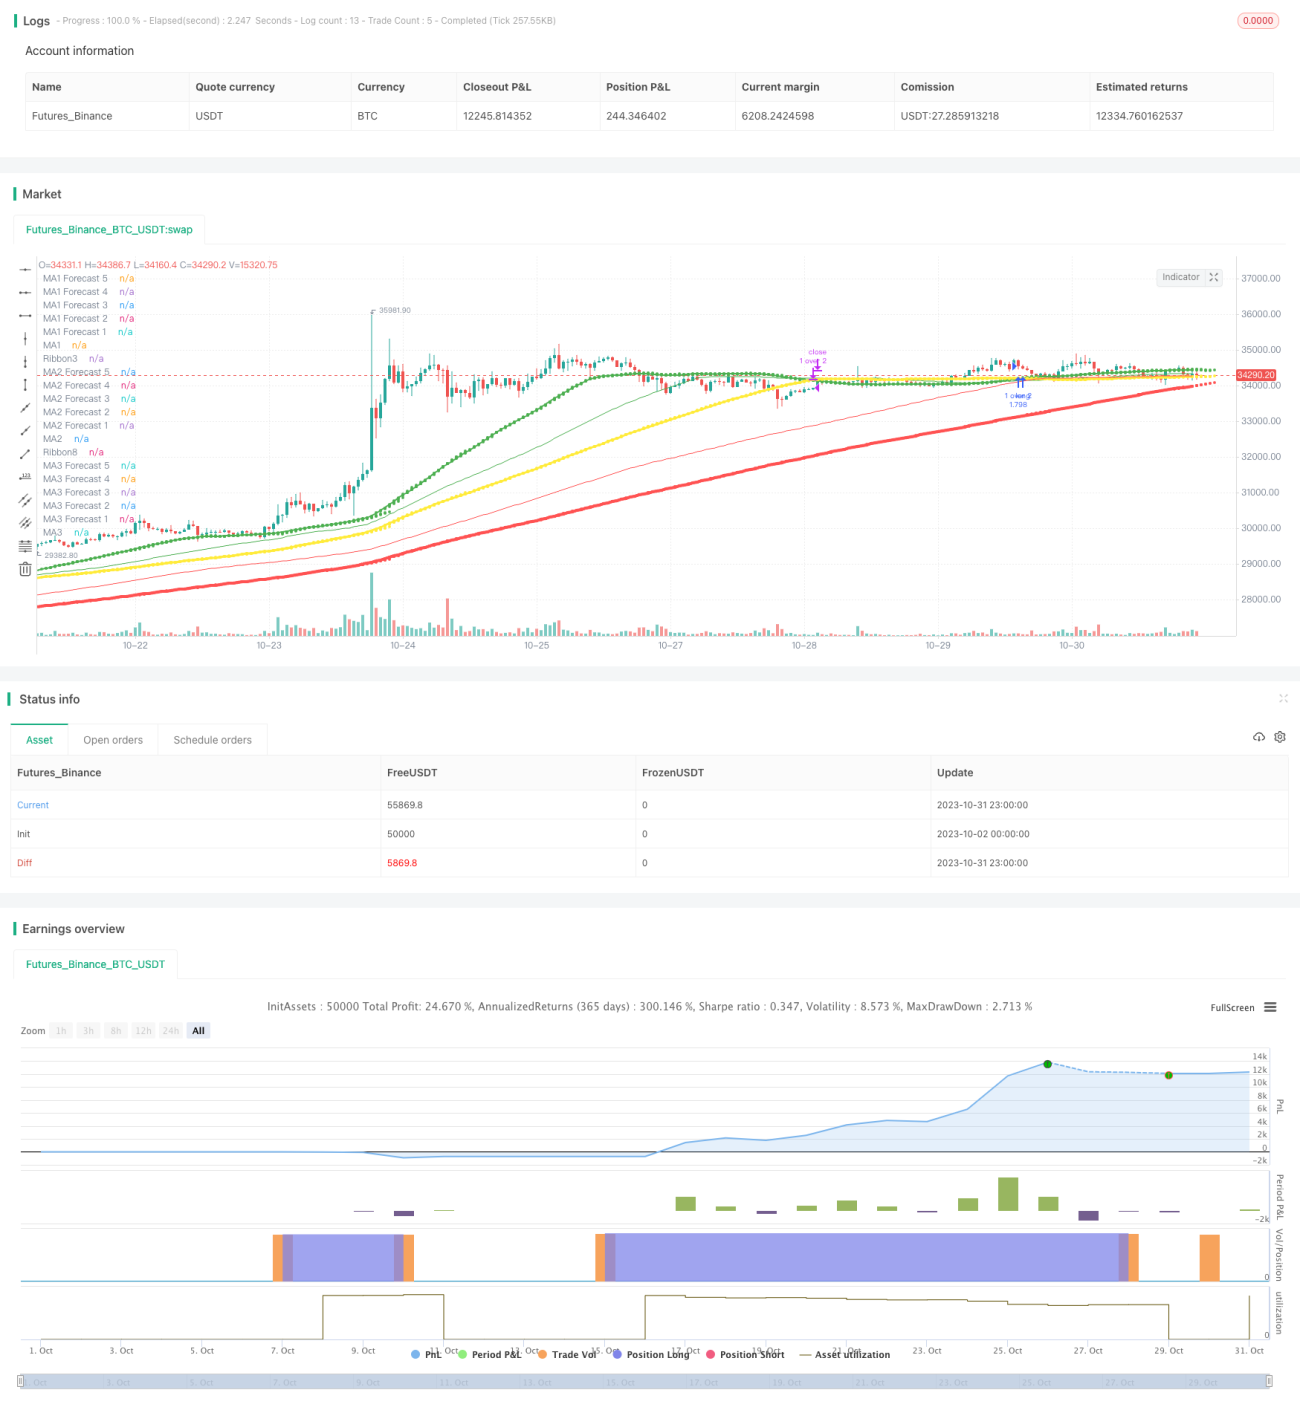
この戦略は,3つの移動平均に基づいてトレンドを追跡する取引戦略である.これは,3つの異なる周期の移動平均を同時に使って多空の意思決定を行う,典型的なトレンドを追跡する戦略である.

戦略原則

  1. この戦略は3つの移動平均を使用します.MA1,MA2およびMA3.3の移動平均周期はユーザーによって設定され,通常はMA1 < MA2 < MA3として設定されます.例えば,MA1は50周期,MA2は100周期,MA3は200周期です.

  2. 戦略は,MA1を主要取引決定基準として参照する. 短い周期MA1で長い周期MA2またはMA3を穿越すると,多めに行い,MA1の下ではMA2またはMA3を穿越すると,空いて行い.

  3. 戦略は,MA1とMA2の交差のみを取引するか,MA1とMA3の交差のみを取引するか,または両交差を同時に取引するかの選択が可能です.

  4. 交差シグナルが発生すると,市場価格を使用して単発で取引を開始します. ストップ・ストップ・ロスは,特定のパーセントをcloseに設定します.例えば,30%のストップ・ストップ,15%のストップ・ストップです.

  5. 戦略の最適化については,MA線の周期パラメータを調整し,ストップ・ストップ・損失パーセントを調整し,他の指標のフィルタリング信号を追加することができる.

優位分析

  1. 複数の移動平均を用いて意思決定を行うことで,偽突破を効果的にフィルターすることができます.

  2. 異なる周期MAの組み合わせを使用し,トレンドの中で動的にポジションを調整し,トレンド追跡を実現する.

  3. ゴールデン・クロスのみ,デス・クロスのみ,または両方とも取引できる.

  4. ストップダメージメカニズムは,単一の損失を効果的に制御できます.

リスク分析

  1. 動向型戦略を踏まえて,震動の際の損失を回避する.

  2. MA周期が正しく設定されていない場合,頻繁に取引が起こり,勝率が低下する可能性があります.

  3. 突破が失敗した後に,早期に止まらなければ,大きな損失を招く可能性があります.

  4. ストップ・ストップ・ロスの設定が緩やかすぎると,単一の損失が大きすぎます.

最適化の方向

  1. MAのパラメータを最適化して,最適なパラメータの組み合わせを見つけます.

  2. 他の指標を追加してフィルタリングし,入場時間を最適化します.例えばMACD,KDJなどです.

  3. ストップ・ストップ・ロスの最適化により,戦略の利益リスク比が最適化されます.

  4. 固定数量開設や資金管理など,ポジション管理を増やす.

  5. 突破に対するストップラインの滑り点を追加し,ストップ・ローズ戦略を最適化する.

要約する

この戦略は全体として典型的なトレンドフォロー戦略であり,複数のMAの交差によって判断され,比較的安定したトレンドフォロー戦略の1つである.パラメータ最適化,指標フィルタリング,ポジション管理などの方法によってさらに向上させることができる.しかし,核心思想はシンプルで明確で,初心者の学習と実践に適しています.パラメータ最適化が適切であれば,傾向が顕著な市場で,この戦略は安定した収益を得ることができます.

ストラテジーソースコード
/*backtest
start: 2023-10-02 00:00:00
end: 2023-11-01 00:00:00
period: 1h
basePeriod: 15m
exchanges: [{"eid":"Futures_Binance","currency":"BTC_USDT"}]
*/

//@version=4

//
// Pine Script v4
// @author BigBitsIO
// Script Library: https://www.tradingview.com/u/BigBitsIO/#published-scripts
//

// study(title, shorttitle, overlay, format, precision)
// https://www.tradingview.com/pine-script-reference/#fun_strategy  
strategy(shorttitle = "TManyMA Strategy - STA - Stops", title="Triple Many Moving Averages", overlay=true, pyramiding=1, default_qty_type=strategy.percent_of_equity, default_qty_value=100)

// MA#Period is a variable used to store the indicator lookback period.  In this case, from the input.
// input - https://www.tradingview.com/pine-script-docs/en/v4/annotations/Script_inputs.html
MA1Period = input(50, title="MA1 Period", minval=1, step=1)
MA1Type = input(title="MA1 Type", defval="SMA", options=["RMA", "SMA", "EMA", "WMA", "HMA", "DEMA", "TEMA", "VWMA"])
MA1Source = input(title="MA1 Source", type=input.source, defval=close)
MA1Resolution = input(title="MA1 Resolution", defval="00 Current", options=["00 Current", "01 1m", "02 3m", "03 5m", "04 15m", "05 30m", "06 45m", "07 1h", "08 2h", "09 3h", "10 4h", "11 1D", "12 1W", "13 1M"])
MA1Visible = input(title="MA1 Visible", type=input.bool, defval=true) // Will automatically hide crossBovers containing this MA

MA2Period = input(100, title="MA2 Period", minval=1, step=1)
MA2Type = input(title="MA2 Type", defval="SMA", options=["RMA", "SMA", "EMA", "WMA", "HMA", "DEMA", "TEMA", "VWMA"])
MA2Source = input(title="MA2 Source", type=input.source, defval=close)
MA2Resolution = input(title="MA2 Resolution", defval="00 Current", options=["00 Current", "01 1m", "02 3m", "03 5m", "04 15m", "05 30m", "06 45m", "07 1h", "08 2h", "09 3h", "10 4h", "11 1D", "12 1W", "13 1M"])
MA2Visible = input(title="MA2 Visible", type=input.bool, defval=true) // Will automatically hide crossovers containing this MA

MA3Period = input(200, title="MA3 Period", minval=1, step=1)
MA3Type = input(title="MA3 Type", defval="SMA", options=["RMA", "SMA", "EMA", "WMA", "HMA", "DEMA", "TEMA", "VWMA"])
MA3Source = input(title="MA3 Source", type=input.source, defval=close)
MA3Resolution = input(title="MA3 Resolution", defval="00 Current", options=["00 Current", "01 1m", "02 3m", "03 5m", "04 15m", "05 30m", "06 45m", "07 1h", "08 2h", "09 3h", "10 4h", "11 1D", "12 1W", "13 1M"])
MA3Visible = input(title="MA3 Visible", type=input.bool, defval=true) // Will automatically hide crossovers containing this MA

ShowCrosses = input(title="Show Crosses", type=input.bool, defval=false)

ForecastBias = input(title="Forecast Bias", defval="Neutral", options=["Neutral", "Bullish", "Bearish"])
ForecastBiasPeriod = input(14, title="Forecast Bias Period")
ForecastBiasMagnitude = input(1, title="Forecast Bias Magnitude", minval=0.25, maxval=20, step=0.25)
ShowForecasts = input(title="Show Forecasts", type=input.bool, defval=true)

ShowRibbons = input(title="Show Ribbons", type=input.bool, defval=true)

TradeMA12Crosses = input(title="Trade MA 1-2 Crosses", type=input.bool, defval=true)
TradeMA13Crosses = input(title="Trade MA 1-3 Crosses", type=input.bool, defval=true)
TradeMA23Crosses = input(title="Trade MA 2-3 Crosses", type=input.bool, defval=true)

TakeProfitPercent = input(30, title="Take Profit Percent", minval=0.01, step=0.5)
StopLossPercent = input(15, title="Stop Loss Percent", minval=0.01, step=0.5)


// MA# is a variable used to store the actual moving average value.
// if statements - https://www.tradingview.com/pine-script-reference/#op_if
// MA functions - https://www.tradingview.com/pine-script-reference/ (must search for appropriate MA)
// custom functions in  pine - https://www.tradingview.com/wiki/Declaring_Functions
ma(MAType, MASource, MAPeriod) =>
    if MAType == "SMA"
        sma(MASource, MAPeriod)
    else
        if MAType == "EMA"
            ema(MASource, MAPeriod)
        else
            if MAType == "WMA"
                wma(MASource, MAPeriod)
            else
                if MAType == "RMA"
                    rma(MASource, MAPeriod)
                else
                    if MAType == "HMA"
                        wma(2*wma(MASource, MAPeriod/2)-wma(MASource, MAPeriod), round(sqrt(MAPeriod)))
                    else
                        if MAType == "DEMA"
                            e = ema(MASource, MAPeriod)
                            2 * e - ema(e, MAPeriod)
                        else
                            if MAType == "TEMA"
                                e = ema(MASource, MAPeriod)
                                3 * (e - ema(e, MAPeriod)) + ema(ema(e, MAPeriod), MAPeriod)
                            else
                                if MAType == "VWMA"
                                    vwma(MASource, MAPeriod)
                                
res(MAResolution) =>
    if MAResolution == "00 Current"
        timeframe.period
    else
        if MAResolution == "01 1m"
            "1"
        else
            if MAResolution == "02 3m"
                "3"
            else
                if MAResolution == "03 5m"
                    "5"
                else
                    if MAResolution == "04 15m"
                        "15"
                    else
                        if MAResolution == "05 30m"
                            "30"
                        else
                            if MAResolution == "06 45m"
                                "45"
                            else
                                if MAResolution == "07 1h"
                                    "60"
                                else
                                    if MAResolution == "08 2h"
                                        "120"
                                    else
                                        if MAResolution == "09 3h"
                                            "180"
                                        else
                                            if MAResolution == "10 4h"
                                                "240"
                                            else
                                                if MAResolution == "11 1D"
                                                    "1D"
                                                else
                                                    if MAResolution == "12 1W"
                                                        "1W"
                                                    else
                                                        if MAResolution == "13 1M"
                                                            "1M"

// https://www.tradingview.com/pine-script-reference/#fun_request.security
MA1 = request.security(syminfo.tickerid, res(MA1Resolution), ma(MA1Type, MA1Source, MA1Period))     
MA2 = request.security(syminfo.tickerid, res(MA2Resolution), ma(MA2Type, MA2Source, MA2Period))
MA3 = request.security(syminfo.tickerid, res(MA3Resolution), ma(MA3Type, MA3Source, MA3Period))   
                    
// Plotting crossover/unders for all combinations of crosses
// Crossovers no longer detected in label code, they need to be re-used for strategy - crosses and visibility must be set
MA12Crossover = MA1Visible and MA2Visible and crossover(MA1, MA2)
MA12Crossunder = MA1Visible and MA2Visible and crossunder(MA1, MA2)
MA13Crossover = MA1Visible and MA3Visible and crossover(MA1, MA3)
MA13Crossunder = MA1Visible and MA3Visible and crossunder(MA1, MA3)
MA23Crossover = MA2Visible and MA3Visible and crossover(MA2, MA3)
MA23Crossunder = MA2Visible and MA3Visible and crossunder(MA2, MA3)

// https://www.tradingview.com/pine-script-reference/v4/#fun_label%7Bdot%7Dnew
if ShowCrosses and MA12Crossunder
    lun1 = label.new(bar_index, na, tostring(MA1Period)+' '+MA1Type+' crossed under '+tostring(MA2Period)+' '+MA2Type, 
      color=color.red, 
      textcolor=color.red,
      style=label.style_xcross, size=size.small)
    label.set_y(lun1, MA1)
if ShowCrosses and MA12Crossover
    lup1 = label.new(bar_index, na, tostring(MA1Period)+' '+MA1Type+' crossed over '+tostring(MA2Period)+' '+MA2Type, 
      color=color.green, 
      textcolor=color.green,
      style=label.style_xcross, size=size.small)
    label.set_y(lup1, MA1)
if ShowCrosses and MA13Crossunder
    lun2 = label.new(bar_index, na, tostring(MA1Period)+' '+MA1Type+' crossed under '+tostring(MA3Period)+' '+MA3Type, 
      color=color.red, 
      textcolor=color.red,
      style=label.style_xcross, size=size.small)
    label.set_y(lun2, MA1)
if ShowCrosses and MA13Crossover
    lup2 = label.new(bar_index, na, tostring(MA1Period)+' '+MA1Type+' crossed over '+tostring(MA3Period)+' '+MA3Type, 
      color=color.green, 
      textcolor=color.green,
      style=label.style_xcross, size=size.small)
    label.set_y(lup2, MA1)
if ShowCrosses and MA23Crossunder
    lun3 = label.new(bar_index, na, tostring(MA2Period)+' '+MA2Type+' crossed under '+tostring(MA3Period)+' '+MA3Type, 
      color=color.red, 
      textcolor=color.red,
      style=label.style_xcross, size=size.small)
    label.set_y(lun3, MA2)
if ShowCrosses and MA23Crossover
    lup3 = label.new(bar_index, na, tostring(MA2Period)+' '+MA2Type+' crossed over '+tostring(MA3Period)+' '+MA3Type, 
      color=color.green, 
      textcolor=color.green,
      style=label.style_xcross, size=size.small)
    label.set_y(lup3, MA2) 

// plot - This will draw the information on the chart
// plot - https://www.tradingview.com/pine-script-docs/en/v4/annotations/plot_annotation.html
plot(MA1Visible ? MA1 : na, color=color.green, linewidth=2, title="MA1")
plot(MA2Visible ? MA2 : na, color=color.yellow, linewidth=3, title="MA2")
plot(MA3Visible ? MA3 : na, color=color.red, linewidth=4, title="MA3")


// Forecasting - forcasted prices are calculated using our MAType and MASource for the MAPeriod - the last X candles.
//              it essentially replaces the oldest X candles, with the selected source * X candles
// Bias - We'll add an "adjustment" for each additional candle being forecasted based on ATR of the previous X candles
// custom functions in  pine - https://www.tradingview.com/wiki/Declaring_Functions
bias(Bias, BiasPeriod) =>
    if Bias == "Neutral"
        0
    else
        if Bias == "Bullish"
            (atr(BiasPeriod) * ForecastBiasMagnitude)
        else
            if Bias == "Bearish"
                ((atr(BiasPeriod)  * ForecastBiasMagnitude) * -1) // multiplying by -1 to make it a negative, bearish bias


// Note - Can not show forecasts on different resolutions at the moment, x-axis is an issue
Bias = bias(ForecastBias, ForecastBiasPeriod) // 14 is default atr period
MA1Forecast1 = (request.security(syminfo.tickerid, res(MA1Resolution), ma(MA1Type, MA1Source, MA1Period - 1)) * (MA1Period - 1) + ((MA1Source * 1) + (Bias * 1))) / MA1Period 
MA1Forecast2 = (request.security(syminfo.tickerid, res(MA1Resolution), ma(MA1Type, MA1Source, MA1Period - 2)) * (MA1Period - 2) + ((MA1Source * 2) + (Bias * 2))) / MA1Period
MA1Forecast3 = (request.security(syminfo.tickerid, res(MA1Resolution), ma(MA1Type, MA1Source, MA1Period - 3)) * (MA1Period - 3) + ((MA1Source * 3) + (Bias * 3))) / MA1Period
MA1Forecast4 = (request.security(syminfo.tickerid, res(MA1Resolution), ma(MA1Type, MA1Source, MA1Period - 4)) * (MA1Period - 4) + ((MA1Source * 4) + (Bias * 4))) / MA1Period
MA1Forecast5 = (request.security(syminfo.tickerid, res(MA1Resolution), ma(MA1Type, MA1Source, MA1Period - 5)) * (MA1Period - 5) + ((MA1Source * 5) + (Bias * 5))) / MA1Period


plot(MA1Resolution == "00 Current" and ShowForecasts and MA1Visible ? MA1Forecast1 : na, color=color.green, linewidth=1, style=plot.style_circles, title="MA1 Forecast 1", offset=1, show_last=1)
plot(MA1Resolution == "00 Current" and ShowForecasts and MA1Visible ? MA1Forecast2 : na, color=color.green, linewidth=1, style=plot.style_circles, title="MA1 Forecast 2", offset=2, show_last=1)
plot(MA1Resolution == "00 Current" and ShowForecasts and MA1Visible ? MA1Forecast3 : na, color=color.green, linewidth=1, style=plot.style_circles, title="MA1 Forecast 3", offset=3, show_last=1)
plot(MA1Resolution == "00 Current" and ShowForecasts and MA1Visible ? MA1Forecast4 : na, color=color.green, linewidth=1, style=plot.style_circles, title="MA1 Forecast 4", offset=4, show_last=1)
plot(MA1Resolution == "00 Current" and ShowForecasts and MA1Visible ? MA1Forecast5 : na, color=color.green, linewidth=1, style=plot.style_circles, title="MA1 Forecast 5", offset=5, show_last=1)


MA2Forecast1 = (request.security(syminfo.tickerid, res(MA2Resolution), ma(MA2Type, MA2Source, MA2Period - 1)) * (MA2Period - 1) + ((MA1Source * 1) + (Bias * 1))) / MA2Period
MA2Forecast2 = (request.security(syminfo.tickerid, res(MA2Resolution), ma(MA2Type, MA2Source, MA2Period - 2)) * (MA2Period - 2) + ((MA1Source * 2) + (Bias * 2))) / MA2Period
MA2Forecast3 = (request.security(syminfo.tickerid, res(MA2Resolution), ma(MA2Type, MA2Source, MA2Period - 3)) * (MA2Period - 3) + ((MA1Source * 3) + (Bias * 3))) / MA2Period
MA2Forecast4 = (request.security(syminfo.tickerid, res(MA2Resolution), ma(MA2Type, MA2Source, MA2Period - 4)) * (MA2Period - 4) + ((MA1Source * 4) + (Bias * 4))) / MA2Period
MA2Forecast5 = (request.security(syminfo.tickerid, res(MA2Resolution), ma(MA2Type, MA2Source, MA2Period - 5)) * (MA2Period - 5) + ((MA1Source * 5) + (Bias * 5))) / MA2Period

plot(MA2Resolution == "00 Current" and ShowForecasts and MA2Visible ? MA2Forecast1 : na, color=color.yellow, linewidth=1, style=plot.style_circles, title="MA2 Forecast 1", offset=1, show_last=1)
plot(MA2Resolution == "00 Current" and ShowForecasts and MA2Visible ? MA2Forecast2 : na, color=color.yellow, linewidth=1, style=plot.style_circles, title="MA2 Forecast 2", offset=2, show_last=1)
plot(MA2Resolution == "00 Current" and ShowForecasts and MA2Visible ? MA2Forecast3 : na, color=color.yellow, linewidth=1, style=plot.style_circles, title="MA2 Forecast 3", offset=3, show_last=1)
plot(MA2Resolution == "00 Current" and ShowForecasts and MA2Visible ? MA2Forecast4 : na, color=color.yellow, linewidth=1, style=plot.style_circles, title="MA2 Forecast 4", offset=4, show_last=1)
plot(MA2Resolution == "00 Current" and ShowForecasts and MA2Visible ? MA2Forecast5 : na, color=color.yellow, linewidth=1, style=plot.style_circles, title="MA2 Forecast 5", offset=5, show_last=1)


MA3Forecast1 = (request.security(syminfo.tickerid, res(MA3Resolution), ma(MA3Type, MA3Source, MA3Period - 1)) * (MA3Period - 1) + ((MA1Source * 1) + (Bias * 1))) / MA3Period
MA3Forecast2 = (request.security(syminfo.tickerid, res(MA3Resolution), ma(MA3Type, MA3Source, MA3Period - 2)) * (MA3Period - 2) + ((MA1Source * 2) + (Bias * 2))) / MA3Period
MA3Forecast3 = (request.security(syminfo.tickerid, res(MA3Resolution), ma(MA3Type, MA3Source, MA3Period - 3)) * (MA3Period - 3) + ((MA1Source * 3) + (Bias * 3))) / MA3Period
MA3Forecast4 = (request.security(syminfo.tickerid, res(MA3Resolution), ma(MA3Type, MA3Source, MA3Period - 4)) * (MA3Period - 4) + ((MA1Source * 4) + (Bias * 4))) / MA3Period
MA3Forecast5 = (request.security(syminfo.tickerid, res(MA3Resolution), ma(MA3Type, MA3Source, MA3Period - 5)) * (MA3Period - 5) + ((MA1Source * 5) + (Bias * 5))) / MA3Period

plot(MA3Resolution == "00 Current" and ShowForecasts and MA3Visible ? MA3Forecast1 : na, color=color.red, linewidth=1, style=plot.style_circles, title="MA3 Forecast 1", offset=1, show_last=1)
plot(MA3Resolution == "00 Current" and ShowForecasts and MA3Visible ? MA3Forecast2 : na, color=color.red, linewidth=1, style=plot.style_circles, title="MA3 Forecast 2", offset=2, show_last=1)
plot(MA3Resolution == "00 Current" and ShowForecasts and MA3Visible ? MA3Forecast3 : na, color=color.red, linewidth=1, style=plot.style_circles, title="MA3 Forecast 3", offset=3, show_last=1)
plot(MA3Resolution == "00 Current" and ShowForecasts and MA3Visible ? MA3Forecast4 : na, color=color.red, linewidth=1, style=plot.style_circles, title="MA3 Forecast 4", offset=4, show_last=1)
plot(MA3Resolution == "00 Current" and ShowForecasts and MA3Visible ? MA3Forecast5 : na, color=color.red, linewidth=1, style=plot.style_circles, title="MA3 Forecast 5", offset=5, show_last=1)


// Ribbon related code
// For Ribbons to work - they must use the same MAType, MAResolution and MASource.  This is to ensure the ribbons are fair between one to the other.
// Ribbons also will usually look better if MA1Period < MA2Period and MA2Period < MA3Period

// custom functions in  pine - https://www.tradingview.com/wiki/Declaring_Functions
// This function is used to calculate the period to be used on a ribbon based on existing MAs
rperiod(P1, P2, Step, Ribbons) =>
    ((abs(P1 - P2)) / (Ribbons + 1) * Step) + min(P1, P2)
    // divide by +1 so that 5 lines can show.  Divide by 5 and one line shows up on another MA

// MA1-MA2
Ribbon1 = request.security(syminfo.tickerid, res(MA1Resolution), ma(MA1Type, MA1Source, rperiod(MA1Period, MA2Period, 1, 5)))
Ribbon2 = request.security(syminfo.tickerid, res(MA1Resolution), ma(MA1Type, MA1Source, rperiod(MA1Period, MA2Period, 2, 5)))
Ribbon3 = request.security(syminfo.tickerid, res(MA1Resolution), ma(MA1Type, MA1Source, rperiod(MA1Period, MA2Period, 3, 5)))
Ribbon4 = request.security(syminfo.tickerid, res(MA1Resolution), ma(MA1Type, MA1Source, rperiod(MA1Period, MA2Period, 4, 5)))
Ribbon5 = request.security(syminfo.tickerid, res(MA1Resolution), ma(MA1Type, MA1Source, rperiod(MA1Period, MA2Period, 5, 5)))

plot(ShowRibbons and MA1Type == MA2Type and MA1Resolution == MA2Resolution and MA1Source == MA2Source ? Ribbon1 : na, color=color.green, linewidth=1, style=plot.style_line, title="Ribbon1", transp=90)
plot(ShowRibbons and MA1Type == MA2Type and MA1Resolution == MA2Resolution and MA1Source == MA2Source ? Ribbon2 : na, color=color.green, linewidth=1, style=plot.style_line, title="Ribbon2", transp=85)
plot(ShowRibbons and MA1Type == MA2Type and MA1Resolution == MA2Resolution and MA1Source == MA2Source ? Ribbon3 : na, color=color.green, linewidth=1, style=plot.style_line, title="Ribbon3", transp=80)
plot(ShowRibbons and MA1Type == MA2Type and MA1Resolution == MA2Resolution and MA1Source == MA2Source ? Ribbon4 : na, color=color.yellow, linewidth=1, style=plot.style_line, title="Ribbon4", transp=75)
plot(ShowRibbons and MA1Type == MA2Type and MA1Resolution == MA2Resolution and MA1Source == MA2Source ? Ribbon5 : na, color=color.yellow, linewidth=1, style=plot.style_line, title="Ribbon5", transp=70)

// MA2-MA3
Ribbon6 = request.security(syminfo.tickerid, res(MA2Resolution), ma(MA2Type, MA2Source, rperiod(MA2Period, MA3Period, 1, 5)))
Ribbon7 = request.security(syminfo.tickerid, res(MA2Resolution), ma(MA2Type, MA2Source, rperiod(MA2Period, MA3Period, 2, 5)))
Ribbon8 = request.security(syminfo.tickerid, res(MA2Resolution), ma(MA2Type, MA2Source, rperiod(MA2Period, MA3Period, 3, 5)))
Ribbon9 = request.security(syminfo.tickerid, res(MA2Resolution), ma(MA2Type, MA2Source, rperiod(MA2Period, MA3Period, 4, 5)))
Ribbon10 = request.security(syminfo.tickerid, res(MA2Resolution), ma(MA2Type, MA2Source, rperiod(MA2Period, MA3Period, 5, 5)))
        
plot(ShowRibbons and MA2Type == MA3Type and MA2Resolution == MA3Resolution and MA2Source == MA3Source ? Ribbon6 : na, color=color.yellow, linewidth=1, style=plot.style_line, title="Ribbon6", transp=70)
plot(ShowRibbons and MA2Type == MA3Type and MA2Resolution == MA3Resolution and MA2Source == MA3Source ? Ribbon7 : na, color=color.yellow, linewidth=1, style=plot.style_line, title="Ribbon7", transp=75)
plot(ShowRibbons and MA2Type == MA3Type and MA2Resolution == MA3Resolution and MA2Source == MA3Source ? Ribbon8 : na, color=color.red, linewidth=1, style=plot.style_line, title="Ribbon8", transp=80)
plot(ShowRibbons and MA2Type == MA3Type and MA2Resolution == MA3Resolution and MA2Source == MA3Source ? Ribbon9 : na, color=color.red, linewidth=1, style=plot.style_line, title="Ribbon9", transp=85)
plot(ShowRibbons and MA2Type == MA3Type and MA2Resolution == MA3Resolution and MA2Source == MA3Source ? Ribbon10 : na, color=color.red, linewidth=1, style=plot.style_line, title="Ribbon10", transp=90)

// Strategy Specific
ProfitTarget = (close * (TakeProfitPercent / 100)) / syminfo.mintick
LossTarget = (close * (StopLossPercent / 100)) / syminfo.mintick

if MA12Crossover and TradeMA12Crosses
    //https://www.tradingview.com/pine-script-reference/#fun_strategy{dot}entry
    strategy.entry("1 over 2", true) // buy by market
    strategy.exit("profit or loss", "1 over 2", profit = ProfitTarget, loss = LossTarget)
if MA12Crossunder and TradeMA12Crosses
    //https://www.tradingview.com/pine-script-reference/#fun_strategy{dot}close
    strategy.close("1 over 2") // sell by market
    
if MA13Crossover and TradeMA13Crosses
    //https://www.tradingview.com/pine-script-reference/#fun_strategy{dot}entry
    strategy.entry("1 over 3", true) // buy by market
    strategy.exit("profit or loss", "1 over 3", profit = ProfitTarget, loss = LossTarget)
if MA13Crossunder and TradeMA13Crosses
    //https://www.tradingview.com/pine-script-reference/#fun_strategy{dot}close
    strategy.close("1 over 3") // sell by market
    
if MA23Crossover and TradeMA23Crosses
    //https://www.tradingview.com/pine-script-reference/#fun_strategy{dot}entry
    strategy.entry("2 over 3", true) // buy by market
    strategy.exit("profit or loss", "2 over 3", profit = ProfitTarget, loss = LossTarget)
if MA23Crossunder and TradeMA23Crosses
    //https://www.tradingview.com/pine-script-reference/#fun_strategy{dot}close
    strategy.close("2 over 3") // sell by market