ATRとトレーリングストップに基づくスーパートレンド戦略

概要
この戦略は,平均実物変動幅 ((ATR) の指標に基づいて,移動ストップラインと反転ラインを設計している.これは,価格の変化に応じて,トレーリングストップロスを行う,すなわち,ストップロスを調整する.具体的には,価格が1%以上変化した場合,ストップロスは,利益の方向に固定比率で移動する.価格がストップロスを破るとき,ポジションは自動的に平置される.これは利益をロックすることも,損失を減らすこともできる.
戦略原則
この策略はATR指標を用いて止損ラインを計算する.具体的公式は以下の通りである.
pine
atr = multplierFactor * atr(barsBack)
longStop = hl2 - atr
shortStop = hl2 + atr
複数の要素はATRの増幅係数で,バースバックはATR周期数である.ATRの値が大きいほど,市場の変動が大きいことを示す.
ATR値に基づいて,ロングストップとショートストップを計算する.価格がこの2つのラインを超えると取引シグナルを発する.
この戦略は,トレンドの方向を判断する"方向"の変数も導入しています.
            mylang

            direction = 1
direction := nz(direction[1], direction)
direction := direction == -1 and close > shortStopPrev ? 1 : direction == 1 and close < longStopPrev ? -1 : direction
方向が1なら多頭傾向にある,方向が-1なら空頭傾向にある.
方向変数の値に応じて,異なる色のストップラインが描かれます.
            mylang

            if (direction == 1)
    valueToPlot := longStop
    colorToPlot := color.green
else
    valueToPlot := shortStop
    colorToPlot := color.red
ストップラインの位置と現在のトレンドの方向をはっきり見ることができます.
ストップ・ロスの追跡
この戦略の重要な点は,価格の動きに応じてリアルタイムでストップラインを調整できるトラッキング・ストップメカニズムが導入されていることです.
具体的にはこうです
            mylang

            strategyPercentege = (close - updatedEntryPrice) / updatedEntryPrice * 100.00
rideUpStopLoss = hasOpenTrade() and strategyPercentege > 1

if (rideUpStopLoss)
    stopLossPercent := stopLossPercent + strategyPercentege - 1.0
    newStopLossPrice = updatedEntryPrice + (updatedEntryPrice * stopLossPercent) / 100
    stopLossPrice := max(stopLossPrice, newStopLossPrice)
    updatedEntryPrice := stopLossPrice
入場価格に対する価格上昇が1%以上である場合,上位にストップラインの調整を追跡する. 調整幅が1%以上である部分.
収益を最大限確保し,損失を最小限にする.
優位分析
従来の移動式ストップ戦略の最大の利点は,市場の状況に応じてストップラインを動的に調整できることです.具体的利点は以下の通りです.
-
トレンド状況でより高い利益のロックが実現できる
ストップトラッキングは,ストップラインを利益の方向に移動させることで,市場が強くなっていれば,利益がさらに高まるようにします.
-
金融危機の危機を緩和する
市場傾向が変化する時には,固定された移動止損線は簡単にスキップされます.この戦略の止損線は,市場の変動性に基づいて計算され,価格の変化を合理的に追跡することができ,収束時に止損がスキップされることを避けることができます.
-
操作が簡単で自動化が可能です
この戦略は,指数操作のみで,複雑なトレンド判断の論理がない. 自動取引は,非常に簡単に実現できます.
-
異なる品種に適用できるカスタマイズ可能なパラメータ
ATR周期,増幅係数,停止幅などのパラメータはカスタマイズされ,異なる品種パラメータに最適化され,戦略をより普遍的に適用することができる.
リスク分析
この戦略には多くの利点がありますが,以下のリスクに注意してください.
-
予想外なトレンドの転換点,追いつくリスク
この戦略は,トレンドが終了するかどうかを判断する論理を用いていない.
-
パラメータを正しく設定しない場合,損失を拡大する可能性があります.
ATR周期パラメータが短すぎると,ストップラインが過度に敏感になり,振動が頻繁に引き起こされる可能性があります.
-
複写の反射が停止する危険性がある
この戦略は,分型ポイントをストップ・スプレッド・ポイントとして考慮していない.したがって,ショートラインの反転時に市場から投げ出されることもあります.
このリスクに対して,以下の方法で最適化できます.
-
トレンドの逆転を予測するために,トレンドの波動指標を組み合わせる
-
パラメータ最適化テスト,最適のパラメータ組み合わせを選択
-
特定のサポートの近くで止損範囲を広げること
最適化の方向
この戦略はさらに改善できる余地があります.
-
K線形状と組み合わせた判断
トレンドの逆転の可能性は,背<unk>,射星などの典型的なK線形状を識別することによって判断できます.これは,高殺落を追うリスクを回避できます.
-
ダイナミック・トラッキングパラメータの最適化
ATR周期,増幅係数などのパラメータも動的に変化させることができ,大幅な波動性のある市場ではより長いATR周期とより宽松な止損範囲を使用する.
-
機械学習モデルを組み合わせた
LSTM,rnnなどのディープラーニングモデルを使用して,後期市場での価格区間を予測し,ストップロスを動的に調整します.
要約する
この戦略overallはATR指標を利用して移動ストップラインを設計し,トラッキングストップメカニズムを導入し,市場状況の変化に応じてストップポジションの移動をリアルタイムで調整することができる.これは,より高い利益ロックを実現すると同時に,リスクを低減させる.さらなる最適化により,この戦略は,市場のさまざまな状況により適応し,汎用性の強い取引戦略にすることができる.
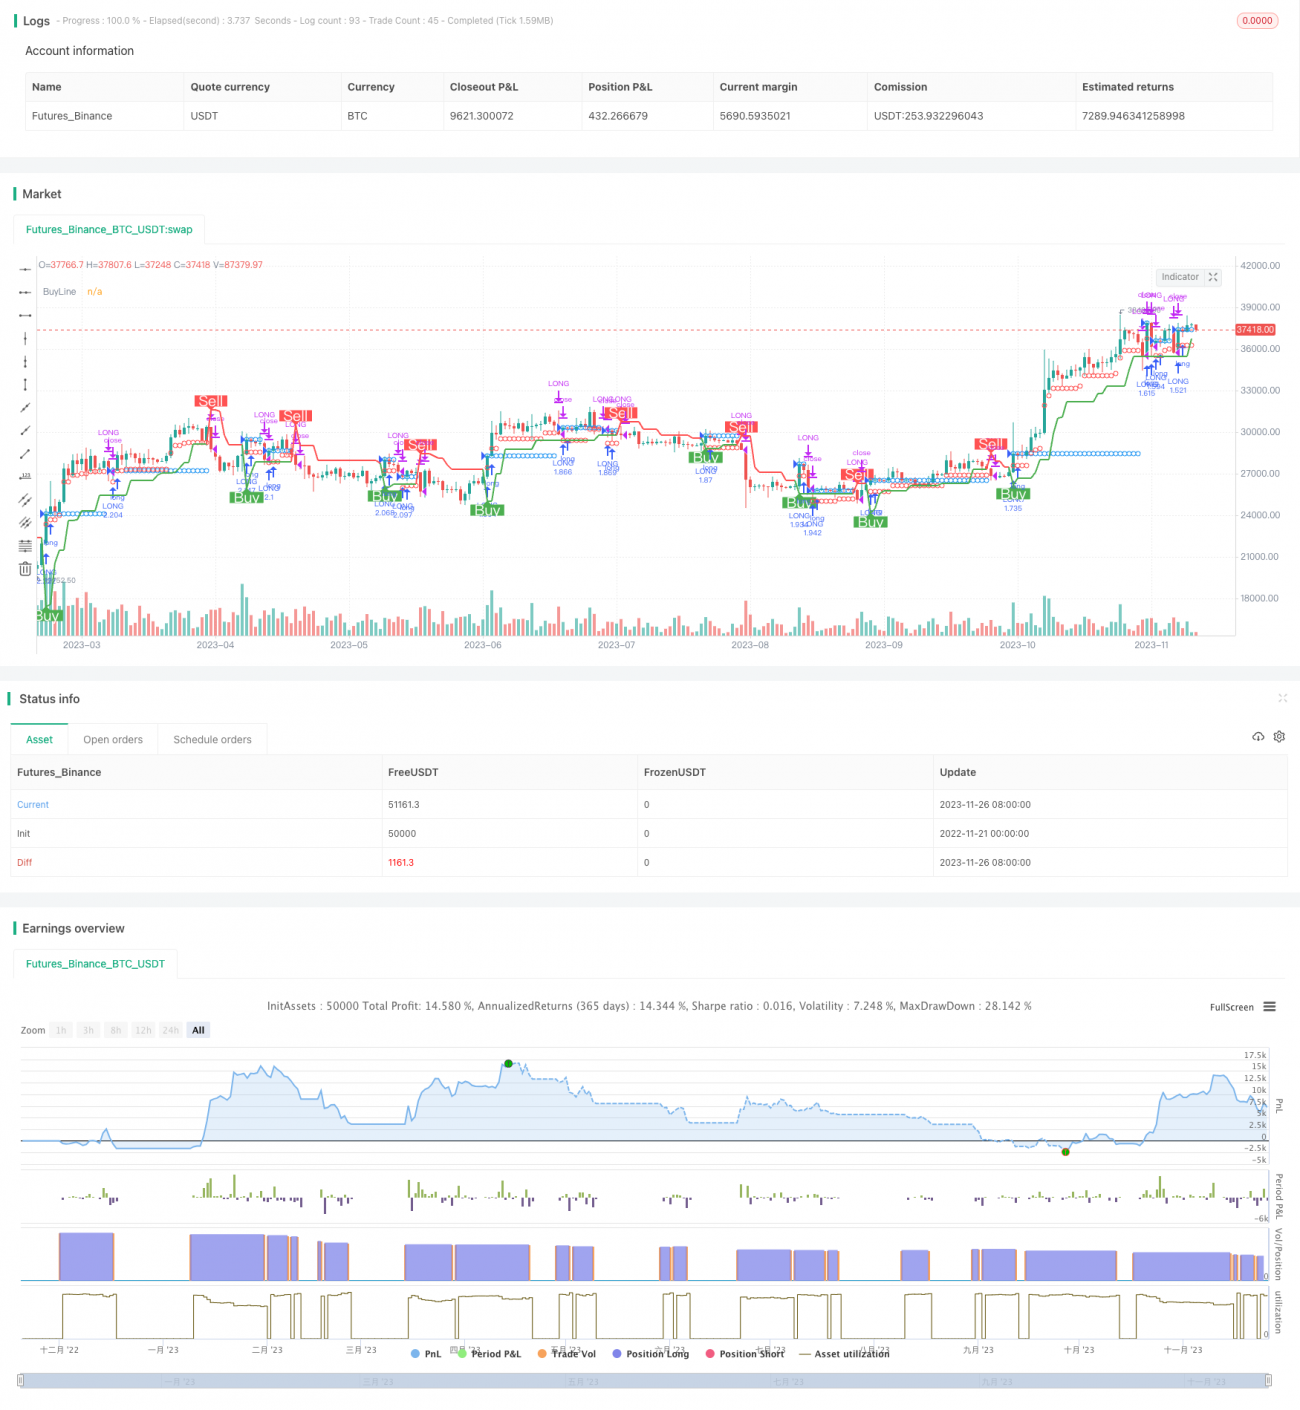
/*backtest
start: 2022-11-21 00:00:00
end: 2023-11-27 00:00:00
period: 1d
basePeriod: 1h
exchanges: [{"eid":"Futures_Binance","currency":"BTC_USDT"}]
*/

//@version=4
//
// ▒▒▒▒▒▒▒▒▒▒▒▒▒▒▒▒▒▒▒▒▒▒▒▒▒▒▒▒▒▒▒▒▒▒▒▒▒▒▒▒▒▒▒▒▒▒▒▒▒▒▒▒▒▒▒▒▒▒▒▒▒▒▒▒▒▒▒▒▒▒▒▒▒▒▒▒▒▒▒▒▒▒▒▒▒▒▒▒▒▒▒▒▒▒▒▒▒▒▒▒▒▒▒▒▒▒▒▒▒▒▒▒▒▒
// ------------------------------------------------------------------------------ 1