ダブル MA モメンタム ブレイクアウト戦略
概要
ダブルMA動量突破戦略は,ダブル移動平均とRSI指標を融合した量的な取引戦略である.この戦略は,急速移動平均,遅い移動平均とRSI指標を計算して,移動量指標RSIの超買超売り値を設定し,ダブルMAが金交差時に多出し,死交差時に空出し,市場の傾向的行動を捕捉する.
戦略原則
二重MAの動量突破策は,主に2つの移動平均とRSI指標に基づいています. まず,2つの移動平均をゆっくりと速く計算し,快線は10日重力移動平均,慢線は100日線形自在移動平均を計算します.それから14日RSI指標を計算し,超買超売の値を設定します.快線を横切るときは多頭走行と判断し,遅線を横切るときは空頭走行と判断します.多頭走行を判断する一方で,偽の突破を回避するために,RSI指標が超買線より高くまたは超売線より低くする必要があります.
具体的には,多頭行情であると判断されたとき,当時のRSI指標が超買線より高い場合,多頭開設が行われる.空頭行情であると判断されたとき,RSI指標が超売り線より低い場合,空頭開設が行われる.開設後,取引シグナルが反転したときに逆転開設が行われる.
戦略的優位性
双MA動量突破策は,双MAとRSIの指標を組み合わせて,市場トレンドを効果的に識別し,RSIの指標を偽の突破をフィルタリングして,取引信号の信頼性を向上させます.単一のMAシステムと比較して,この策は,無効取引の発生を大幅に減らすことができます.さらに,RSIの指標のパラメータの最適化は,戦略に柔軟性をもたらします.
戦略リスク
双MAの動量突破策にはある程度のリスクもあります.双MAシステムはパラメータに非常に敏感であり,異なる市場に対して慎重にパラメータの組み合わせをテストする必要があります.また,RSI指標の設定された値が不適切であれば,誤った取引機会を引き起こす可能性があります.最後に,激進的な移動ストップは,特定の状況下で突破され,フィードバックの結果に応じてストップを調整します.
戦略の最適化
双MA動量突破策は以下の点で最適化できる.
- 楽天的なMAのパラメータを最適化して,最適なパラメータの組み合わせを探します.
- RSIのパラメータを最適化し,超買超売の値を調整する.
- リスク管理のための自主的な移動式止損メカニズムを増やす.
- 倉庫開設量最適化モジュールを追加し,資金使用効率を向上させる.
要約する
双MA動量突破策は,双MAシステムによってトレンドの方向を判断し,RSI指標のフィルター信号を利用して,単MAシステムの欠点を効果的に改善することができる.この策のパラメータの最適化スペースは大きく,自律的な調整が可能であり,優れたトレンド追跡策である.
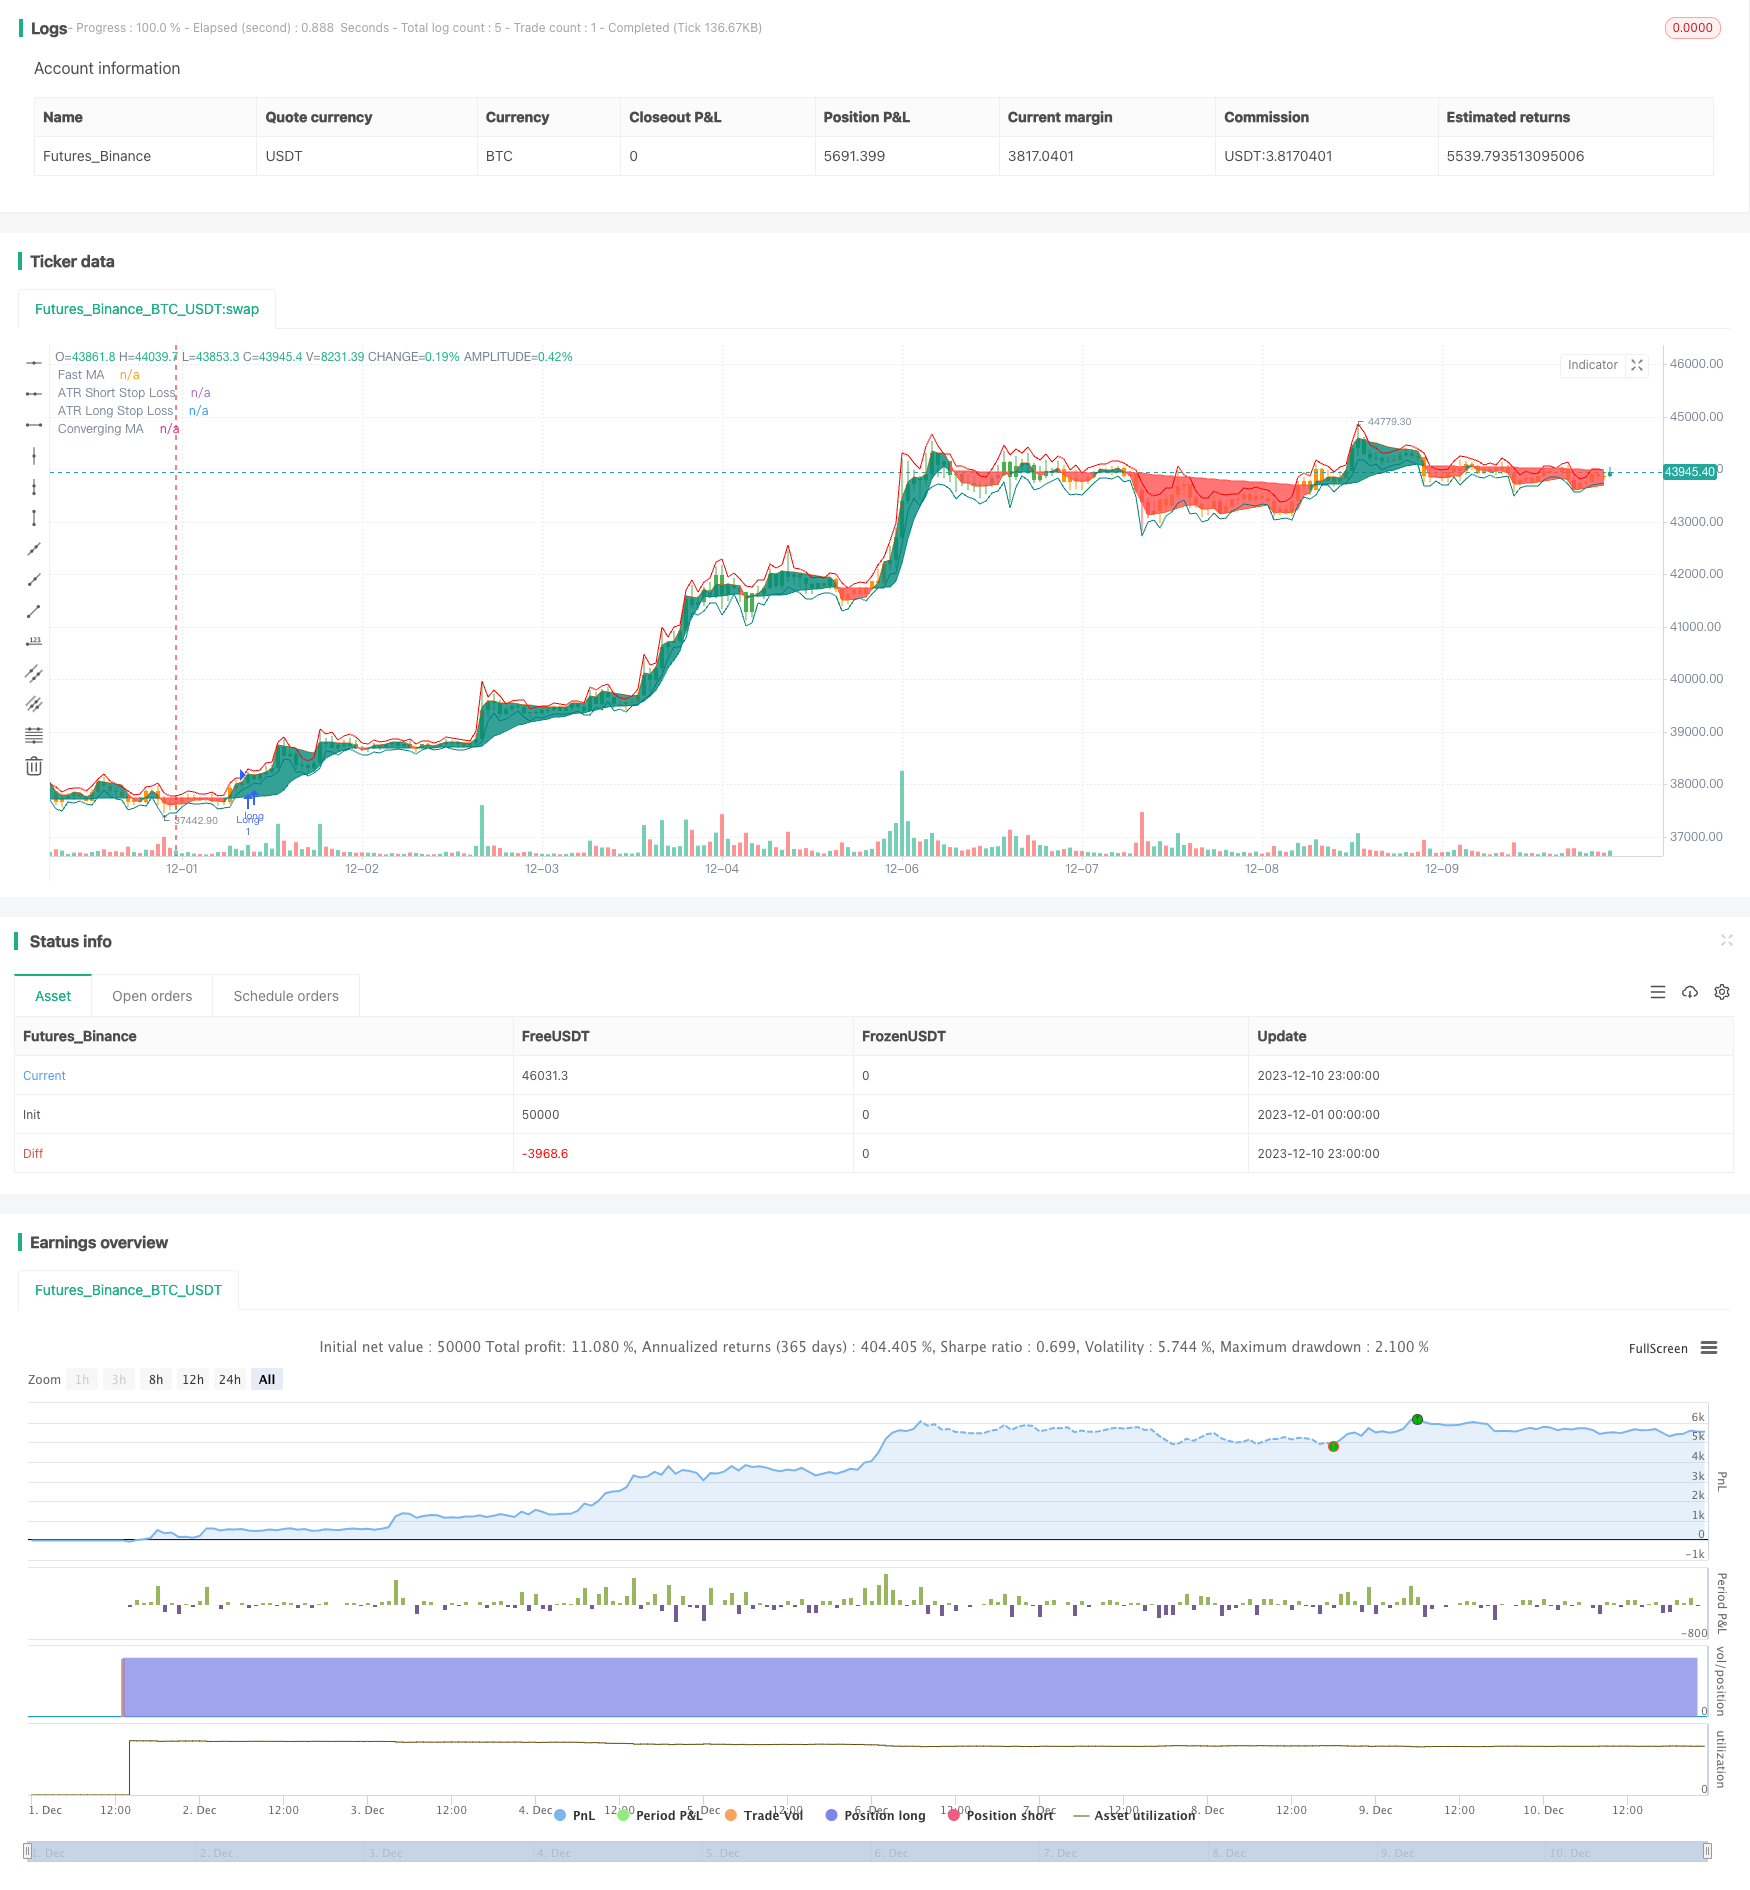
/*backtest
start: 2023-12-01 00:00:00
end: 2023-12-10 23:59:59
period: 1h
basePeriod: 15m
exchanges: [{"eid":"Futures_Binance","currency":"BTC_USDT"}]
*/

// This work is licensed under a Attribution-NonCommercial-ShareAlike 4.0 International (CC BY-NC-SA 4.0) https://creativecommons.org/licenses/by-nc-sa/4.0/
// © Salman4sgd

//@version=5
strategy("MAConverging + QQE Threshold Strategy", overlay = true)
//------------------------------------------------------------------------------
//Settings
//-----------------------------------------------------------------------------{
length = input(100)

incr   = input(10, "Increment")

fast   = input(10)

src    = input(close)

//-----------------------------------------------------------------------------}
//Calculations
//-----------------------------------------------------------------------------{
var ma    = 0.
var fma   = 0.
var alpha = 0.
var k     = 1 / incr

upper = ta.highest(length)
lower = ta.lowest(length)
init_ma = ta.sma(src, length)

cross = ta.cross(src,ma)

alpha := cross ? 2 / (length + 1)
  : src > ma and upper > upper[1] ? alpha + k
  : src < ma and lower < lower[1] ? alpha + k
  : alpha

ma := nz(ma[1] + alpha[1] * (src - ma[1]), init_ma)

fma := nz(cross ? math.avg(src, fma[1])
  : src > ma ? math.max(src, fma[1]) + (src - fma[1]) / fast
  : math.min(src, fma[1]) + (src - fma[1]) / fast,src)

//-----------------------------------------------------------------------------}
//Plots
//-----------------------------------------------------------------------------{
css = fma > ma ? color.teal : color.red

plot0 = plot(fma, "Fast MA"
  , color = #ff5d00
  , transp = 100)

plot1 = plot(ma, "Converging MA"
  , color = css)

fill(plot0, plot1, css
  , "Fill"
  , transp = 80)

//-----------------------------------------------------------------------------}

RSI_Period = input(14, title='RSI Length')
SF = input(5, title='RSI Smoothing')
QQE = input(4.238, title='Fast QQE Factor')
ThreshHold = input(10, title='Thresh-hold')
//
sQQEx = input(false, title='Show Smooth RSI, QQE Signal crosses')
sQQEz = input(false, title='Show Smooth RSI Zero crosses')
sQQEc = input(false, title='Show Smooth RSI Thresh Hold Channel Exits')
ma_type = input.string(title='MA Type', defval='EMA', options=['ALMA', 'EMA', 'DEMA', 'TEMA', 'WMA', 'VWMA', 'SMA', 'SMMA', 'HMA', 'LSMA', 'PEMA'])
lsma_offset = input.int(defval=0, title='* Least Squares (LSMA) Only - Offset Value', minval=0)
alma_offset = input.float(defval=0.85, title='* Arnaud Legoux (ALMA) Only - Offset Value', minval=0, step=0.01)
alma_sigma = input.int(defval=6, title='* Arnaud Legoux (ALMA) Only - Sigma Value', minval=0)
inpDrawBars = input(true, title='color bars?')


ma(type, src, len) =>
    float result = 0
    if type == 'SMA'  // Simple
        result := ta.sma(src, len)
        result
    if type == 'EMA'  // Exponential
        result := ta.ema(src, len)
        result
    if type == 'DEMA'  // Double Exponential
        e = ta.ema(src, len)
        result := 2 * e - ta.ema(e, len)
        result
    if type == 'TEMA'  // Triple Exponential
        e = ta.ema(src, len)
        result := 3 * (e - ta.ema(e, len)) + ta.ema(ta.ema(e, len), len)
        result
    if type == 'WMA'  // Weighted
        result := ta.wma(src, len)
        result
    if type == 'VWMA'  // Volume Weighted
        result := ta.vwma(src, len)
        result
    if type == 'SMMA'  // Smoothed
        w = ta.wma(src, len)
        result := na(w[1]) ? ta.sma(src, len) : (w[1] * (len - 1) + src) / len
        result
    if type == 'HMA'  // Hull
        result := ta.wma(2 * ta.wma(src, len / 2) - ta.wma(src, len), math.round(math.sqrt(len)))
        result
    if type == 'LSMA'  // Least Squares
        result := ta.linreg(src, len, lsma_offset)
        result
    if type == 'ALMA'  // Arnaud Legoux
        result := ta.alma(src, len, alma_offset, alma_sigma)
        result
    if type == 'PEMA'
        // Copyright (c) 2010-present, Bruno Pio
        // Copyright (c) 2019-present, Alex Orekhov (everget)
        // Pentuple Exponential Moving Average script may be freely distributed under the MIT license.
        ema1 = ta.ema(src, len)
        ema2 = ta.ema(ema1, len)
        ema3 = ta.ema(ema2, len)
        ema4 = ta.ema(ema3, len)
        ema5 = ta.ema(ema4, len)
        ema6 = ta.ema(ema5, len)
        ema7 = ta.ema(ema6, len)
        ema8 = ta.ema(ema7, len)
        pema = 8 * ema1 - 28 * ema2 + 56 * ema3 - 70 * ema4 + 56 * ema5 - 28 * ema6 + 8 * ema7 - ema8
        result := pema
        result
    result

src := input(close, title='RSI Source')
//

//
Wilders_Period = RSI_Period * 2 - 1


Rsi = ta.rsi(src, RSI_Period)
RsiMa = ma(ma_type, Rsi, SF)
AtrRsi = math.abs(RsiMa[1] - RsiMa)
MaAtrRsi = ma(ma_type, AtrRsi, Wilders_Period)
dar = ma(ma_type, MaAtrRsi, Wilders_Period) * QQE

longband = 0.0
shortband = 0.0
trend = 0

DeltaFastAtrRsi = dar
RSIndex = RsiMa
newshortband = RSIndex + DeltaFastAtrRsi
newlongband = RSIndex - DeltaFastAtrRsi
longband := RSIndex[1] > longband[1] and RSIndex > longband[1] ? math.max(longband[1], newlongband) : newlongband
shortband := RSIndex[1] < shortband[1] and RSIndex < shortband[1] ? math.min(shortband[1], newshortband) : newshortband
cross_1 = ta.cross(longband[1], RSIndex)
trend := ta.cross(RSIndex, shortband[1]) ? 1 : cross_1 ? -1 : nz(trend[1], 1)
FastAtrRsiTL = trend == 1 ? longband : shortband

//
// Find all the QQE Crosses
QQExlong = 0
QQExlong := nz(QQExlong[1])
QQExshort = 0
QQExshort := nz(QQExshort[1])
QQExlong := sQQEx and FastAtrRsiTL < RSIndex ? QQExlong + 1 : 0
QQExshort := sQQEx and FastAtrRsiTL > RSIndex ? QQExshort + 1 : 0
// Zero cross
QQEzlong = 0
QQEzlong := nz(QQEzlong[1])
QQEzshort = 0
QQEzshort := nz(QQEzshort[1])
QQEzlong := sQQEz and RSIndex >= 50 ? QQEzlong + 1 : 0
QQEzshort := sQQEz and RSIndex < 50 ? QQEzshort + 1 : 0
//
// Thresh Hold channel Crosses give the BUY/SELL alerts.
QQEclong = 0
QQEclong := nz(QQEclong[1])
QQEcshort = 0
QQEcshort := nz(QQEcshort[1])
QQEclong := sQQEc and RSIndex > 50 + ThreshHold ? QQEclong + 1 : 0
QQEcshort := sQQEc and RSIndex < 50 - ThreshHold ? QQEcshort + 1 : 0


// // QQE exit from Thresh Hold Channel
// plotshape(sQQEc and QQEclong == 1 ? RsiMa - 50 : na, title='QQE XC Over Channel', style=shape.diamond, location=location.absolute, color=color.new(color.olive, 0), size=size.small, offset=0)
// plotshape(sQQEc and QQEcshort == 1 ? RsiMa - 50 : na, title='QQE XC Under Channel', style=shape.diamond, location=location.absolute, color=color.new(color.red, 0), size=size.small, offset=0)
// // QQE crosses
// plotshape(sQQEx and QQExlong == 1 ? FastAtrRsiTL[1] - 50 : na, title='QQE XQ Cross Over', style=shape.circle, location=location.absolute, color=color.new(color.lime, 0), size=size.small, offset=-1)
// plotshape(sQQEx and QQExshort == 1 ? FastAtrRsiTL[1] - 50 : na, title='QQE XQ Cross Under', style=shape.circle, location=location.absolute, color=color.new(color.blue, 0), size=size.small, offset=-1)
// // Signal crosses zero line
// plotshape(sQQEz and QQEzlong == 1 ? RsiMa - 50 : na, title='QQE XZ Zero Cross Over', style=shape.square, location=location.absolute, color=color.new(color.aqua, 0), size=size.small, offset=0)
// plotshape(sQQEz and QQEzshort == 1 ? RsiMa - 50 : na, title='QQE XZ Zero Cross Under', style=shape.square, location=location.absolute, color=color.new(color.fuchsia, 0), size=size.small, offset=0)

// hcolor = RsiMa - 50 > ThreshHold ? color.green : RsiMa - 50 < 0 - ThreshHold ? color.red : color.orange
// plot(FastAtrRsiTL - 50, color=color.new(color.blue, 0), linewidth=2)
// p1 = plot(RsiMa - 50, color=color.new(color.orange, 0), linewidth=2)
// plot(RsiMa - 50, color=hcolor, style=plot.style_columns, transp=50)


// hZero = hline(0, color=color.black, linestyle=hline.style_dashed, linewidth=1)
// hUpper = hline(ThreshHold, color=color.green, linestyle=hline.style_dashed, linewidth=2)
// hLower = hline(0 - ThreshHold, color=color.red, linestyle=hline.style_dashed, linewidth=2)
// fill(hUpper, hLower, color=color.new(color.gray, 80))
//EOF

length := input.int(title='ATR Length', defval=14, minval=1)
smoothing = input.string(title='ATR Smoothing', defval='RMA', options=['RMA', 'SMA', 'EMA', 'WMA'])
m = input(0.3, 'ATR Multiplier')
src1 = input(high)
src2 = input(low)
pline = input(true, 'Show Price Lines')
col1 = input(color.blue, 'ATR Text Color')
col2 = input.color(color.teal, 'Low Text Color', inline='1')
col3 = input.color(color.red, 'High Text Color', inline='2')

collong = input.color(color.teal, 'Low Line Color', inline='1')
colshort = input.color(color.red, 'High Line Color', inline='2')

ma_function(source, length) =>
    if smoothing == 'RMA'
        ta.rma(source, length)
    else
        if smoothing == 'SMA'
            ta.sma(source, length)
        else
            if smoothing == 'EMA'
                ta.ema(source, length)
            else
                ta.wma(source, length)

a = ma_function(ta.tr(true), length) * m
s_sl = ma_function(ta.tr(true), length) * m + src1
l_sl = src2 - ma_function(ta.tr(true), length) * m

p1 = plot(s_sl, title='ATR Short Stop Loss', color=colshort, trackprice=pline ? true : false, transp=20)
p2 = plot(l_sl, title='ATR Long Stop Loss', color=collong, trackprice=pline ? true : false, transp=20)


bgc = RsiMa - 50 > ThreshHold ? color.green : Rsi - 50 < 0 - ThreshHold ? color.red : color.orange
barcolor(inpDrawBars ? bgc : na)
prebuy = RsiMa - 50 > ThreshHold
buy=prebuy and not(prebuy[1]) and fma > ma

var long_tp=0.0
var long_sl=0.0
var short_tp=0.0
var short_sl=0.0

if prebuy
    strategy.close("Short")


if buy and strategy.position_size<=0
    strategy.entry("Long", strategy.long)
    long_sl:=l_sl
    long_tp:=close+(close-long_sl)*2


//if strategy.position_size>0
strategy.exit("L_SL","Long",stop=long_sl)
    //strategy.exit("L_SL","Long",stop=long_sl)
// if low<long_sl[1]
//     strategy.close("Long")

presell=RsiMa - 50 < 0 - ThreshHold // RsiMa - 50 < 0 - ThreshHold
sell= presell and not(presell[1]) and fma < ma

//plotshape(presell)

if presell
    strategy.close("Long")

if sell and strategy.position_size>=0
    strategy.entry("Short", strategy.short)
    short_sl:=s_sl
    short_tp:=close-(short_sl-close)*2

//if strategy.position_size<0
strategy.exit("S_SL","Short",stop=short_sl)
    //strategy.exit("S_SL","Short",stop=short_sl)