8
Follow
1370
Followers
Source
Python
# Python 2/3 兼容版本
import time
chart = None
series = []
labelIdx = {}
preBarTime = 0
preFlagTime = 0
preDotTime = {}

cfg = {
    "tooltip" : {
        "xDateFormat" : "%Y-%m-%d %H:%M:%S, %A"
    },
    "legend" : {
        "enabled" : True
    },
    "plotOptions" : {
        "candlestick" : {
            "color" : "#d75442",
            "upColor" : "#6ba583"
        }
    },
    "rangeSelector" : {
        "buttons" : [{
            "type" : "hour",
            "count" : 1,
            "text" : "1h",
        }, {
            "type" : 'hour',
            "count" : 3,
            "text" : "3h"
        }, {
            "type" : "hour",
            "count" : 8,
            "text" : "8h"
        }, {
            "type" : "all",
            "text" : "All"
        }],
        "selected" : 2,
        "inputEnabled" : True
    },
    "series" : series,
}

def GetCfg():
    global cfg
    return cfg

# 画水平线
def PlotHLine(value = None, label = None, color = None, style = None):
    global cfg, chart
    if ("yAxis" in cfg) == False :
        cfg.setdefault("yAxis", {"plotLines" : []})
    elif ("plotLines" in cfg["yAxis"]) == False :
        cfg["yAxis"].setdefault("plotLines", [])

    obj = {
        "value" : value,
        "color" : color or "red",
        "width" : 2,
        "dashStyle" : style or "Solid",
        "label" : {
            "text" : label or "",
            "align" : "center"
        }
    }
    found = False
    for i in range(len(cfg["yAxis"]["plotLines"])) :
        if cfg["yAxis"]["plotLines"][i]["label"]["text"] == label :
            cfg["yAxis"]["plotLines"][i] = obj
            found = True
    if not found :
        cfg["yAxis"]["plotLines"].append(obj)
    if not chart :
        chart = Chart(cfg)
        chart.update(cfg)    # 更新图表
    else :
        chart.update(cfg)

# 画K线
def PlotRecords(records, title = None):
    global labelIdx, series, preBarTime, chart
    if not chart :
        chart = Chart(cfg)
        chart.reset()
    if ("candlestick" in labelIdx) == False :
        cfg["__isStock"] = True
        seriesIdx = len(series)
        series.append({
            "type" : "candlestick",
            "name" : "" if title == None else title,
            "id" : "primary",
            "data" : []
            })
        chart.update(cfg)
        labelIdx.setdefault("candlestick", seriesIdx)
    else :
        seriesIdx = labelIdx["candlestick"]
    if isinstance(records, dict) and ("Time" in records) == True :
        Bar = records
        if Bar["Time"] == preBarTime :
            chart.add(seriesIdx, [Bar["Time"], Bar["Open"], Bar["High"], Bar["Low"], Bar["Close"]], -1)
        elif Bar["Time"] > preBarTime :
            preBarTime = Bar.Time
            chart.add(seriesIdx, [Bar["Time"], Bar["Open"], Bar["High"], Bar["Low"], Bar["Close"]])
    else :
        for i in range(len(records)) :
            if records[i]["Time"] == preBarTime :
                chart.add(seriesIdx, [records[i]["Time"], records[i]["Open"], records[i]["High"], records[i]["Low"], records[i]["Close"]], -1)
            elif records[i]["Time"] > preBarTime :
                preBarTime = records[i]["Time"]
                chart.add(seriesIdx, [records[i]["Time"], records[i]["Open"], records[i]["High"], records[i]["Low"], records[i]["Close"]])
    return chart

# 画指标线
def PlotLine(label, dot, Ntime = None):
    global labelIdx, chart, series, preDotTime
    if not chart :
        cfg.setdefault("xAxis", {
            "type" : "datetime"
            })
        chart = Chart(cfg)
        chart.reset()
    if (label in labelIdx) == False :
        seriesIdx = len(series)
        preDotTime.setdefault(str(seriesIdx), 0)
        labelIdx[label] = seriesIdx
        series.append({
            "type" : "line",
            "yAxis" : 0,
            "showInLegend" : True,
            "name" : label,
            "data" : [],
            "tooltip" : {"valueDecimals" : 5}
            })
        chart.update(cfg)
    else :
        seriesIdx = labelIdx[label]
    if Ntime == None :
        Ntime = _N(time.time() * 1000, 0)
    if preDotTime[str(seriesIdx)] != Ntime :
        preDotTime[str(seriesIdx)] = Ntime
        chart.add(seriesIdx, [Ntime, dot])
    else :
        chart.add(seriesIdx, [Ntime, dot], -1)
    return chart

# 画标记
def PlotFlag(time, text, title, shape = "", color = ""):
    global chart, cfg, labelIdx, preFlagTime
    if not chart :
        chart = Chart(cfg)
        chart.reset()
    label = "flag"
    if (label in labelIdx) == False :
        seriesIdx = len(series)
        labelIdx[label] = seriesIdx
        series.append({
            "type" : "flags",
            "onSeries" : "primary",
            "data" : []
            })
        chart.update(cfg)
    else :
        seriesIdx = labelIdx[label]
    obj = {
        "x" : time,
        "color" : color,
        "shape" : shape,
        "title" : title,
        "text" : text
    }
    if preFlagTime != time :
        preFlagTime = time
        chart.add(seriesIdx, obj)
    else :
        chart.add(seriesIdx, obj, -1)
    return chart

# 设置图表标题
def PlotTitle(title, chartTitle = None):
    global cfg
    if ("subtitle" in cfg) == True :
        cfg["subtitle"] = {"text" : title}
    else :
        cfg.setdefault("subtitle", {"text" : title})
    if chartTitle != None :
        if (title in cfg) == True :
            cfg["title"] = {"text" : chartTitle}
        else :
            cfg.setdefault("title", {"text" : chartTitle})
    if chart :
        chart.update(cfg)

# 导出函数
ext.GetCfg = GetCfg
ext.PlotHLine = PlotHLine
ext.PlotRecords = PlotRecords
ext.PlotLine = PlotLine
ext.PlotFlag = PlotFlag
ext.PlotTitle = PlotTitle

# 测试代码
def main():
    isFirst = True
    while True:
        records = exchange.GetRecords()
        if records and len(records) > 0 :
            ext.PlotRecords(records, "BTC")
            if isFirst :
                ext.PlotFlag(records[-1]["Time"], "Start", "S")
                isFirst = False
                ext.PlotHLine(records[-1]["Close"], "Close")
        ticker = exchange.GetTicker()
        if ticker :
            ext.PlotLine("Last", ticker.Last)
            ext.PlotLine("buy", ticker.Buy + 10)
            ext.PlotTitle("Last" + str(ticker.Last))
        Sleep(60000)
Related strategies
Comment
All comments (14)


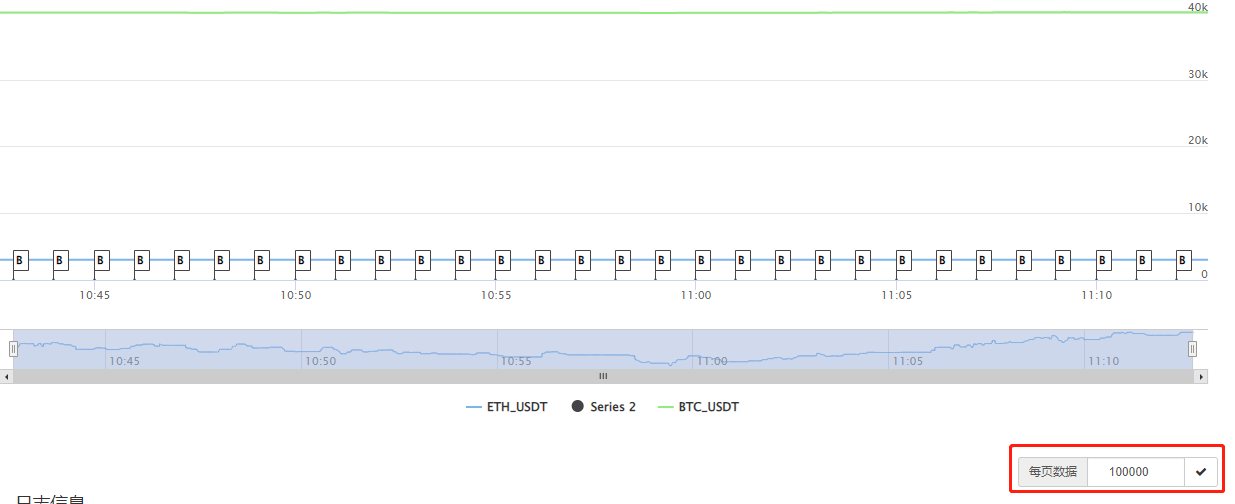
上图您标记的这个只是FMZ页面上,每个分页显示的数据数量,一个图表如果有10万条数据,你这里设置每个分页显示10000条,这10万条数据就会分开10页显示。这个设置和你的代码设计无关。只是 FMZ页面显示的控制而已。
4 years ago


可以找你定制一个走势图吗?把几条k线集合到一个图标上;例如:btc价格线+ltc价格线+eth价格线+多币种综合价格线等,就几条线都在一个图上,就跟k线图上的几条均价线一样,都显示在同一个图上
8 years ago

- 1