개요: 이 전략의 순차적 돌파 깃발 모형은 유명한 초 트렌드 지표와 교묘하게 결합되어 독특한 깃발 형식 식별 방법을 실현합니다. 그것은 전통적인 깃발 모양을 발견 할뿐만 아니라 트렌드 방향과 잠재적인 중단 위치를 판단하는 초 트렌드 지표를 사용할 수 있습니다.
전략적 원칙:
- 깃발 형식 식별
- 동적으로 최고 가격과 최저 가격을 추적하여 플래그 모서리와 정리 구역을 식별합니다.
- 사용자가 설정한 파라미터를 기준으로 정리 영역의 깊이 / 상승, 플래그 모양 길이가 요구 사항에 부합하는지 판단
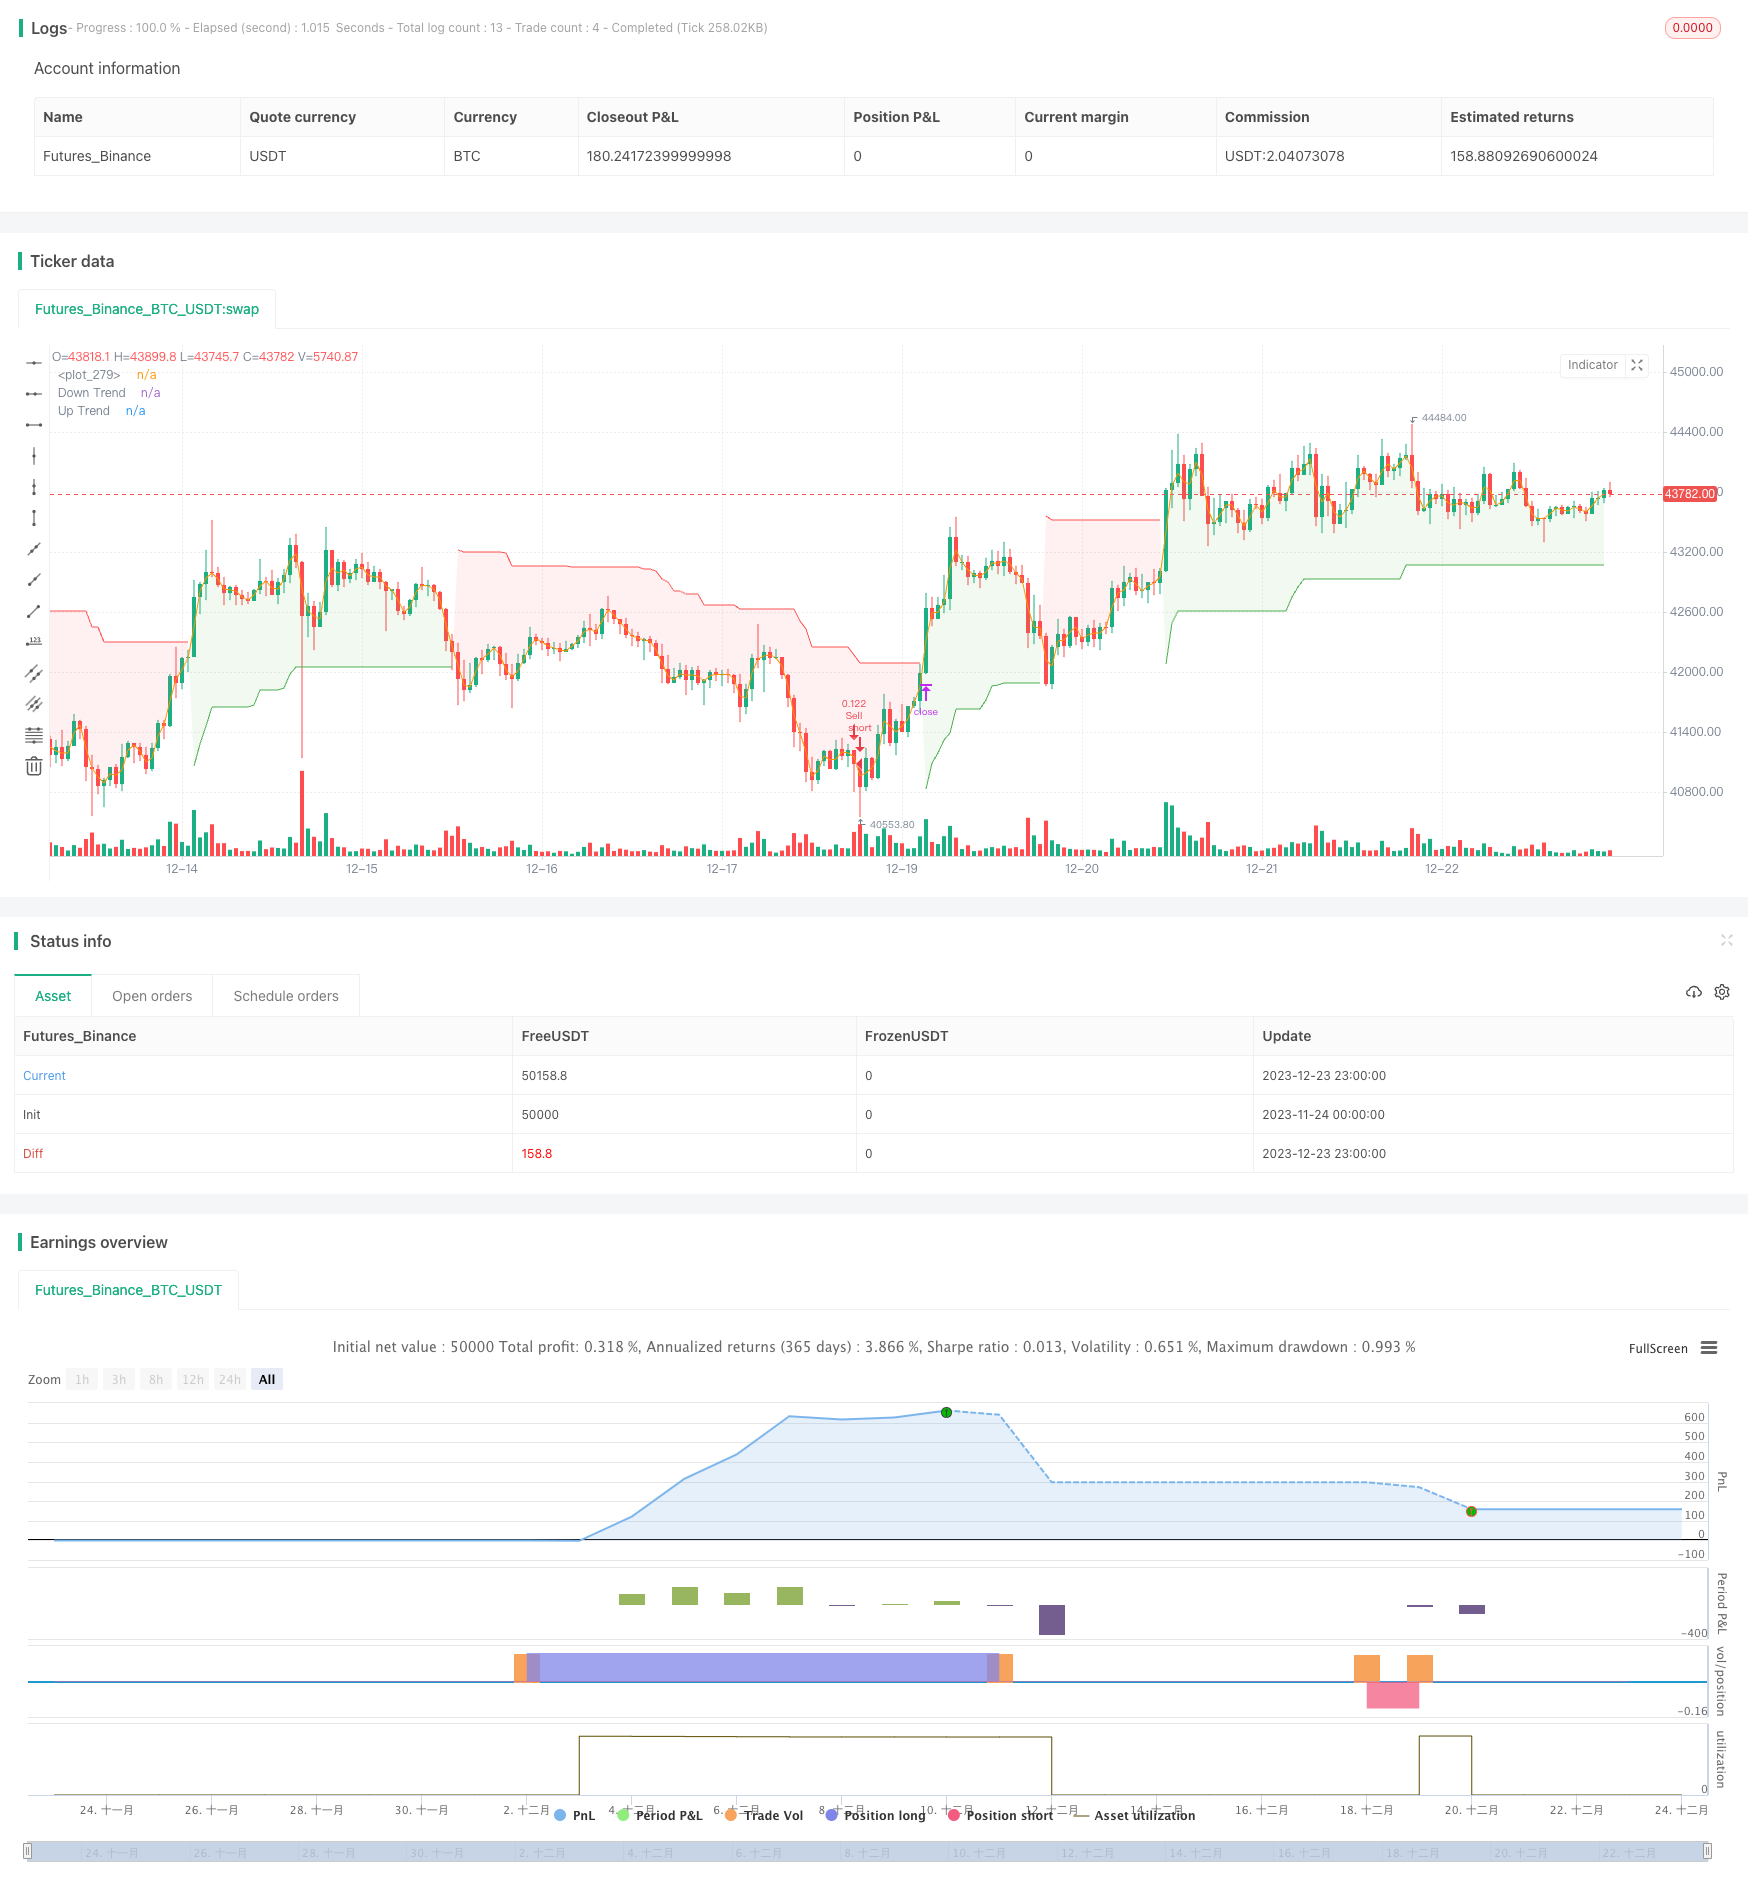
- 깃발 모양이 형성되면, 해당 색의 줄무늬로 표시합니다.
- 초트렌드 통합
- 간단하고 효과적인 트렌드 지표를 사용하여 실시간으로 차트에 트렌드 움직임을 표시합니다.
- 깃발 모양의 방향 판단과 함께 깃발 모양의 방향의 정확성을 확인할 수 있습니다.
- 동시에 초트렌드 라인은 거래에 잠재적인 스톱로스를 제공합니다.
종합적으로, 이 깃발 모양은 초 트렌드의 Zero-Lag과 통합되어, 사용하기 쉬운 트렌드 추적 전략을 구현합니다. 깃발 모양 인식과 초 트렌드 중지 손실이 완벽하게 결합되어 있습니다.
전략적 장점:
전통적 기술 분석과 트렌드 추적을 통합하는 방법 이 플래그와 초 트렌드의 통합은 그래픽 인식과 동력 추적을 결합하여 독특한 혼합 전략입니다.
잠재적인 스톱 포지션을 제공합니다. 트렌더는 거래마다 명확한 스톱로스 위치를 제공하여 전략의 위험 관리를 돕는다.
사용 편리함 이 전략은 사용자가 자신의 거래 취향에 따라 사용자 정의 할 수있는 일련의 조정 가능한 매개 변수를 제공합니다.
다중방향 거래에 대한 전면적인 지원 이 전략은 시가 상승과 하락을 동시에 지원하며, 모든 시장 환경에 적용되며, 매우 포괄적입니다.
전략적 위험:
깃발이 망가졌어요. 플래그 모양이 설정된 파라미터를 초과하거나 원래의 트렌드 방향으로 확장되면 플래그 모양이 손상되어 잘못된 신호가 발생합니다.
트렌드 지연의 전환점을 식별하는 방법 초 트렌드 라인에는 어느 정도의 지연성이 존재하며, 트렌드 전환점에 큰 슬라이드 포인트가 발생할 수 있다.
변수 최적화 다양한 파라미터 설정은 전략 성능에 큰 영향을 미치며, 최적화를 통해 최적의 파라미터 조합을 찾는 것이 필요합니다.
거래 방향 편향 단방 거래만 선택하면 전략의 적용 범위를 제한한다. 쌍방 거래가 권장된다.
전략적 최적화 방향:
- 다른 트렌드 변수 조합을 테스트하여 최적의 변수를 찾습니다.
- 플래그 형식의 변수를 최적화하여 플래그 형식을 더 정확하고 신뢰할 수 있도록 합니다.
- 다른 지표들, 예를 들어 평균, K-선 모델과 같은 것들과 결합해서 더 풍요로운 전략을 시도하세요.
- 손실을 막는 전략, 포지션 관리 등의 모듈을 추가하여 전략의 안정성을 높인다.
결론: 이 초 트렌드 강화 깃발 형식 인식 전략은 독특한 깃발 형식과 초 트렌드의 혼합 트렌드 전략이다. 이 전략은 그래픽 인식의 선도성과 초 트렌드 동력을 따르는 시간 효율성을 겸비하여 전통적인 기술 분석과 디지털 수치화의 완벽한 결합을 구현한다. 사용하기 쉬운 설정은 다양한 거래 유형에 널리 적용될 수 있으며, 조정 가능한 파라미터는 거래자가 자신의 선호에 따라 개인화 할 수 있도록 한다.
/*backtest
start: 2023-11-24 00:00:00
end: 2023-12-24 00:00:00
period: 1h
basePeriod: 15m
exchanges: [{"eid":"Futures_Binance","currency":"BTC_USDT"}]
*/

// This source code is subject to the terms of the Mozilla Public License 2.0 at https://mozilla.org/MPL/2.0/
// © Amphibiantrading

//@version=5
strategy("TrendGuard Flag Finder - Strategy [presentTrading]", overlay = true, precision=3, default_qty_type=strategy.cash,
 commission_value= 0.1, commission_type=strategy.commission.percent, slippage= 1,
  currency=currency.USD, default_qty_type = strategy.percent_of_equity, default_qty_value = 10, initial_capital= 10000)

//inputs
//user controlled settings for the indicator, separated into 4 different groups

// Add a button to choose the trading direction
tradingDirection = input.string("Both","Trading Direction", options=["Long", "Short", "Both"])

// Supertrend parameters
SupertrendPeriod = input(10, "Supertrend Length",group ='SuperTrend Criteria')
SupertrendFactor = input.float(4.0, "Supertrend Factor", step = 0.01,group ='SuperTrend Criteria')

// Flag parameters
var g1 = 'Bull Flag Criteria'

max_depth = input.float(5, 'Max Flag Depth', step = .25, minval = 2.0, group = g1, tooltip = 'Maximum pullback allowed from flag high to flag low')
max_flag = input.int(7, 'Max Flag Length', group = g1, tooltip = 'The maximum number of bars the flag can last')
min_flag = input.int(3, 'Min Flag Length', group = g1, tooltip = 'The minimum number of bars required for the flag')
poleMin = input.float(3.0, 'Prior Uptrend Minimum', group = g1, tooltip = 'The minimum percentage gain required before a flag forms')
poleMaxLen = input.int(13, 'Max Flag Pole Length', minval = 1, group = g1, tooltip = 'The maximum number of bars the flagpole can be')
poleMinLen = input.int(7, 'Min Flag Pole Length', minval = 1, group = g1, tooltip = 'The minimum number of bars required for the flag pole')

var g2 = 'Bear Flag Criteria'

max_rally = input.float(5, 'Max Flag Rally', step = .25, minval = 2.0, group = g2, tooltip = 'Maximum rally allowed from flag low to flag low')
max_flagBear = input.int(7, 'Max Flag Length', group = g2, tooltip = 'The maximum number of bars the flag can last')
min_flagBear = input.int(3, 'Min Flag Length', group = g2, tooltip = 'The minimum number of bars required for the flag')
poleMinBear = input.float(3.0, 'Prior Downtrend Minimum', group = g2, tooltip = 'The minimum percentage loss required before a flag forms')
poleMaxLenBear = input.int(13, 'Max Flag Pole Length', minval = 1, group = g2, tooltip = 'The maximum number of bars the flagpole can be')
poleMinLenBear = input.int(7, 'Min Flag Pole Length', minval = 1, group = g2, tooltip = 'The minimum number of bars required for the flag pole')

var g3 = 'Bull Flag Display Options'

showF = input.bool(true, 'Show Bull Flags', group = g3)
showBO = input.bool(true,'Show Bull Flag Breakouts', group = g3)
lineColor = input.color(color.green, 'Bull Line Color', group = g3)
lineWidth = input.int(2, 'Bull Line Width', minval = 1, maxval = 5, group = g3)

var g4 = 'Bear Flag Display Options'

showBF = input.bool(true, 'Show Bear Flags', group = g4)
showBD = input.bool(true,'Show Bear Flag Breakdowns', group = g4)
lineColorBear = input.color(color.red, 'Bear Flag Line Color', group = g4)
lineWidthBear = input.int(2, 'Bear Flag Line Width', minval = 1, maxval = 5, group = g4)


//variables
//declare starting variables used for identfying flags
var baseHigh = high, var startIndex = 0, var flagLength = 0, var baseLow = low
var lowIndex = 0, var flagBool = false, var poleLow = 0.0, var poleLowIndex = 0
var line flagHLine = na, var line flagLLine = na, var line flagPLine = na

// bear flag variables
var flagLowBear = high, var startIndexBear = 0, var flagLengthBear = 0, var flagHigh = low
var highIndex = 0, var flagBoolBear = false, var poleHigh = 0.0, var polehighIndex = 0
var line flagBearHLine = na, var line flagBearLLine = na, var line flagBearPLine = na

//find bull flag highs
// check to see if the current bars price is higher than the previous base high or na and then sets the variables needed for flag detection
if high > baseHigh or na(baseHigh)
    baseHigh := high
    startIndex := bar_index
    flagLength := 0
    baseLow := low
    lowIndex := bar_index
// check to see if the low of the current bar is lower than the base low, if it is set the base low to the low
if high <= baseHigh and low < baseLow
    baseLow := low
    lowIndex := bar_index
// moves the base low from the base high bar_index to prevent the high and low being the same bar
if high <= baseHigh and lowIndex == startIndex
    baseLow := low
    lowIndex := bar_index

//find bear flag lows
// check to see if the current bars price is lower than the previous flag low or na and then sets the variables needed for flag detection
if low < flagLowBear or na(flagLowBear)
    flagLowBear := low
    startIndexBear := bar_index
    flagLengthBear := 0
    flagHigh := high
    highIndex := bar_index
// check to see if the high of the current bar is higher than the flag high, if it is set the flag high to the high
if low >= flagLowBear and high > flagHigh
    flagHigh := high
    highIndex := bar_index
// moves the flag high from the flag low bar_index to prevent the high and low being the same bar
if low >= flagLowBear and highIndex == startIndexBear
    flagHigh := high
    highIndex := bar_index

//calulations bullish
findDepth = math.abs(((baseLow / baseHigh) - 1) * 100)  //calculate the depth of the flag
poleDepth = ((baseHigh / poleLow)- 1) * 100 // calculate the low of the flag pole to the base high
lower_close = close < close[1] // defines a lower close

//calculations bearish
findRally = math.abs(((flagHigh / flagLowBear) - 1) * 100)   //calculate the rally of the flag
poleDepthBear = ((flagLowBear / poleHigh)- 1) * 100 // calculate the high of the flag pole to the low high
higher_close = close > close[1] // defines a higher close

//start the counters
// begins starting bars once a high is less than the flag high
if high < baseHigh and findDepth <= max_depth or (high == baseHigh and lower_close)
    flagLength += 1
else
    flagLength := 0

// begins starting bars once a low is higher than the flag low
if low > flagLowBear and findRally <= max_rally or (low == flagLowBear and higher_close)
    flagLengthBear += 1
else
    flagLengthBear := 0

// check for prior uptrend / downtrend to meet requirements
// loops through all the bars from the minimum pole length to the maximum pole length to check if the prior uptrend requirements are met and sets the variables to their new values
if high == baseHigh
    for i = poleMinLen to poleMaxLen
        if ((high / low[i]) - 1) * 100 >= poleMin
            flagBool := true
            poleLow := low[i]
            poleLowIndex := bar_index[i]
            break

// loops through all the bars from the minimum pole length to the maximum pole length to check if the prior downtrend requirements are met and sets the variables to their new values
if low == flagLowBear
    for i = poleMinLenBear to poleMaxLenBear
        if math.abs(((low / high[i]) - 1) * 100) >= poleMinBear
            flagBoolBear := true
            poleHigh := high[i]
            polehighIndex := bar_index[i]
            break


// reset variables if criteria for a flag is broken
// if the depth of the bull flag is greater than the maximum depth limit or the flag lasts longer than the maximum length everything is reset to beging looking for a new flag
if findDepth >= max_depth or flagLength > max_flag
    flagBool := false
    flagLength := 0
    baseHigh := na
    startIndex := na
    lowIndex := na
    baseLow := na

// if the rally of the bear flag is greater than the maximum rally limit or the flag lasts longer than the maximum length everything is reset to beging looking for a new flag
if findRally >= max_rally or flagLengthBear > max_flagBear
    flagBoolBear := false
    flagLengthBear := 0
    flagLowBear := na
    startIndexBear := na
    highIndex := na
    flagHigh := na

// reset the variables and begin looking for a new bull flag if price continues higher before the minimum flag length requirement is met
if high > baseHigh[1] and flagLength < min_flag
    baseHigh := high
    flagLength := 0
    startIndex := bar_index
    lowIndex := bar_index
    baseLow := low

// reset the variables and begin looking for a new bear flag if price continues lower before the minimum bear flag length requirement is met
if low < flagLowBear[1] and flagLengthBear < min_flagBear
    flagLowBear := low
    flagLengthBear := 0
    startIndexBear := bar_index
    highIndex := bar_index
    flagHigh := high


//define the flags
// if all requirements are met a bull flag is true, flagBool is true, flag length is less than maximum set length and more than miminum required. The prior run up also meets the requirements for length and price
flag = flagBool == true and flagLength < max_flag and findDepth < max_depth and flagLength >= min_flag and startIndex - poleLowIndex <= poleMaxLen

// if all requirements are met a bear flag is true, flagBoolBear is true, flag length is less than maximum set length and more than miminum required. The prior downtrend also meets the requirements for length and price
bearFlag = flagBoolBear == true and flagLengthBear < max_flagBear and findRally < max_rally and flagLengthBear >= min_flagBear and startIndexBear - polehighIndex <= poleMaxLen


//define flags, breakouts, breadowns
// a breakout is defined as the high going above the flag high and the length of the flag is greater than the minimum requirement. The flag boolean must also be true
breakout = high > baseHigh[1] and flagLength >= min_flag and flagBool == true
//a breakdown is defined as the depth of the flag being larger than user set parameter or the length of the flag exceeded the maximum flag length
breakdown = findDepth >= max_depth or flagLength > max_flag
// a separate variable to have breakouts only plot once using a plotshape
plotBO = flag[1] and high > baseHigh[1] and flagLength[1] >= min_flag and flagBool == true

// a bear flag breakout is defined as the low going below the flag low and the length of the flag is greater than the minimum requirement. The flag boolean must also be true
breakoutBear = low < flagLowBear[1] and flagLengthBear >= min_flagBear and flagBoolBear == true
//a breakdown is defined as the rally of the flag being larger than user set parameter or the length of the flag exceeded the maximum flag length
breakdownBear = findRally >= max_rally or flagLengthBear > max_flagBear
// a separate variable to have breakouts only plot once using a plotshape
plotBD = bearFlag[1] and low < flagLowBear[1] and flagLengthBear[1] >= min_flagBear and flagBoolBear == true

// // if a bul flag is detected and the user has bull flags selected from the settings menu draw it on the chart
// if flag and showF
//     //if a flag was detected on the previous bar, delete those lines and allow for new lines to be drawn
//     if flag[1]
//         line.delete(flagHLine[1]), line.delete(flagLLine[1]), line.delete(flagPLine[1])
//     //draw new lines
//     flagHLine := line.new(startIndex, baseHigh, bar_index, baseHigh, color=lineColor, width = lineWidth)
//     flagLLine := line.new(startIndex, baseLow, bar_index, baseLow, color=lineColor, width = lineWidth)
//     flagPLine := line.new(poleLowIndex +1, poleLow, startIndex , baseLow, color=lineColor, width = lineWidth)

// // if a bear flag is detected and the user has bear flags selected from the settings menu draw it on the chart
// if bearFlag and showBF
//     //if a bear flag was detected on the previous bar, delete those lines and allow for new lines to be drawn
//     if bearFlag[1]
//         line.delete(flagBearHLine[1]), line.delete(flagBearLLine[1]), line.delete(flagBearPLine[1])
//     //draw new lines
//     flagBearHLine := line.new(startIndexBear, flagHigh, bar_index, flagHigh, color=lineColorBear, width = lineWidthBear)
//     flagBearLLine := line.new(startIndexBear, flagLowBear, bar_index, flagLowBear, color=lineColorBear, width = lineWidthBear)
//     flagBearPLine := line.new(polehighIndex + 1, poleHigh, startIndexBear , flagHigh, color=lineColorBear, width = lineWidthBear)

//reset variables if a breakout occurs
if breakout // bull flag - high gets above flag high
    flagLength := 0
    baseHigh := high
    startIndex := bar_index
    lowIndex := bar_index
    baseLow := low

if breakoutBear // bear flag - low gets below flag low
    flagLengthBear := 0
    flagLowBear := low
    startIndexBear := bar_index
    highIndex := bar_index
    flagHigh := high

//reset the variables and highs from a failed bull flag. This allows stocks below previous highs to find new flags
highest = ta.highest(high, 10) // built in variable that finds the highest high lookingback the past 10 bars
if breakdown or flagLength == max_flag
    flagBool := false
    baseHigh := highest
    startIndex := bar_index
    lowIndex := bar_index
    baseLow := low

//reset the variables and lows from a failed bear flag. This allows stocks above previous lows to find new flags
lowest = ta.lowest(low, 10) // built in variable that finds the lowest low lookingback the past 10 bars
if breakdownBear or flagLengthBear == max_flagBear
    flagBoolBear := false
    flagLowBear := lowest
    startIndexBear := bar_index
    highIndex := bar_index
    flagHigh := high

// if a flag breakdowns remove the lines from the chart
// if (breakdown and flag[1])
//     line.delete(flagHLine)
//     line.delete(flagLLine)
//     line.delete(flagPLine)

// if (breakdownBear and bearFlag[1])
//     line.delete(flagBearHLine)
//     line.delete(flagBearLLine)
//     line.delete(flagBearPLine)

//plot breakouts
// use a plotshape to check if there is a breakout and the show breakout option is selected. If both requirements are met plot a shape at the breakout bar
plotshape(plotBO and showBO and showF, 'Breakout', shape.triangleup, location.belowbar, color.green)

// use a plotshape to check if there is a breakout and the show breakout option is selected. If both requirements are met plot a shape at the breakout bar
plotshape(plotBD and showBD and showBF, 'Breakout', shape.triangledown, location.abovebar, color.red)

// Define entry and exit conditions based on the indicator
bullishEntryFlag = plotBO and showBO and showF
bearishEntryFlag = plotBD and showBD and showBF

// Calculate Supertrend
[supertrend, direction] = ta.supertrend(SupertrendFactor, SupertrendPeriod)

bodyMiddle = plot((open + close) / 2, display=display.none)
upTrend = plot(direction < 0 ? supertrend : na, "Up Trend", color = color.green, style=plot.style_linebr)
downTrend = plot(direction < 0? na : supertrend, "Down Trend", color = color.red, style=plot.style_linebr)

fill(bodyMiddle, upTrend, color.new(color.green, 90), fillgaps=false)
fill(bodyMiddle, downTrend, color.new(color.red, 90), fillgaps=false)

// Define entry and exit conditions based on the indicator
bullishEntryST = direction < 0
bearishEntryST = direction > 0

// Entry
bullishEntry = bullishEntryFlag and bullishEntryST
bearishEntry = bearishEntryFlag and bearishEntryST

// Modify entry and exit conditions based on the selected trading direction
if (bullishEntry and (tradingDirection == "Long" or tradingDirection == "Both"))
    strategy.entry("Buy", strategy.long)
    strategy.exit("Sell", "Buy", stop=supertrend)
if (bearishEntry and (tradingDirection == "Short" or tradingDirection == "Both"))
    strategy.entry("Sell", strategy.short)
    strategy.exit("Cover", "Sell", stop=supertrend)

// Exit conditions
if (strategy.position_size > 0 and bearishEntry and (tradingDirection == "Long" or tradingDirection == "Both")) // If in a long position and bearish entry condition is met
    strategy.close("Buy")
if (strategy.position_size < 0 and bullishEntry and (tradingDirection == "Short" or tradingDirection == "Both")) // If in a short position and bullish entry condition is met
    strategy.close("Sell")