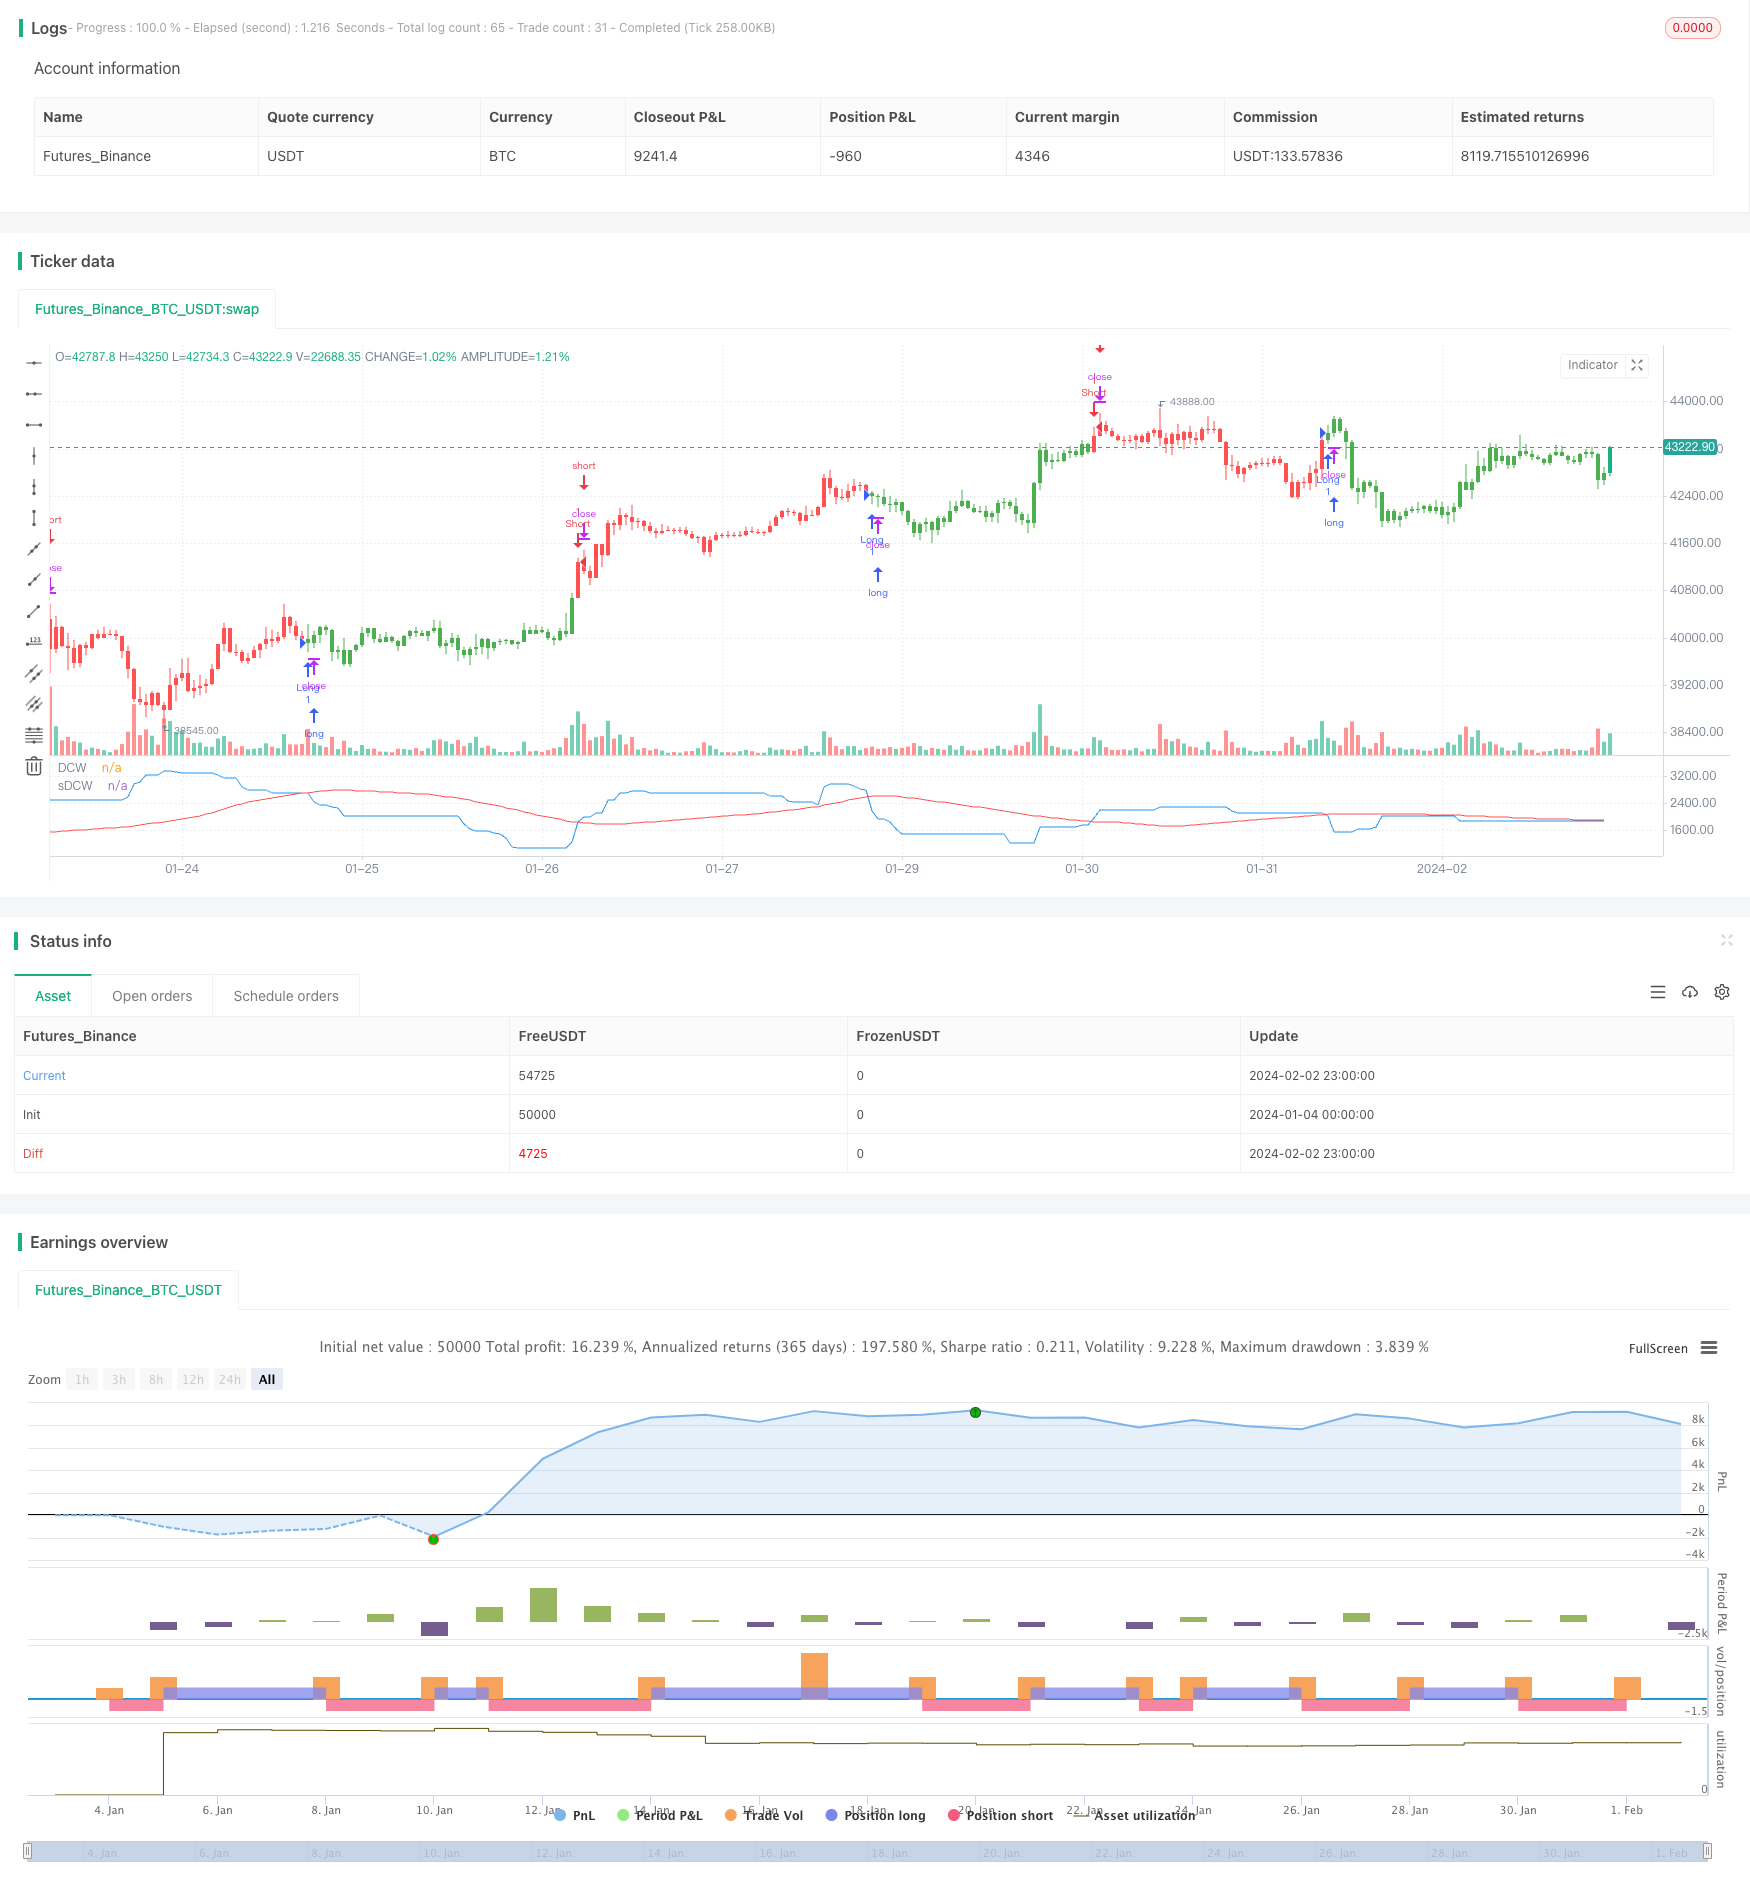
개요
돈치안 채널 너비 거래 전략은 돈치안 채널 지표에 기반하여 개발된 수치화 거래 전략이다. 이 전략은 일정 주기 동안의 최고 가격과 최저 가격 사이의 차이를, 즉 돈치안 채널의 너비를 계산하여 시장의 변동 정도와 위험 수준을 판단한다. 돈치안 채널 너비가 평평한 이동 평균보다 크면, 시장의 변동이 증가하여 높은 위험 상태에 들어간다는 것을 나타냅니다.
전략 원칙
이 전략의 핵심 지표는 돈치안 통로 너비이다. 돈치안 통로 너비의 계산 공식은 다음과 같다:
동천 통로 너비 = 최고 가격 - 최저 가격
그 중 최고 가격과 최저 가격은 일정 주기 n 내에 계산된다. 이 주기 는 length 변수 를 통해 설정된다.
동천 통로 너비 데이터를 평형화하기 위해 전략에 평형 이동 평균 지표 SMA를 도입했다. 이 지표는 동천 통로 너비를 두 번 계산하여 오류를 줄였다.
시장의 위험 수준을 판단할 때, 동천 통로의 폭이 평평한 이동 평균보다 크면 시장이 높은 변동성, 높은 위험 상태에 들어간다는 것을 나타냅니다. 시장의 변동성이 약해져 낮은 위험 상태에 들어간다는 것을 나타냅니다.
전략은 위험 수준에 따라 거래 결정을 내립니다. 위험도가 높을 때 적당하고 위험도가 낮을 때 더 많은 돈을 벌 수 있습니다.
전략적 강점 분석
이 전략의 가장 큰 장점은 변동성을 통해 시장 위험을 판단하여 그에 따른 거래 결정을 내리는 데 있습니다. 이것은 고위험 시장에서 더 많은 일을 계속하는 것을 효과적으로 방지하거나 낮은 위험 시장에서 공백이 남아있는 경우 불필요한 손실을 줄일 수 있습니다.
또한, 이 전략은 동치안 통로의 폭과 그것의 평평한 이동 평균을 결합하여 신호를 더 신뢰할 수 있게 판단하고 데이터 변동으로 인한 잘못된 거래를 피한다.
전체적으로, 이 전략은 시장의 위험을 어느 정도 판단하고 비교적 안정적인 거래 결정을 내릴 수 있습니다. 이것은 가장 큰 장점입니다.
위험 분석
이 전략의 주요 위험은 둥근 통로 폭이 항상 시장 위험을 정확하게 반영할 수 없다는 것입니다. 폭과 평균이 오차가 발생하면 잘못된 신호가 발생할 수 있습니다. 기계적으로 거래하면 큰 손실이 발생할 수 있습니다.
또한, 거래 매개 변수의 설정은 전략 수익에 큰 영향을 미칩니다. 매개 변수의 설정이 잘못되면 손실의 가능성도 증가합니다.
마지막으로, 급격히 변동하는 시장 조건에서, 동천 통로 너비 지표의 효과도 할인 될 수 있으며, 전략 신호가 지연 될 수 있습니다. 이 시기는 인적 개입이 필요하며, 전략을 일시 중지하여 불필요한 손실을 방지합니다.
최적화 방향
이 전략은 다음과 같은 부분에서 최적화될 수 있습니다.
동천 통로 너비 지표 최적화. 다양한 주기의 매개 변수를 테스트하여 최적의 매개 변수 조합을 찾을 수 있다.
다른 부표준 확인을 추가한다. 예를 들어, 변동률, 교류량 등의 지표와 결합하여 신호 정확도를 향상시킬 수 있다.
손실을 막는 전략을 늘리십시오. 합리적인 손실을 막는 것은 단독 손실의 크기를 크게 줄일 수 있으며, 전체 수익을 크게 향상시킬 수 있습니다.
매개 변수 적응 최적화. 거래 매개 변수가 실시간 시장 변화에 따라 조정될 수 있도록 하여, 시장에 더 잘 적응한다.
알고리즘 거래 최적화. 기계 학습과 같은 알고리즘 거래 기술을 도입하여 전략이 더 지능적이고 미래지향적이 되도록 한다.
요약하다
동치안 통로 폭 거래 전략은 시장의 변동성과 위험 수준을 판단하여 그에 따른 거래 결정을 내립니다. 이 전략의 가장 큰 장점은 위험을 효과적으로 제어하고 고위험 시장에서 회수되는 것을 피하는 것입니다. 전략은 여러 차원에서 최적화되어 안정적인 수익을 얻을 수 있습니다.
/*backtest
start: 2024-01-04 00:00:00
end: 2024-02-03 00:00:00
period: 1h
basePeriod: 15m
exchanges: [{"eid":"Futures_Binance","currency":"BTC_USDT"}]
*/

//@version=2
////////////////////////////////////////////////////////////
//  Copyright by HPotter v1.0 12/02/2018
// The Donchian Channel was developed by Richard Donchian and it could be compared
// to the Bollinger Bands. When it comes to volatility analysis, the Donchian Channel
// Width was created in the same way as the Bollinger Bandwidth technical indicator was.
//
// As was mentioned above the Donchian Channel Width is used in technical analysis to measure
// volatility. Volatility is one of the most important parameters in technical analysis.
// A price trend is not just about a price change. It is also about volume traded during this
// price change and volatility of a this price change. When a technical analyst focuses his/her
// attention solely on price analysis by ignoring volume and volatility, he/she only sees a part
// of a complete picture only. This could lead to a situation when a trader may miss something and
// lose money. Lets take a look at a simple example how volatility may help a trader:
//
//    Most of the price based technical indicators are lagging indicators.
//    When price moves on low volatility, it takes time for a price trend to change its direction and
// it could be ok to have some lag in an indicator.
//    When price moves on high volatility, a price trend changes its direction faster and stronger.
// An indicator's lag acceptable under low volatility could be financially suicidal now - Buy/Sell signals could be generated when it is already too late.
//
// Another use of volatility - very popular one - it is to adapt a stop loss strategy to it:
//    Smaller stop-loss recommended in low volatility periods. If it is not done, a stop-loss could
// be generated when it is too late.
//    Bigger stop-loss recommended in high volatility periods. If it is not done, a stop-loss could
// be triggered too often and you may miss good trades.
//
//You can change long to short in the Input Settings
//WARNING:
//- For purpose educate only
//- This script to change bars colors.
////////////////////////////////////////////////////////////
strategy(title="Donchian Channel Width Strategy")
length = input(50, minval=1)
smoothe = input(50, minval=1)
reverse = input(false, title="Trade reverse")
xUpper = highest(high, length)
xLower = lowest(low, length)
xDonchianWidth = xUpper - xLower
xSmoothed = sma(xDonchianWidth, smoothe)
pos = iff(xDonchianWidth > xSmoothed, -1,
       iff(xDonchianWidth < xSmoothed, 1, nz(pos[1], 0)))
possig = iff(reverse and pos == 1, -1,
          iff(reverse and pos == -1, 1, pos))
if (possig == 1)
    strategy.entry("Long", strategy.long)
if (possig == -1)
    strategy.entry("Short", strategy.short)
barcolor(possig == -1 ? red: possig == 1 ? green : blue )
plot(xDonchianWidth, color=blue, title="DCW")
plot(xSmoothed, color=red, title="sDCW")