개요
이 전략은 LazyBear의 Coral Trend 지표를 사용하여 가격 트렌드 방향을 판단하고 Coral Trend 지표 방향의 반전을 식별하여 잠재적인 입시 지점을 판단합니다. 가짜 돌파구를 필터링하기 위해 이 전략은 ADX 지표를 사용하거나 Absolute Strength Histogram 및 HawkEye Volume 지표의 그룹을 협력 확인 지표로 사용하여 더 신뢰할 수있는 입시를 수행합니다.
엑시트 메커니즘은 N근 K선에서 가장 최근에 발생한 최고/최저 가격과 구성 가능한 리스크 수익 비율을 이용하여 스톱로스 및 스톱스톱을 설정한다.
전략 원칙
코럴 트렌드 지표에 기초하여 큰 트렌드 방향을 판단한 후, 지표 색상이 변하지 않으면서, 가격에 반대 방향으로 작은 회전이 나타난다. 회전이 끝나면, 가격이 코럴 트렌드 지시에 따라 다시 주요 트렌드 방향으로 돌아간다면, 이것은 비교적 좋은 입점 시간이라고 볼 수 있다.
참가 조건은 다음과 같습니다.
코랄 트렌드 지표 방향은 거래 방향과 일치합니다 ((다중 머리 = 녹색, 빈 머리 = 빨간색)
마지막 바의 높이는 모두 코랄 트렌드 라인을 넘어서며, 적어도 1개의 K 라인의 낮이는 모두 코랄 트렌드 라인 위에 있고, 높이는 모두 코랄 트렌드 라인 아래에 있다.
반대의 방향으로 작은 회귀가 발생 (拉回), 이 작은 회귀 과정에서 닫기 가격은 항상 코럴 트렌드의 반대편에 있습니다
소규모 회귀가 끝나고 마감가는 코럴 트렌드 지시에 따라 주 트렌드 방향으로 돌아갔다.
위의 조건은 주요 조건이다. 또한, 전략은 ADX 지표 또는 Absolute Strength Histogram 및 HawkEye Volume 지표를 입학 확인 조건으로 채택한다.
ADX 지표는 값이 > 20이고 최근 1개의 K선으로 상승했다. DI의 녹색선과 빨간선의 순서는 거래 방향과 일치한다.
Absolute Strength 히스토그램은 거래 방향과 일치하는 색을 요구한다 (HawkEye Volume는 거래 방향과 일치하는 색을 요구한다).
출구 메커니즘은 가장 가까운 N 루트 K 선의 최고 가격 또는 최저 가격 곱하기 리스크 수익률을 사용하여 스톱 로즈 및 스톱 포지션을 설정한다. N 값과 리스크 수익률은 모두 파라미터를 통해 구성할 수 있다.
우위 분석
이 전략의 가장 큰 장점은 코럴 트렌드 지표를 사용하여 주 트렌드 방향을 판단한 후, 그 반전을 식별하여 진입 기회를 발견하고, 비 트렌드 시장에서 파도를 따라가는 것을 피하는 것입니다. 동시에, 확인 지표를 사용하면 많은 가짜 돌파구를 필터링하여 진입의 성공률을 높일 수 있습니다.
또한, 이 전략은 단독 거래 손실이 전체 자금에 큰 영향을 미치지 않도록 스톱 로즈 세팅과 리스크 퍼센티지 컨트롤을 포함한 전체 위험 관리 장치를 제공합니다.
위험 분석
이 전략의 가장 큰 위험은 지표를 도입하여 시장 판단을 하는 데 있습니다. 이는 완전히 매개 변수 구성에 의존하면 자동으로 이익을 얻을 수 있다는 착각을 일으킬 수 있습니다. 사실, 매개 변수 최적화 및 규칙 구성은 기본 가격 변화의 법칙과 결합하여 지표와 가격의 연동 효과를 직관적으로 판단하는 것이 필요합니다. 자신의 거래 스타일과 품종에 더 적합한配置을 설정하기 위해.
또한, 막대기와 막대기의 설정도 적절해야 한다. 너무 큰 막대기 배수는 막대기를 떠날 수 없게 만들 수 있고, 너무 작은 막대기는 너무 큰 위험을 초래할 수 있다. 이것은 다른 품종의 변동 정도와 개인의 위험 감수 능력에 따라 설정할 필요가 있다.
최적화 방향
이 전략의 최적화 방향은 다음과 같습니다.
코럴 트렌드 지표의 매개 변수를 조정하여 다양한 품종의 가격 변화에 더 민감하게 반응합니다.
다른 확인 지표 또는 KDJ, MACD와 같은 지표 조합을 시도하여 입시 신호를 더 정확하게 만듭니다.
다양한 품종의 변동성에 따라 스톱로즈 및 스톱 포스트 계산 방법을 조정하여 더 나은 위험 관리를 수행합니다.
자산 관리 모듈을 추가하여 포지션 수에 따라 단일 위탁량을 조정하여 전체 손실을 효과적으로 제어 할 수 있습니다.
거래 시간 제어 모듈을 추가하여 전략이 특정 시간 동안만 실행되도록 하며, 격렬한 변동 기간의 손실을 방지합니다.
요약하다
이 전략은 Coral Trend을 사용하여 중장선 추세를 판단하고, 그 후 반전을 판단하여, Confirm 신호 필터 가짜 돌파구와 함께, 더 신뢰할 수있는 추세 추적 전략을 구축합니다. 또한, 완벽한 풍력 제어 설정은 이 전략이 장기간에 걸쳐 운영 될 수 있도록하고 자금을 안정시킵니다. 추가 변수 및 모듈 최적화를 통해이 전략이 더 많은 품종에 적합하고 더 나은 안정성과 수익성을 갖출 수 있습니다.
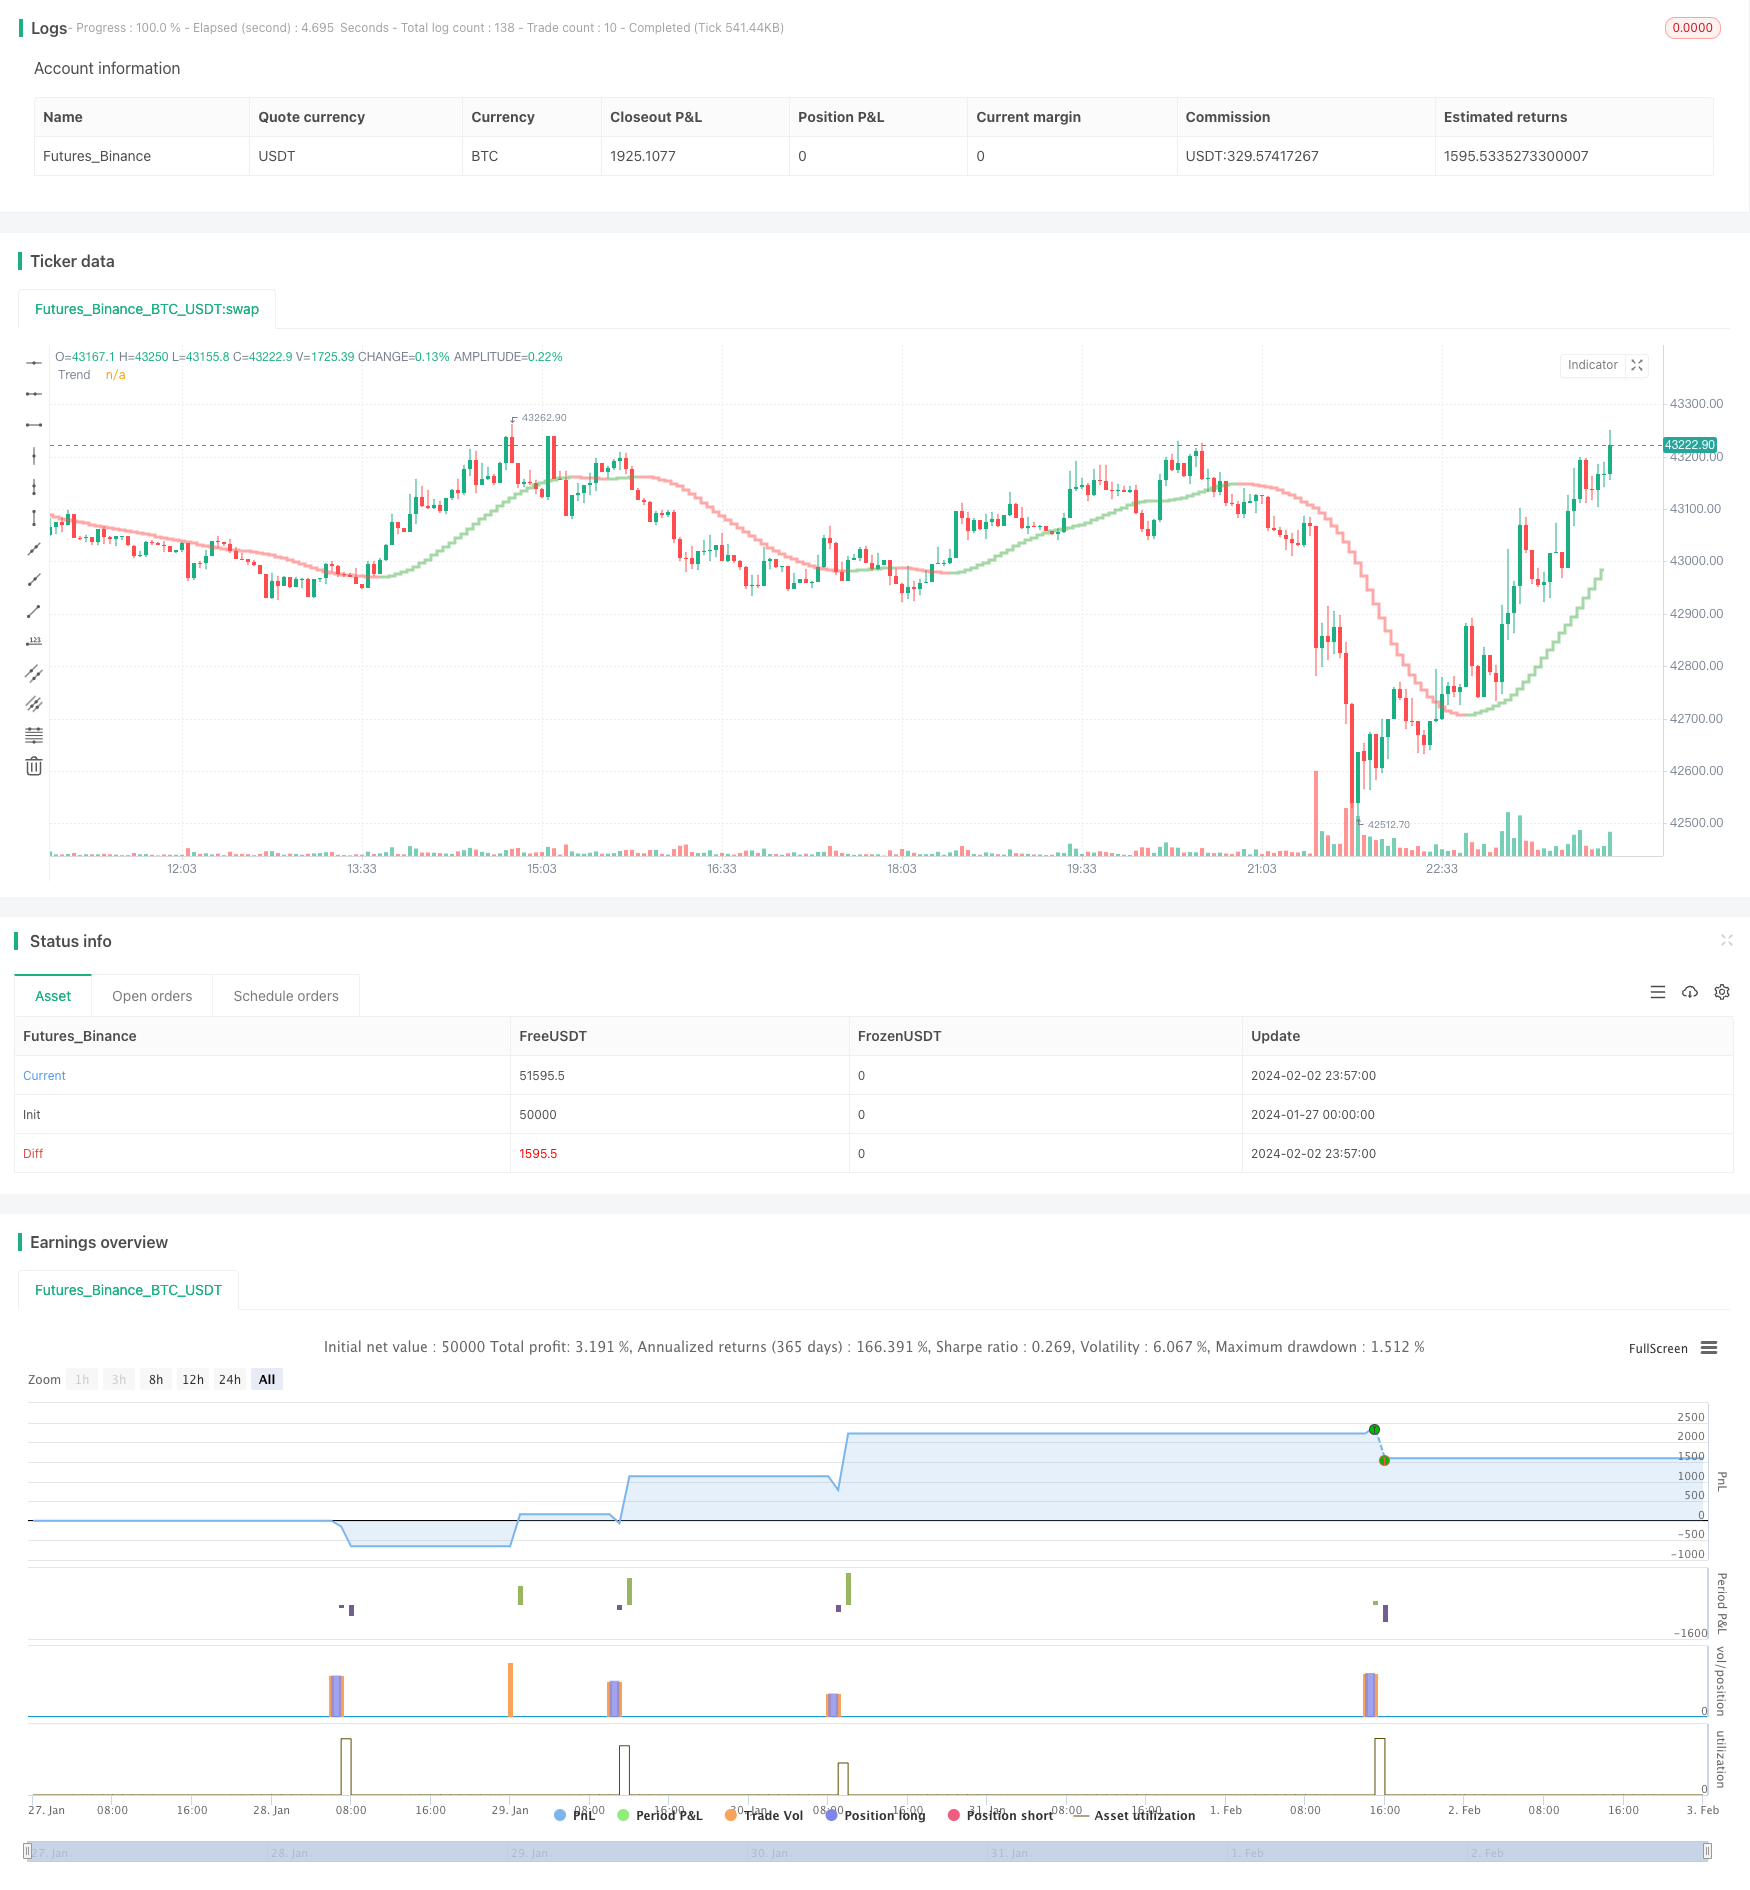
/*backtest
start: 2024-01-27 00:00:00
end: 2024-02-03 00:00:00
period: 3m
basePeriod: 1m
exchanges: [{"eid":"Futures_Binance","currency":"BTC_USDT"}]
*/

// This source code is subject to the terms of the Mozilla Public License 2.0 at https://mozilla.org/MPL/2.0/
// © kevinmck100

// @description
//
// Strategy is taken from the TradeIQ YouTube video called "I Finally Found 80% Win Rate Trading Strategy For Crypto"
// Check out the full video for further details/clarification on strategy entry/exit conditions.
//
// It incorporates the following features:
//
//      - Risk management:  Configurable X% loss per stop loss
//                          Configurable R:R ratio
//
//      - Trade entry:      Conditions outlines below
//
//      - Trade exit:       Conditions outlined below
//
//      - Backtesting:      Configurable backtesting range by date
//
//      - Trade drawings:   TP/SL boxes drawn for all trades (can be turned on and off)
//                          Trade exit information labels (can be turned on and off)
//                          NOTE: Trade drawings will only be applicable when using overlay strategies
//
//      - Debugging:        Includes section with useful debugging techniques
//
// Strategy conditions:
//
//      - Trade entry:      LONG:   C1: Coral Trend is bullish
//                                  C2: At least 1 candle where low is above Coral Trend since last cross above Coral Trend
//                                  C3: Pullback happens and price closes below Coral Trend
//                                  C4: Coral Trend colour remains bullish for duration of pullback
//                                  C5: After valid pullback, price then closes above Coral Trend
//                                  C6: Optional confirmation indicators (choose either C6.1 or C6.2 or NONE):
//                                      C6.1: ADX and DI (Single indicator)
//                                          C6.1.1: Green line is above red line
//                                          C6.1.2: Blue line > 20
//                                          C6.1.3: Blue trending up over last 1 candle
//                                      C6.2: Absolute Strengeh Histogram + HawkEye Volume Indicator (Two indicators combined)
//                                          C6.2.1: Absolute Strengeh Histogram colour is blue
//                                          C6.2.2: HawkEye Volume Indicator colour is green
//                          SHORT:  C1: Coral Trend is bearish
//                                  C2: At least 1 candle where high is below Coral Trend since last cross below Coral Trend
//                                  C3: Pullback happens and price closes above Coral Trend
//                                  C4: Coral Trend colour remains bearish for duration of pullback
//                                  C5: After valid pullback, price then closes below Coral Trend
//                                  C6: Optional confirmation indicators (choose either C6.1 or C6.2 or NONE):
//                                      C6.1: ADX and DI (Single indicator)
//                                          C6.1.1: Red line is above green line
//                                          C6.1.2: Blue line > 20
//                                          C6.1.3: Blue trending up over last 1 candle
//                                      C6.2: Absolute Strengeh Histogram + HawkEye Volume Indicator (Two indicators combined)
//                                          C6.2.1: Absolute Strengeh Histogram colour is red
//                                          C6.2.2: HawkEye Volume Indicator colour is red
//                          NOTE: All the optional confirmation indicators cannot be overlayed with Coral Trend so feel free to add each separately to the chart for visual purposes
//
//
//      - Trade exit:       Stop Loss:      Calculated by recent swing low over previous X candles (configurable with "Local High/Low Lookback")
//                          Take Profit:    Calculated from R:R multiplier * Stop Loss size
//
// @credits
//
// Coral Trend Indicator [LazyBear]     by @LazyBear
// Absolute Strength Histogram | jh     by @jiehonglim
// Indicator: HawkEye Volume Indicator  by @LazyBear
// ADX and DI                           by @BeikabuOyaji

//@version=5
INITIAL_CAPITAL = 1000
DEFAULT_COMMISSION = 0.02
MAX_DRAWINGS = 500
IS_OVERLAY = true

strategy("Coral Trend Pullback Strategy (TradeIQ)", "Coral Trend Pullback", overlay = IS_OVERLAY, initial_capital = INITIAL_CAPITAL, currency = currency.NONE, max_labels_count = MAX_DRAWINGS, max_boxes_count = MAX_DRAWINGS, max_lines_count = MAX_DRAWINGS, default_qty_type = strategy.cash, commission_type = strategy.commission.percent, commission_value = DEFAULT_COMMISSION)

// =============================================================================
// INPUTS
// =============================================================================

// ---------------
// Risk Management
// ---------------
riskReward          = input.float(1.5,  "Risk : Reward        1 :",     group = "Strategy: Risk Management",    inline = "RM1", minval = 0, step = 0.1, tooltip = "Previous high or low (long/short dependant) is used to determine TP level. 'Risk : Reward' ratio is then used to calculate SL based of previous high/low level.\n\nIn short, the higher the R:R ratio, the smaller the SL since TP target is fixed by previous high/low price data.")
accountRiskPercent  = input.float(1,    "Portfolio Risk %        ",     group = "Strategy: Risk Management",    inline = "RM2", minval = 0, step = 0.1, tooltip = "Percentage of portfolio you lose if trade hits SL.\n\nYou then stand to gain\n  Portfolio Risk % * Risk : Reward\nif trade hits TP.")

localHlLookback     = input.int (5,     "Local High/Low Lookback     ", group = "Strategy: Stop Loss Settings", inline = "SL1", minval = 1,             tooltip = "This strategy calculates the Stop Loss value from the recent local high/low. This lookback period determines the number of candles to include for the local high/low.")

// ----------
// Date Range
// ----------
startYear           = input.int (2010,  "Start Date  ",                 group = "Strategy: Date Range",         inline = "DR1", minval    = 1900, maxval = 2100)
startMonth          = input.int (1,     "",                             group = "Strategy: Date Range",         inline = "DR1", options   = [1, 2, 3, 4, 5, 6, 7, 8, 9, 10, 11, 12])
startDate           = input.int (1,     "",                             group = "Strategy: Date Range",         inline = "DR1", options   = [1, 2, 3, 4, 5, 6, 7, 8, 9, 10, 11, 12, 13, 14, 15, 16, 17, 18, 19, 20, 21, 22, 23, 24, 25, 26, 27, 28, 29, 30, 31])
endYear             = input.int (2100,  "End Date    ",                 group = "Strategy: Date Range",         inline = "DR2", minval    = 1900, maxval = 2100)
endMonth            = input.int (1,     "",                             group = "Strategy: Date Range",         inline = "DR2", options   = [1, 2, 3, 4, 5, 6, 7, 8, 9, 10, 11, 12])
endDate             = input.int (1,     "",                             group = "Strategy: Date Range",         inline = "DR2", options   = [1, 2, 3, 4, 5, 6, 7, 8, 9, 10, 11, 12, 13, 14, 15, 16, 17, 18, 19, 20, 21, 22, 23, 24, 25, 26, 27, 28, 29, 30, 31])

// ----------------
// Drawing Settings
// ----------------
showTpSlBoxes       = input.bool(true,  "Show TP / SL Boxes",           group = "Strategy: Drawings",           inline = "D1",  tooltip = "Show or hide TP and SL position boxes.\n\nNote: TradingView limits the maximum number of boxes that can be displayed to 500 so they may not appear for all price data under test.")
showLabels          = input.bool(false, "Show Trade Exit Labels",       group = "Strategy: Drawings",           inline = "D2",  tooltip = "Useful labels to identify Profit/Loss and cumulative portfolio capital after each trade closes.\n\nAlso note that TradingView limits the max number of 'boxes' that can be displayed on a chart (max 500). This means when you lookback far enough on the chart you will not see the TP/SL boxes. However you can check this option to identify where trades exited.")

// ------------------
// Indicator Settings
// ------------------

// Coral Trend
ctSm                = input.int  (25,       "Smoothing Period       ",              group = "Leading Indicator: Coral Trand Settings",                      inline = "CT1")
ctCd                = input.float(0.4,      "Constant D          ",                 group = "Leading Indicator: Coral Trand Settings",                      inline = "CT2", step = 0.1)

// Confirmation indicator inputs
confirmationInd     = input.string("ADX and DI", "Entry Confirmation Method    ",   group = "Confirmation Indicator: Indicator Selection",                  inline = "IS1", options=["None", "ADX and DI", "Absolute Strength Histogram + HawkEye Volume"], tooltip = "Select one of the possible confirmation indicator(s) which can be used to confirm entry signals from the main Coral Trend indicator conditions. See strategy conditions to understand the logic behind each confirmation indicator")
// ADX and DI
adxLen              = input.int(14, "ADX Length           ",                        group = "Confirmation Indicator: ADX and DI Settings",                  inline = "AD1")
midLine             = input.int(20, "Mid Line            ",                         group = "Confirmation Indicator: ADX and DI Settings",                  inline = "AD2", tooltip = "Mid line on standard ADX and DI indicator. In this strategy the DI must be above this line for entry confirmation.")
// Absolute Strength Histogram
ashLength           = input.int(9, "Period of Evaluation       ",                   group = "Confirmation Indicator: Absolute Strength Histogram Settings", inline = "ASH1")
ashSmooth           = input.int(6, "Period of Smoothing      ",                     group = "Confirmation Indicator: Absolute Strength Histogram Settings", inline = "ASH2")
ashSrc              = input.source(close, "Source             ",                    group = "Confirmation Indicator: Absolute Strength Histogram Settings", inline = "ASH3")
ashMode             = input.string("RSI", "Indicator Method       ",                group = "Confirmation Indicator: Absolute Strength Histogram Settings", inline = "ASH4", options=["RSI", "STOCHASTIC", "ADX"])
sahMaType           = input.string("SMA", "MA              ",                       group = "Confirmation Indicator: Absolute Strength Histogram Settings", inline = "ASH5", options=["ALMA", "EMA", "WMA", "SMA", "SMMA", "HMA"])
ashAlmaOffset       = input.float(0.85, "* Arnaud Legoux (ALMA) Offset",            group = "Confirmation Indicator: Absolute Strength Histogram Settings", inline = "ASH6", minval=0, step=0.01)
ashAlmaSigma        = input.int(6, "* Arnaud Legoux (ALMA) Sigma",                  group = "Confirmation Indicator: Absolute Strength Histogram Settings", inline = "ASH7", minval=0)
// HawkEye Volume Indicator
hevLength           = input.int(200, "Length             ",                         group = "Confirmation Indicator: HawkEye Volume Settings",              inline = "HV1")
hevDivisor          = input.float(1.6, "Divisor             ",                      group = "Confirmation Indicator: HawkEye Volume Settings",              inline = "HV2", step=0.1)

// =============================================================================
// INDICATORS
// =============================================================================

// -----------
// Coral Trend
// -----------
src             = close
di              = (ctSm - 1.0) / 2.0 + 1.0
c1              = 2 / (di + 1.0)
c2              = 1 - c1
c3              = 3.0 * (ctCd * ctCd + ctCd * ctCd * ctCd)
c4              = -3.0 * (2.0 * ctCd * ctCd + ctCd + ctCd * ctCd * ctCd)
c5              = 3.0 * ctCd + 1.0 + ctCd * ctCd * ctCd + 3.0 * ctCd * ctCd
var float i1    = na
var float i2    = na
var float i3    = na
var float i4    = na
var float i5    = na
var float i6    = na
i1             := c1 * src + c2 * nz(i1[1])
i2             := c1 * i1  + c2 * nz(i2[1])
i3             := c1 * i2  + c2 * nz(i3[1])
i4             := c1 * i3  + c2 * nz(i4[1])
i5             := c1 * i4  + c2 * nz(i5[1])
i6             := c1 * i5  + c2 * nz(i6[1])

bfr             = -ctCd * ctCd * ctCd * i6 + c3 * i5 + c4 * i4 + c5 * i3
bfrC            = bfr > nz(bfr[1]) ? color.new(color.green, 50) : bfr < nz(bfr[1]) ? color.new(color.red, 50) : color.new(color.blue, 50)
plot(bfr, "Trend", linewidth = 3, style = plot.style_stepline, color = bfrC)

// ----------
// ADX and DI
// ----------
TrueRange                           = math.max(math.max(high - low, math.abs(high - nz(close[1]))), math.abs(low - nz(close[1])))
DirectionalMovementPlus             = high - nz(high[1]) > nz(low[1]) - low ? math.max(high - nz(high[1]), 0) : 0
DirectionalMovementMinus            = nz(low[1]) - low > high - nz(high[1]) ? math.max(nz(low[1]) - low, 0) : 0

SmoothedTrueRange                   = 0.0
SmoothedTrueRange                  := nz(SmoothedTrueRange[1]) - nz(SmoothedTrueRange[1]) / adxLen + TrueRange

SmoothedDirectionalMovementPlus     = 0.0
SmoothedDirectionalMovementPlus    := nz(SmoothedDirectionalMovementPlus[1]) - nz(SmoothedDirectionalMovementPlus[1]) / adxLen + DirectionalMovementPlus

SmoothedDirectionalMovementMinus    = 0.0
SmoothedDirectionalMovementMinus   := nz(SmoothedDirectionalMovementMinus[1]) - nz(SmoothedDirectionalMovementMinus[1]) / adxLen + DirectionalMovementMinus

DIPlus                              = SmoothedDirectionalMovementPlus / SmoothedTrueRange * 100
DIMinus                             = SmoothedDirectionalMovementMinus / SmoothedTrueRange * 100
DX                                  = math.abs(DIPlus - DIMinus) / (DIPlus + DIMinus) * 100
ADX                                 = ta.sma(DX, adxLen)

// ---------------------------
// Absolute Strength Histogram
// ---------------------------
ashMa(ashType, ashSrc, ashLen) =>
    float result = 0
    if ashType == 'SMA'  // Simple
        result := ta.sma(ashSrc, ashLen)
        result
    if ashType == 'EMA'  // Exponential
        result := ta.ema(ashSrc, ashLen)
        result
    if ashType == 'WMA'  // Weighted
        result := ta.wma(ashSrc, ashLen)
        result
    if ashType == 'SMMA'  // Smoothed
        ashWma = ta.wma(ashSrc, ashLen)
        ashSma = ta.sma(ashSrc, ashLen)
        result := na(ashWma[1]) ? ashSma : (ashWma[1] * (ashLen - 1) + ashSrc) / ashLen
        result
    if ashType == 'HMA'  // Hull
        result := ta.wma(2 * ta.wma(ashSrc, ashLen / 2) - ta.wma(ashSrc, ashLen), math.round(math.sqrt(ashLen)))
        result
    if ashType == 'ALMA'  // Arnaud Legoux
        result := ta.alma(ashSrc, ashLen, ashAlmaOffset, ashAlmaSigma)
        result
    result

Price           = ashSrc
Price1          = ashMa('SMA', Price, 1)
Price2          = ashMa('SMA', Price[1], 1)

//RSI
Bulls0          = 0.5 * (math.abs(Price1 - Price2) + Price1 - Price2)
Bears0          = 0.5 * (math.abs(Price1 - Price2) - (Price1 - Price2))

//STOCHASTIC
Bulls1          = Price1 - ta.lowest(Price1, ashLength)
Bears1          = ta.highest(Price1, ashLength) - Price1

//ADX
Bulls2          = 0.5 * (math.abs(high - high[1]) + high - high[1])
Bears2          = 0.5 * (math.abs(low[1] - low) + low[1] - low)

Bulls           = ashMode == 'RSI' ? Bulls0 : ashMode == 'STOCHASTIC' ? Bulls1 : Bulls2
Bears           = ashMode == 'RSI' ? Bears0 : ashMode == 'STOCHASTIC' ? Bears1 : Bears2
AvgBulls        = ashMa(sahMaType, Bulls, ashLength)
AvgBears        = ashMa(sahMaType, Bears, ashLength)

SmthBulls       = ashMa(sahMaType, AvgBulls, ashSmooth)
SmthBears       = ashMa(sahMaType, AvgBears, ashSmooth)

isTrendBullish  = SmthBulls > SmthBears ? true : false

// ------------------------
// HawkEye Volume Indicator
// ------------------------
hevRange1   = high - low
hevRangeAvg = ta.sma(hevRange1, hevLength)
hevVolumeA  = ta.sma(volume, hevLength)

hevHigh1    = high[1]
hevLow1     = low[1]
hevMid1     = hl2[1]

hevU1       = hevMid1 + (hevHigh1 - hevLow1) / hevDivisor
hevD1       = hevMid1 - (hevHigh1 - hevLow1) / hevDivisor

rEnabled1   = hevRange1 > hevRangeAvg and close < hevD1 and volume > hevVolumeA
rEnabled2   = close < hevMid1
rEnabled    = rEnabled1 or rEnabled2

gEnabled1   = close > hevMid1
gEnabled2   = hevRange1 > hevRangeAvg and close > hevU1 and volume > hevVolumeA
gEnabled3   = high > hevHigh1 and hevRange1 < hevRangeAvg / 1.5 and volume < hevVolumeA
gEnabled4   = low < hevLow1 and hevRange1 < hevRangeAvg / 1.5 and volume > hevVolumeA
gEnabled    = gEnabled1 or gEnabled2 or gEnabled3 or gEnabled4

grEnabled1  = hevRange1 > hevRangeAvg and close > hevD1 and close < hevU1 and volume > hevVolumeA and volume < hevVolumeA * 1.5 and volume > volume[1]
grEnabled2  = hevRange1 < hevRangeAvg / 1.5 and volume < hevVolumeA / 1.5
grEnabled3  = close > hevD1 and close < hevU1
grEnabled   = grEnabled1 or grEnabled2 or grEnabled3

// =============================================================================
// STRATEGY LOGIC
// =============================================================================

// ---------
// FUNCTIONS
// ---------

percentAsPoints(pcnt) =>
    math.round(pcnt / 100 * close / syminfo.mintick)

calcStopLossPrice(pointsOffset, isLong) =>
    priceOffset = pointsOffset * syminfo.mintick
    if isLong
        close - priceOffset
    else
        close + priceOffset

calcProfitTrgtPrice(pointsOffset, isLong) =>
    calcStopLossPrice(-pointsOffset, isLong)


printLabel(barIndex, msg) => label.new(barIndex, close, msg)

printTpSlHitBox(left, right, slHit, tpHit, entryPrice, slPrice, tpPrice) =>
    if showTpSlBoxes
        box.new (left = left,   top = entryPrice,   right = right,  bottom = slPrice,   bgcolor = slHit ? color.new(color.red, 60)   : color.new(color.gray, 90), border_width = 0)
        box.new (left = left,   top = entryPrice,   right = right,  bottom = tpPrice,   bgcolor = tpHit ? color.new(color.green, 60) : color.new(color.gray, 90), border_width = 0)
        line.new(x1 = left,     y1 = entryPrice,    x2 = right,     y2 = entryPrice,    color = color.new(color.yellow, 20))
        line.new(x1 = left,     y1 = slPrice,       x2 = right,     y2 = slPrice,       color = color.new(color.red, 20))
        line.new(x1 = left,     y1 = tpPrice,       x2 = right,     y2 = tpPrice,       color = color.new(color.green, 20))

printTpSlNotHitBox(left, right, entryPrice, slPrice, tpPrice) =>
    if showTpSlBoxes
        box.new (left = left,   top = entryPrice,   right = right,  bottom = slPrice,   bgcolor = color.new(color.gray, 90), border_width = 0)
        box.new (left = left,   top = entryPrice,   right = right,  bottom = tpPrice,   bgcolor = color.new(color.gray, 90), border_width = 0)
        line.new(x1 = left,     y1 = entryPrice,    x2 = right,     y2 = entryPrice,    color = color.new(color.yellow, 20))
        line.new(x1 = left,     y1 = slPrice,       x2 = right,     y2 = slPrice,       color = color.new(color.red, 20))
        line.new(x1 = left,     y1 = tpPrice,       x2 = right,     y2 = tpPrice,       color = color.new(color.green, 20))

printTradeExitLabel(x, y, posSize, entryPrice, pnl) =>
    if showLabels
        labelStr = "Position Size: " + str.tostring(math.abs(posSize), "#.##") + "\nPNL: " + str.tostring(pnl, "#.##") + "\nCapital: " + str.tostring(strategy.equity, "#.##") + "\nEntry Price: " + str.tostring(entryPrice, "#.##")
        label.new(x = x, y = y, text = labelStr, color = pnl > 0 ? color.new(color.green, 60) : color.new(color.red, 60), textcolor = color.white, style = label.style_label_down)

printVerticalLine(col) => line.new(bar_index, close, bar_index, close * 1.01, extend = extend.both, color = col)

// ----------
// CONDITIONS
// ----------

inDateRange                 = true

// Condition 1: Coral Trend color matches trend direction (long=green, short=red)
isCoralBullish              = bfr > nz(bfr[1])
isCoralBearish              = bfr < nz(bfr[1])

// Condition 2: At least 1 candle completely above/below (long/short) Coral Trend since last cross above/below (long/short) Coral Trend (could potentially try also with only close above)
sincePrePullbackBullBreakout= ta.barssince(ta.crossover(close, bfr))
sincePrePullbackBearBreakout= ta.barssince(ta.crossunder(close, bfr))
prePullbackBullBreakout     = ta.barssince(low > bfr and high > bfr) < sincePrePullbackBullBreakout[1]
prePullbackBearBreakout     = ta.barssince(low < bfr and high < bfr) < sincePrePullbackBearBreakout[1]

// Condition 3: Pullback closes below/above (long/short) Coral Trend
barssinceBullPullbackStart  = ta.barssince(ta.crossunder(close, bfr))
barssinceBearPullbackStart  = ta.barssince(ta.crossover(close, bfr))
barssincePullbackStart      = isCoralBullish ? barssinceBullPullbackStart : isCoralBearish ? barssinceBearPullbackStart : na

// Condition 4: Coral Trend colour matched trend direction for duration of pullback
sinceBullish                = ta.barssince(ta.crossover(bfr, nz(bfr[1])))
sinceBearish                = ta.barssince(ta.crossunder(bfr, nz(bfr[1])))
barssinceCoralflip          = isCoralBullish ? sinceBullish : isCoralBearish ? sinceBearish : na
isPullbackValid             = barssincePullbackStart < barssinceCoralflip

// Condition 5: After valid pullback, price then closes above/below (long/short) Coral Trend
entryBreakout               = (isCoralBullish and ta.crossover(close, bfr)) or (isCoralBearish and ta.crossunder(close, bfr))

// Condition 6: Confirmation indicators (6.1 or 6.2, optional depending on settings) confirms trade entry
// 6.1:         ADX and DI
//      6.1.1:  Green and red match trend (long=(green > red), short=(red > green))
//      6.1.2:  Blue > 20
//      6.1.3:  Blue trending up over last 1 candle
// 6.2:         Absolute Strengeh Histogram + HawkEye Volume Indicator
//      6.2.1:  Absolute Strengeh Histogram colour matches trend (long=blue, short=red)
//      6.2.2:  HawkEye Volume Indicator colour matches trend (long=green, short=red)
var longTradeConfirmed  = false
var shortTradeConfirmed = false
if confirmationInd      == "ADX and DI"
    isAdxUp             = ADX       > ADX [1]
    isAdxValid          = ADX       > midLine   and isAdxUp
    longTradeConfirmed := DIPlus    > DIMinus   and isAdxValid
    shortTradeConfirmed:= DIMinus   > DIPlus    and isAdxValid
else if confirmationInd == "Absolute Strength Histogram + HawkEye Volume"
    isAshBullish        = SmthBulls > SmthBears ? true : false
    isHevBullish        = not grEnabled     and gEnabled ? true : false
    isHevBearish        = not grEnabled     and rEnabled ? true : false
    longTradeConfirmed := isAshBullish      and isHevBullish
    shortTradeConfirmed:= not isAshBullish  and isHevBearish
else if confirmationInd == "None"
    longTradeConfirmed := true
    shortTradeConfirmed:= true

// Combine all entry conditions
goLong              = inDateRange and isCoralBullish and prePullbackBullBreakout and isPullbackValid and entryBreakout and longTradeConfirmed
goShort             = inDateRange and isCoralBearish and prePullbackBearBreakout and isPullbackValid and entryBreakout and shortTradeConfirmed

// Trade entry and exit variables
var tradeEntryBar   = bar_index
var profitPoints    = 0.
var lossPoints      = 0.
var slPrice         = 0.
var tpPrice         = 0.
var inLong          = false
var inShort         = false
var entryPrice      = 0.

// Entry decisions
openLong            = (goLong and not inLong)
openShort           = (goShort and not inShort)
flippingSides       = (goLong and inShort) or (goShort and inLong)
enteringTrade       = openLong or openShort
inTrade             = inLong or inShort

// Exit calculations
entryPrice         := close
longSlPrice         = ta.lowest(localHlLookback)
shortSlPrice        = ta.highest(localHlLookback)
slAmount            = isCoralBullish ? entryPrice - longSlPrice : shortSlPrice - entryPrice
slPercent           = math.abs((1 - (entryPrice - slAmount) / entryPrice) * 100)
tpPercent           = slPercent * riskReward

// Risk calculations
riskAmt             = strategy.equity * accountRiskPercent / 100
entryQty            = math.abs(riskAmt / slPercent * 100)  / close

if openLong
    if strategy.position_size < 0
        printTpSlNotHitBox(tradeEntryBar + 1, bar_index + 1, strategy.position_avg_price, slPrice, tpPrice)
        printTradeExitLabel(bar_index + 1, math.max(tpPrice, slPrice), strategy.position_size, strategy.position_avg_price, strategy.openprofit)
    strategy.entry("Long", strategy.long, qty = entryQty, alert_message = "Long Entry")
    enteringTrade   := true
    inLong          := true
    inShort         := false

if openShort
    if strategy.position_size > 0
        printTpSlNotHitBox(tradeEntryBar + 1, bar_index + 1, strategy.position_avg_price, slPrice, tpPrice)
        printTradeExitLabel(bar_index + 1, math.max(tpPrice, slPrice), strategy.position_size, strategy.position_avg_price, strategy.openprofit)
    strategy.entry("Short", strategy.short, qty = entryQty, alert_message = "Short Entry")
    enteringTrade   := true
    inShort         := true
    inLong          := false

if enteringTrade
    profitPoints    := percentAsPoints(tpPercent)
    lossPoints      := percentAsPoints(slPercent)
    slPrice         := calcStopLossPrice(lossPoints, openLong)
    tpPrice         := calcProfitTrgtPrice(profitPoints, openLong)
    tradeEntryBar   := bar_index

strategy.exit("TP/SL", profit = profitPoints, loss = lossPoints, comment_profit = "TP Hit", comment_loss = "SL Hit", alert_profit = "TP Hit Alert", alert_loss = "SL Hit Alert")

// =============================================================================
// DRAWINGS
// =============================================================================

// -----------
// TP/SL Boxes
// -----------

slHit           = (inShort and high >= slPrice) or (inLong  and low <= slPrice)
tpHit           = (inLong  and high >= tpPrice) or (inShort and low <= tpPrice)

exitTriggered   = slHit or tpHit
ctEntryPrice    = strategy.closedtrades.entry_price (strategy.closedtrades - 1)
pnl             = strategy.closedtrades.profit      (strategy.closedtrades - 1)
posSize         = strategy.closedtrades.size        (strategy.closedtrades - 1)

// Print boxes for trades closed at profit or loss
if (inTrade and exitTriggered)
    inShort    := false
    inLong     := false
    // printTpSlHitBox(tradeEntryBar, bar_index, slHit, tpHit, ctEntryPrice, slPrice, tpPrice)
    // printTradeExitLabel(bar_index, math.max(tpPrice, slPrice), posSize, ctEntryPrice, pnl)

// Print TP/SL box for current open trade
// if barstate.islastconfirmedhistory and strategy.position_size != 0
//     printTpSlNotHitBox(tradeEntryBar + 1, bar_index + 1, strategy.position_avg_price, slPrice, tpPrice)

// // =============================================================================
// // DEBUGGING
// // =============================================================================

// Data window plots
plotchar(prePullbackBullBreakout,   "prePullbackBullBreakout",  "")
plotchar(prePullbackBearBreakout,   "prePullbackBearBreakout",  "")
plotchar(barssincePullbackStart,    "barssincePullbackStart",   "")
plotchar(isCoralBullish,            "isCoralBullish",           "")
plotchar(isCoralBearish,            "isCoralBearish",           "")
plotchar(barssinceCoralflip,        "barssinceCoralflip",       "")
plotchar(isPullbackValid,           "isPullbackValid",          "")
plotchar(entryBreakout,             "entryBreakout",            "")
plotchar(slHit,                     "slHit",                    "")
plotchar(tpHit,                     "tpHit",                    "")
plotchar(slPrice,                   "slPrice",                  "")

// Label plots
// plotDebugLabels = false
// if plotDebugLabels
//     if bar_index == tradeEntryBar
//         printLabel(bar_index, "Position size: " + str.tostring(entryQty * close, "#.##"))