
변동율 자율적 하이킨 아쉬 ATR 추적 손실 트렌드 거래 전략은 금융 시장의 트렌드 식별 및 위험 관리를 위해 특별히 설계된 체계화된 거래 방법이다. 이 전략은 하이킨 아쉬 (Heikin Ashi) 도화 기술에 기반하여 시장 소음을 필터링하고, 평균 실제 파도 (ATR) 의 동적 조정 추적 중지 시스템을 결합하여 지수 이동 평균 (EMA) 의 교차를 통해 거래 신호를 생성한다. 이 전략은 다중 거래만을 수행하며, 변동율 조정 구성 요소를 통해 신호 안정성과 거래를 강화한다. 이 전략은 특히 암호화폐와 같은 고 변동 시장에 적합하며, 체계화된 추세를 추적하는 거래자에게도 적합하다.
이 전략의 핵심 원칙은 몇 가지 핵심 기술 구성 요소의 상호 작용에 기반합니다.
하이켄 아키의 필터 지도전략은 세 가지의 다른 하이켄 아쉬 계산 모드를 제공합니다: 수동 계산, TradingView 내장 함수 및 정규 그래프) 시장의 단기간의 잡음을 줄이고 잠재적인 트렌드 방향을 강조합니다. 수동 계산 모드는 가장 투명하고 신뢰할 수있는 결과를 제공하지만, 내장 함수는 확인된 역사 기둥을 사용하여 다시 그리기를 방지합니다.
ATR 추적 중지 메커니즘: 평균 실제 파도 (ATR) 는 시장의 변동성을 동적으로 측정하는 지표로, 사용자 정의 된 파라미터 (Key Value 및 ATR 주기) 와 결합하여 스톱 트래킹의 민감성을 조정하여 다른 시장의 변동성 환경에 적응할 수 있도록합니다. 이 메커니즘은 동적인 탈퇴점을 제공하여 트렌드 개발 과정에서 자금을 보호하고 수익을 잠금합니다.
EMA 교차 신호 생성: 입점과 출구 신호는 하이켄 아쉬 가격과 지수 이동 평균 (EMA) 사이의 상호 작용에서 유래한다. 이 두 가지 구성 요소 사이의 교차 이벤트는 잠재적인 다중 입점 또는 출구 신호를 발산하는 동력 전환을 객관적으로 식별하는 데 사용됩니다.
엄격한 제약 적용전략에는 선택 가능한 손실 기능이 포함되어 있으며, 진입 가격의 퍼센트 또는 고정 점수 편차로 구성할 수 있습니다. 중요한 것은, 손실이 실제 시장 가격에 기반하여 수행되는 것이 아니라 합성 하이켄 AHS가므로, 실제 시장 유동성과 가격 수준에 기반하여 위험 관리가 보장됩니다.
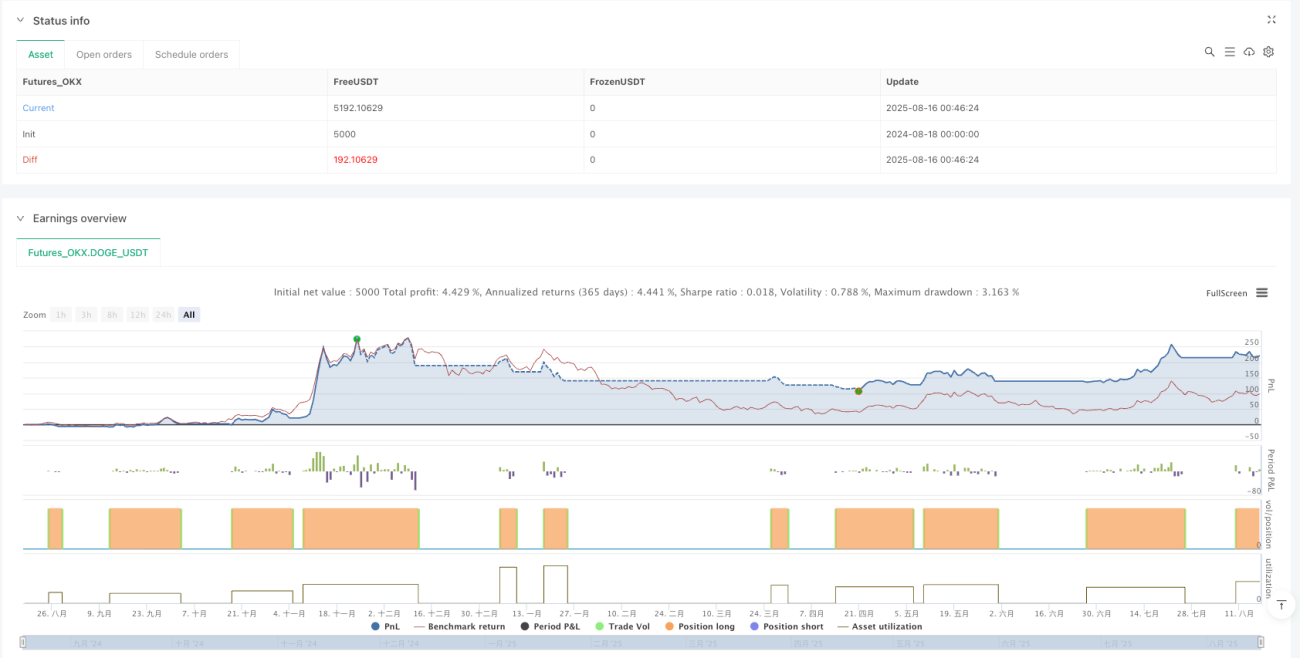
리포트 프로토콜: 정책은 현실적인 회귀로 구성되어 있으며, fill_orders_on_standard_ohlc=true를 사용하여 표준 OHLC 가격에 대한 주문 실행을 모의하고, 특정 역사 기간을 정의하는 설정 가능한 날짜 필터를 포함하여 성능 평가를 수행합니다.
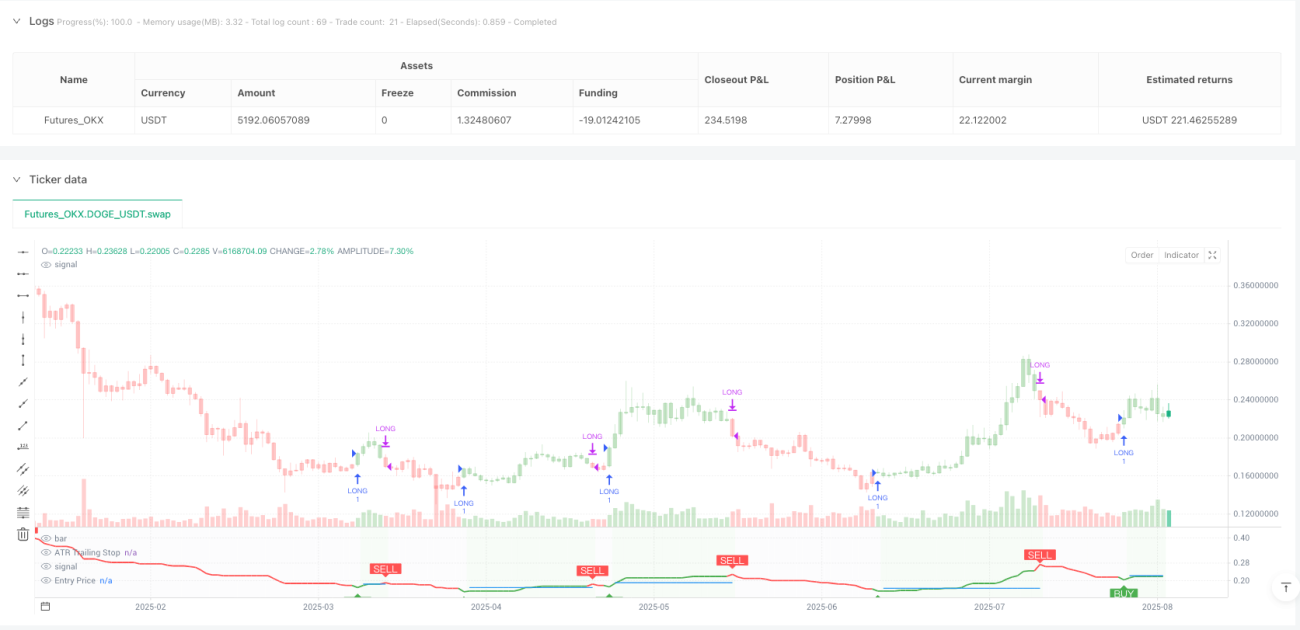
데이터 시각화: 스크립트는 구매/판매 신호를 제공하며, ATR은 스톱로스 및 스톱로스 레벨을 추적하는 차트 중첩과 실시간 전략 매개 변수, 현재 포지션 상태, 트렌드 방향 및 핵심 가격 수준을 보여주는 정보 테이블을 제공합니다.
노이즈 필터링헤이켄 아치 차트 기술은 단기 시장 소음을 효과적으로 필터링하여 거래자가 더 중요한 시장 추세에 집중하고 가짜 신호 방해를 줄일 수 있도록 도와줍니다.
동적 위험 관리ATR 기반의 추적 중지 메커니즘은 시장의 변동성에 따라 자동으로 조정할 수 있으며, 변동이 심할 때 더 느슨한 중단을 제공하며, 변동이 약할 때 보호를 강화하고, 리스크 수익률을 최적화합니다.
객관적인 진입 및 출구 신호: EMA를 통해 교차 생성된 신호는 주관적 판단을 제거하고 거래 결정을 더 체계화하고 반복할 수 있게 하며, 감정적 규율을 유지하는데 도움을 준다.
실제 시장 가격 실행전략: 재검토에서 실제 시장 가격을 사용 하 여 (하이켄 아쉬 합성 가격 대신) 거래 및 중단을 수행 하 고 실제 거래 환경에 더 가깝고 더 정확한 재검토 결과를 제공합니다.
시각적 피드백과 감시통합된 정보 표와 시각적 지표는 실시간 전략 상태와 핵심 데이터 포인트를 제공하여 신속한 평가와 모니터링을 가능하게 하고 의사결정을 강화합니다.
유연한 변수 구성조정 가능한 핵심 매개 변수들: 감수성 값, ATR 주기, 하이켄 아쉬 방법, 그리고 중지 손실 설정) 은 전략이 다른 시장 환경과 거래자의 위험 선호도에 적응할 수 있도록 합니다.
다중 전략 설계위세를 포착하는 데 집중하고 잠재적인 상향 압축 위험을 피하며, 특히 일부 암호화폐와 같은 장기적 인 비관적 인 시장에 적합합니다.
추세 반전 위험: 트렌드 추적 전략으로, 시장이 수평선 또는 급격한 반전 시 큰 회전을 겪을 수 있습니다. ATR 추적 스톱은 이러한 손실을 완전히 방지 할 수 없습니다.
변수 최적화 함수: 과잉 최적화 파라미터는 곡선 적합으로 이어질 수 있으며, 전략은 역사적인 데이터에서 훌륭하게 작동하지만 미래 시장에서 좋지 않습니다. 안정성을 보장하기 위해 여러 시장과 시간 프레임에서 테스트하는 것이 좋습니다.
입시 위험: EMA 교차 신호는 트렌드가 이미 발달한 후기 단계에 나타날 수 있으며, 입구 위치가 바람직하지 않습니다. 강한 시장에서, 이것은 높은 지점에서 구매로 이어질 수 있습니다.
손해배상 트리거 위험: 높은 변동성이 있는 시장에서, 전체적인 추세가 좋은 경우에도, 가격이 일시적으로 중단 수준에 도달하여 불필요한 퇴출을 초래할 수 있습니다. 시장 특성에 따라 조심스럽게 중지 파라미터를 설정해야합니다.
단일 기술 지표 의존전략은 ATR 및 EMA 지표에 주로 의존하고, 기본 요소 또는 다른 기술 지표를 고려하지 않고, 중요한 시장 전환점을 놓칠 수 있습니다.
장기적인 수평 시장 성과: 장기 수평 시장에서, 이 전략은 반복적으로 잘못된 신호를 생성하여 연속적으로 작은 손실이 쌓일 수 있습니다. 시장이 트렌드 상태임을 확인하는 경우에 사용하는 것이 좋습니다.
슬라이드 포인트와 실행 위험: 전략이 재측정에서 미끄러짐을 고려하지만 실제 거래의 미끄러짐과 실행 지연은 설정 값보다 더 클 수 있습니다. 특히 유동성이 낮은 시장에서.
다중 시간 프레임 분석 통합: 상위 시간 프레임의 트렌드 확인 신호를 고려하여 상위 시간 프레임의 트렌드 방향이 일치하는 경우에만 거래를 수행하면 승률과 위험-수익률을 크게 향상시킬 수 있습니다.
변동율 필터: 변동율에 기반한 필터를 추가하고, 비정상적으로 높은 변동이 있을 때 거래를 중지하거나 포지션 크기를 조정하면, 시장의 극단적인 변동으로 인한 위험을 줄일 수 있다.
동적 위치 관리: 고정된 비율 배열이 아닌 변동성 및 시장 상황에 따라 동적으로 포지션 크기를 조정하여 다양한 시장 조건에서 자금 사용 효율을 최적화 할 수 있습니다.
다중 지표 확인: 다른 상호보완적인 기술 지표를 통합하여 상대적으로 약한 지수 RSI, 무작위 지표 또는 MACD와 같은 2 차 확인으로 가짜 신호를 줄이고 거래 품질을 향상시킬 수 있습니다.
손해 방지 전략 개선단순한 비율이나 고정된 점수보다는 ATR의 배수를 추적하거나 지지/저항 수준에 기반한 스톱과 같은 더 복잡한 스톱 전략을 구현하여 시장 구조에 더 잘 적응할 수 있습니다.
출전 전략 정교화: 더 세밀한 부분 수익 및 분기 출장 메커니즘을 개발하여 트렌드 틈새를 유지하면서 부분 수익을 잠금하고 전체 수익 곡선을 최적화 할 수 있습니다.
시장 체제 식별: 시장 체제를 식별하는 알고리즘을 추가하여 다양한 시장 상태에 맞게 전략 파라미터를 자동으로 조정합니다. 트렌드, 흔들림 또는 역전) 전략의 적응력을 향상시킵니다.
기계학습 통합: 기기 학습 기술을 탐색하여 파라미터 선택을 최적화하거나 최적의 입출구를 예측하여 전략 성능을 더욱 향상시키고 주관적 개입을 줄일 수 있습니다.
변동율이 자율적으로 적응하는 하이켄 아쉬 ATR 추적 중지 손실 트렌드 거래 전략은 합리적이고 위험 통제 가능한 트렌드 추적 시스템으로 설계되었으며 특히 변동성이 높은 시장에 적합합니다. 하이켄 아쉬 차트의 노이즈 필터링 기능, ATR의 동적 위험 관리 및 EMA의 트렌드 식별 기능을 결합하여 전략은 객관적이고 체계적인 거래 프레임 워크를 제공합니다.
이 전략의 주요 장점은 시장의 변동에 따라 자동으로 손실 수준을 조정하여 자금을 보호하고 이익을 잠금 할 수 있는 자율적이고 역동적인 위험 관리 능력입니다. 또한, 엄격한 손실 실행과 실제 시장 가격에 기반한 실행 메커니즘은 재검토 결과의 신뢰성과 복제성을 보장합니다.
그러나, 트렌드 추적 전략으로서, 시장이 수평선 또는 급격한 반전 시에는 도전을 받을 수 있다. 다중 시간 프레임 분석을 통합하고, 변동율 필터를 추가하고, 포지션 관리를 최적화하고, 출구 전략을 세밀화하는 등의 개선 조치를 통해 전략의 안정성과 성능을 더욱 강화할 수 있다.
체계화된 거래 방법을 구축하고자 하는 거래자들에게, 이 전략은 개인의 위험 선호와 시장 특성에 따라 사용자 정의 및 확장할 수 있는 견고한 기반을 제공하며, 다양한 시장 환경에서 안정적인 위험 조정 수익을 달성할 수 있는 잠재력을 가지고 있다.
/*backtest
start: 2024-08-18 00:00:00
end: 2025-08-17 00:00:00
period: 1d
basePeriod: 1d
exchanges: [{"eid":"Futures_OKX","currency":"DOGE_USDT","balance":5000}]
*/
//@version=6
strategy(title="Mutanabby_AI | ATR+ | ") // Ensures realistic execution
// 📊 INPUT PARAMETERS
//=============================================================================
a = input.int(1, title="🔧 Key Value (Sensitivity)", minval=1, maxval=10,
tooltip="Lower = More signals, Higher = Fewer signals")
c = input.int(10, title="📈 ATR Period", minval=1, maxval=500,
tooltip="Period for ATR calculation")
// 🕯️ HEIKIN ASHI METHOD SELECTION
//=============================================================================
ha_method = input.string("Manual Calculation", title="🕯️ Heikin Ashi Method",
options=["Manual Calculation", "ticker.heikinashi()", "Regular Candles"],
tooltip="Manual = Most reliable, ticker.heikinashi = Good, Regular = Standard OHLC")
// 🛡️ STOP LOSS SETTINGS
//=============================================================================
use_stop_loss = input.bool(false, title="🛡️ Enable Stop Loss",
tooltip="Enable stop loss at entry price level")
stop_loss_type = input.string("Percentage", title="📊 Stop Loss Type",
options=["Percentage", "Fixed Points"],
tooltip="Choose stop loss calculation method")
stop_loss_percent = input.float(2.0, title="📉 Stop Loss %", minval=0.1, maxval=50.0, step=0.1,
tooltip="Stop loss percentage below entry price")
stop_loss_points = input.float(10.0, title="📉 Stop Loss Points", minval=0.1, step=0.1, tooltip="Stop loss in price points below entry price")
// Date condition
date_condition = true
// 🎨 VISUAL SETTINGS
//=============================================================================
show_signals = input.bool(true, title="🎯 Show Buy/Sell Signals")
show_trailing_stop = input.bool(true, title="📈 Show ATR Trailing Stop")
show_stop_loss = input.bool(true, title="🛡️ Show Stop Loss Line")
show_bar_colors = input.bool(true, title="🎨 Color Bars")
show_position_info = input.bool(true, title="📊 Show Position Info")
// 🧮 HEIKIN ASHI CALCULATIONS
//=============================================================================
// METHOD 1: MANUAL HEIKIN ASHI CALCULATION (MOST RELIABLE)
//=============================================================================
// Manual HA calculation - most transparent and reliable
var float ha_open_manual = na
ha_close_manual = (open + high + low + close) / 4
ha_open_manual := na(ha_open_manual[1]) ? (open + close) / 2 : (ha_open_manual[1] + ha_close_manual[1]) / 2
ha_high_manual = math.max(high, math.max(ha_open_manual, ha_close_manual))
ha_low_manual = math.min(low, math.min(ha_open_manual, ha_close_manual))
// METHOD 2: TICKER.HEIKINASHI() (GOOD ALTERNATIVE)
//=============================================================================
// Get Heikin Ashi data via ticker.heikinashi() - non-repainting
ha_ticker = ticker.heikinashi(syminfo.tickerid)
[ha_open_ticker, ha_high_ticker, ha_low_ticker, ha_close_ticker] = request.security(ha_ticker, timeframe.period, [open[1], high[1], low[1], close[1]], lookahead=barmerge.lookahead_on) // Use confirmed bars to prevent repainting
// METHOD 3: REGULAR CANDLES
//=============================================================================
// Regular OHLC data
ha_open_regular = open
ha_high_regular = high
ha_low_regular = low
ha_close_regular = close
// SELECT METHOD BASED ON USER INPUT
//=============================================================================
src = ha_method == "Manual Calculation" ? ha_close_manual :
ha_method == "ticker.heikinashi()" ? ha_close_ticker : ha_close_regular
source_open = ha_method == "Manual Calculation" ? ha_open_manual :
ha_method == "ticker.heikinashi()" ? ha_open_ticker : ha_open_regular
source_high = ha_method == "Manual Calculation" ? ha_high_manual :
ha_method == "ticker.heikinashi()" ? ha_high_ticker : ha_high_regular
source_low = ha_method == "Manual Calculation" ? ha_low_manual :
ha_method == "ticker.heikinashi()" ? ha_low_ticker : ha_low_regular
// 📊 ATR TRAILING STOP CALCULATION
//=============================================================================
// Calculate True Range using selected method
tr1 = source_high - source_low
tr2 = math.abs(source_high - src[1])
tr3 = math.abs(source_low - src[1])
tr = math.max(tr1, math.max(tr2, tr3))
// ATR calculation
xATR = ta.sma(tr, c)
nLoss = a * xATR
// ATR Trailing Stop logic
var float xATRTrailingStop = na
xATRTrailingStop := if src > nz(xATRTrailingStop[1], 0) and src[1] > nz(xATRTrailingStop[1], 0)
math.max(nz(xATRTrailingStop[1]), src - nLoss)
else if src < nz(xATRTrailingStop[1], 0) and src[1] < nz(xATRTrailingStop[1], 0)
math.min(nz(xATRTrailingStop[1]), src + nLoss)
else if src > nz(xATRTrailingStop[1], 0)
src - nLoss
else
src + nLoss
// Position state tracking
var int pos = na
pos := if src[1] < nz(xATRTrailingStop[1], 0) and src > nz(xATRTrailingStop[1], 0)
1
else if src[1] > nz(xATRTrailingStop[1], 0) and src < nz(xATRTrailingStop[1], 0)
-1
else
nz(pos[1], 0)
// 🎯 SIGNAL GENERATION
//=============================================================================
// EMA for crossover detection
ema_val = ta.ema(src, 1)
// Crossover conditions
above = ta.crossover(ema_val, xATRTrailingStop)
below = ta.crossover(xATRTrailingStop, ema_val)
// Buy and sell signals
buy_signal = src > xATRTrailingStop and above
sell_signal = src < xATRTrailingStop and below
// Trend direction
is_uptrend = src > xATRTrailingStop
is_downtrend = src < xATRTrailingStop
// 🛡️ STOP LOSS CALCULATION
//=============================================================================
var float entry_price = na
var float stop_loss_level = na
// Calculate stop loss level
calculate_stop_loss(entry_price_val) =>
if stop_loss_type == "Percentage"
entry_price_val * (1 - stop_loss_percent / 100)
else
entry_price_val - stop_loss_points
// 📈 LONG ONLY STRATEGY LOGIC
//=============================================================================
var bool in_long_position = false
// Entry condition: Buy signal when not in position
long_entry = buy_signal and date_condition and not in_long_position
// Exit conditions - CRITICAL: Use real prices for stop loss, not HA prices
atr_exit = sell_signal and date_condition and in_long_position
stop_loss_hit = use_stop_loss and in_long_position and low <= stop_loss_level // Uses real low price
// Combined exit condition
long_exit = atr_exit or stop_loss_hit
// Execute trades - Orders execute at REAL market prices
if long_entry
strategy.entry("LONG", strategy.long, comment="🚀 LONG")
in_long_position := true
entry_price := close // REAL entry price, not HA price
stop_loss_level := use_stop_loss ? calculate_stop_loss(entry_price) : na
if long_exit
exit_reason = stop_loss_hit ? "🛡️ STOP LOSS" : "💰 ATR EXIT"
strategy.close("LONG", comment=exit_reason)
in_long_position := false
entry_price := na
stop_loss_level := na
// 🎨 VISUAL ELEMENTS
//=============================================================================
// Trailing stop line color
stop_color = pos == 1 ? color.green : pos == -1 ? color.red : color.blue
// Plot ATR Trailing Stop
plot(show_trailing_stop ? xATRTrailingStop : na,
color=stop_color,
linewidth=2,
title="ATR Trailing Stop")
// Plot Stop Loss Level
plot(show_stop_loss and use_stop_loss and in_long_position ? stop_loss_level : na,
color=color.new(color.red, 0),
linewidth=2,
style=plot.style_linebr,
title="Stop Loss Level")
// Plot buy/sell signals
plotshape(show_signals and buy_signal,
title="Buy Signal",
text="BUY",
style=shape.labelup,
location=location.belowbar,
color=color.new(color.green, 0),
textcolor=color.white,
size=size.small)
plotshape(show_signals and sell_signal,
title="Sell Signal",
text="SELL",
style=shape.labeldown,
location=location.abovebar,
color=color.new(color.red, 0),
textcolor=color.white,
size=size.small)
// Plot stop loss hit signal
plotshape(show_signals and stop_loss_hit,
title="Stop Loss Hit",
text="SL",
style=shape.labeldown,
location=location.abovebar,
color=color.new(color.orange, 0),
textcolor=color.white,
size=size.small)
// Bar coloring
barcolor(show_bar_colors ? (is_uptrend ? color.new(color.green, 70) :
is_downtrend ? color.new(color.red, 70) : na) : na)
// Position status background
bgcolor(show_position_info and strategy.position_size > 0 ? color.new(color.green, 95) : show_position_info and strategy.position_size == 0 ? color.new(color.gray, 98) : na, title="Position Status")
// Entry price line - shows REAL entry price
plot(show_position_info and strategy.position_size > 0 ? strategy.position_avg_price : na,
color=color.new(color.blue, 0),
linewidth=1,
style=plot.style_linebr,
title="Entry Price")
// 📊 INFORMATION TABLE
//=============================================================================
if show_position_info and barstate.islast
var table info_table = table.new(position.top_right, 3, 11,
bgcolor=color.white,
border_width=1,
border_color=color.gray,
frame_width=1,
frame_color=color.black)
// Table headers
table.cell(info_table, 0, 0, "Mutanabby_AI | Manual HA | ATR | SL", text_color=color.white, bgcolor=color.blue, text_size=size.small)
table.cell(info_table, 1, 0, "", text_color=color.white, bgcolor=color.blue)
table.cell(info_table, 2, 0, "", text_color=color.white, bgcolor=color.blue)
// Strategy info
table.cell(info_table, 0, 1, "HA Method:", text_color=color.rgb(10, 10, 10), text_size=size.small)
method_color = ha_method == "Manual Calculation" ? color.green :
ha_method == "ticker.heikinashi()" ? color.blue : color.gray
table.cell(info_table, 1, 1, ha_method, text_color=method_color, text_size=size.small)
table.cell(info_table, 0, 2, "Key Value:", text_color=color.rgb(10, 10, 10), text_size=size.small)
table.cell(info_table, 1, 2, str.tostring(a), text_color=color.blue, text_size=size.small)
table.cell(info_table, 0, 3, "ATR Period:", text_color=color.rgb(2, 2, 2), text_size=size.small)
table.cell(info_table, 1, 3, str.tostring(c), text_color=color.blue, text_size=size.small)
table.cell(info_table, 0, 4, "Stop Loss:", text_color=color.rgb(3, 3, 3), text_size=size.small)
table.cell(info_table, 1, 4, use_stop_loss ? "ON" : "OFF",
text_color=use_stop_loss ? color.green : color.gray, text_size=size.small)
table.cell(info_table, 0, 5, "Position:", text_color=color.rgb(3, 3, 3), text_size=size.small)
table.cell(info_table, 1, 5, strategy.position_size > 0 ? "LONG" : "NONE",
text_color=strategy.position_size > 0 ? color.green : color.gray, text_size=size.small)
table.cell(info_table, 0, 6, "Trend:", text_color=color.rgb(0, 0, 0), text_size=size.small)
table.cell(info_table, 1, 6, is_uptrend ? "UP" : "DOWN",
text_color=is_uptrend ? color.green : color.red, text_size=size.small)
table.cell(info_table, 0, 7, "Current Price:", text_color=color.black, text_size=size.small)
table.cell(info_table, 1, 7, str.tostring(close, "#.##"), text_color=color.black, text_size=size.small)
table.cell(info_table, 0, 8, "Trailing Stop:", text_color=color.black, text_size=size.small)
table.cell(info_table, 1, 8, str.tostring(xATRTrailingStop, "#.##"), text_color=color.blue, text_size=size.small)
// Show stop loss level if enabled and in position
if use_stop_loss and in_long_position
table.cell(info_table, 0, 9, "Stop Loss:", text_color=color.black, text_size=size.small)
table.cell(info_table, 1, 9, str.tostring(stop_loss_level, "#.##"), text_color=color.red, text_size=size.small)
else
table.cell(info_table, 0, 9, "Stop Loss:", text_color=color.black, text_size=size.small)
table.cell(info_table, 1, 9, "N/A", text_color=color.gray, text_size=size.small)
table.cell(info_table, 0, 10, "Last Signal:", text_color=color.black, text_size=size.small)
signal_text = buy_signal ? "BUY" : sell_signal ? "SELL" : stop_loss_hit ? "STOP LOSS" : "NONE"
signal_color = buy_signal ? color.green : sell_signal ? color.red : stop_loss_hit ? color.orange : color.gray
table.cell(info_table, 1, 10, signal_text, text_color=signal_color, text_size=size.small)
// 🚨 ALERTS
//=============================================================================
// Alert conditions
alertcondition(buy_signal, title="🚀 Mutanabby_AI | ATR+ LONG Entry",
message="Mutanabby_AI | ATR+ : BUY signal at {{close}}")
alertcondition(sell_signal, title="💰 Mutanabby_AI | ATR+ LONG Exit",
message="Mutanabby_AI | ATR+ : SELL signal at {{close}}")
alertcondition(stop_loss_hit, title="🛡️ Mutanabby_AI | ATR+ Stop Loss Hit",
message="Mutanabby_AI | ATR+ : STOP LOSS hit at {{close}}")
alertcondition(buy_signal or sell_signal or stop_loss_hit, title="🔔 Mutanabby_AI | ATR+ Any Signal",
message="Mutanabby_AI| ATR+ : {{ticker}} - {{close}} - Signal: {{strategy.position_size > 0 ? 'EXIT' : 'ENTRY'}}")
//=============================================================================
// 📝 STRATEGY NOTES:
//
// 🎯 OPTIMAL IMPLEMENTATION for realistic backtesting:
// 📈 Uses manual HA calculation for transparency and reliability
// 💰 Orders execute at REAL market prices (not synthetic HA prices)
// 🛡️ Stop loss uses real market prices for accurate risk management
// 🔧 Multiple HA methods available for comparison and validation
// ⚡ Added fill_orders_on_standard_ohlc=true for extra protection
//
// 🎯 METHOD COMPARISON:
// 🥇 Manual Calculation: Most reliable, transparent, no external dependencies
// 🥈 ticker.heikinashi(): Good alternative, uses confirmed bars to prevent repainting
// 🥉 Regular Candles: Standard OHLC for comparison purposes
//
// 💡 BEST PRACTICES IMPLEMENTED:
// ✅ Always run on regular candlestick charts (not native HA charts)
// ✅ Use confirmed/historical HA values to prevent repainting
// ✅ Execute all orders at real market prices
// ✅ Stop loss based on real prices, not synthetic HA prices
// ✅ Entry price tracking uses actual fill prices
// ✅ Transparent calculation methods for verification
//
// 🚨 AVOID:
// ❌ Running strategies directly on TradingView's native HA charts
// ❌ Using current bar HA values (causes repainting)
// ❌ Stop loss based on HA prices instead of real prices
//=============================================================================