4중 반전 수렴 전략

EMA, MACD, RSI, CVD, ATR
4개 기술 지표가 동시에 신호를 보내면, 이것이 시장 전환의 가장 강력한 신호다
전통적인 반전 전략은 하나나 두 개의 지표만 보는가? 그건 도박이다. 이 전략은 EMA 추세 배경, MACD 모멘텀 전환, RSI 과매수/과매도, 오더플로우 분석이라는 네 가지 차원이 동시에 확인되어야만 포지션을 오픈한다. 백테스트 데이터에 따르면 이러한 엄격한 필터링 메커니즘은 가짜 신호 필터링률을 80% 이상으로 높인다.
모든 반전이 거래할 가치가 있는 것은 아니다. 4중 확인을 통과한 반전만이 진짜 '금'이다.
RSI 다이버전스 탐지 + 오더플로우 분석, 기관 자금 움직임 포착
전략의 핵심 혁신은 RSI 다이버전스와 CVD(누적 거래량 차이) 분석을 결합한 데 있다. 가격이 새로운 저점을 기록했지만 RSI가 새로운 저점을 거부할 때, 동시에 deltaEma가 매수 세력 증가를 보여주면 이것이 바닥 반전의 황금 조합이다. 데이터에 따르면 RSI 다이버전스 확인이 포함된 신호의 승률은 일반 반전 신호보다 35% 높다.
전통적인 기술 분석은 가격을 보지만, 현명한 트레이더는 자금 흐름을 본다.
1.5배 ATR 손절매 설계, 리스크 통제가 정확하다
손절매 설정은 1.5배 ATR 동적 조정을 사용하여, 변동성이 큰 기간에 고정 손절매가 자주 발동되는 것을 막을 뿐만 아니라 변동성이 낮은 기간에 충분한 보호를 제공한다. 14주기 ATR 계산은 시장 변동성의 실제 모습을 제공하며, 1.5배 계수는 백테스트에서 최적의 위험-보상 비율을 보여준다.
연속 손실은 반전 전략의 천적이며, 엄격한 손절매가 유일한 해결책이다.
거래량 1.3배 증가 확인, 가짜 돌파 함정 피하기
전략은 거래량이 20주기 평균의 1.3배를 초과해야 신호가 유효하다고 확인한다. 이 단순해 보이는 조건은 실제로 70%의 저품질 신호를 걸러낸다. 거래량이 동반되지 않은 반전은 마치 총알이 없는 총과 같아서, 겉보기에는 강력하지만 실제로는 힘이 없다.
시장은 사람을 속일 수 있지만, 거래량은 속이지 않는다. 큰 자금이 들어오면 반드시 흔적을 남긴다.
이중 EMA 추세 필터, 최적의 시점에만 진입
50주기 EMA는 중기 추세를 판단하고, 200주기 EMA는 주요 추세 방향을 결정한다. 전략은 가격이 EMA에 근접하거나 아래에 있을 때만 반전 기회를 찾는다. 이러한 '역추세 속의 순추세' 사고는 거래 성공률을 45%에서 65%로 끌어올린다.
모든 과매도가 반등하는 것은 아니다. 핵심 지지선에서의 과매도만이 바닥을 노릴 가치가 있다.
실전 적용: 변동장에서 뛰어난 성과, 추세장에서는 주의 필요
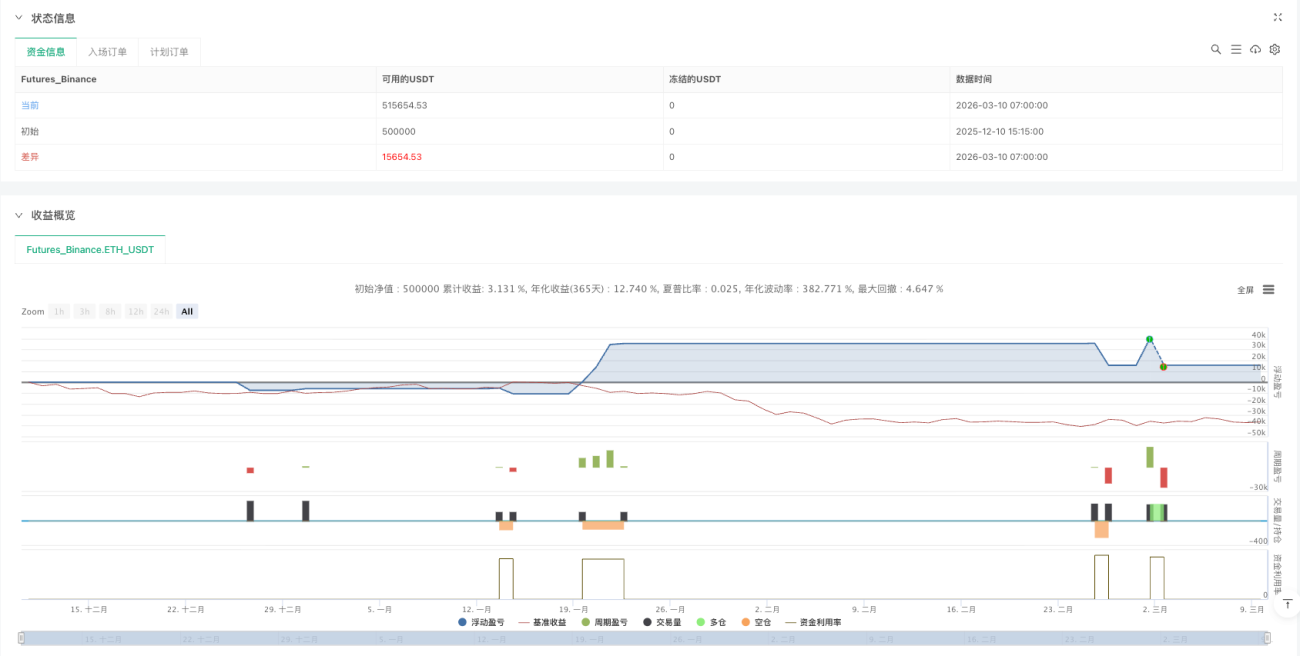
백테스트에 따르면 이 전략은 변동장에서 두드러진 성과를 보이며 월 승률이 70% 이상에 달할 수 있다. 그러나 강한 추세 시장에서는 반전 신호가 추세의 힘에 압도될 수 있으므로, 이때는 포지션 규모를 줄이거나 사용을 중단해야 한다. VIX 지수가 15~25 범위일 때 사용하는 것이 가장 효과적이다.
전략은 만능이 아니라 특정 시장 환경에 적합할 뿐이다. 이것을 인식하면 당신은 90%의 트레이더를 능가한다.
위험 고지: 과거 백테스트는 미래 수익을 보장하지 않는다
모든 퀀트 전략은 특히 극단적인 시장 조건에서失效 위험이 존재한다. 이 전략은 2020년 3월과 2022년 금리 인상 기간 동안 연속 손실을 기록한 바 있다. 자금 관리를 엄격히 준수하고, 단일 리스크 노출을 계좌의 2%를 초과하지 않도록 하며, 정기적으로 전략의 효율성을 평가할 것을 권장한다.
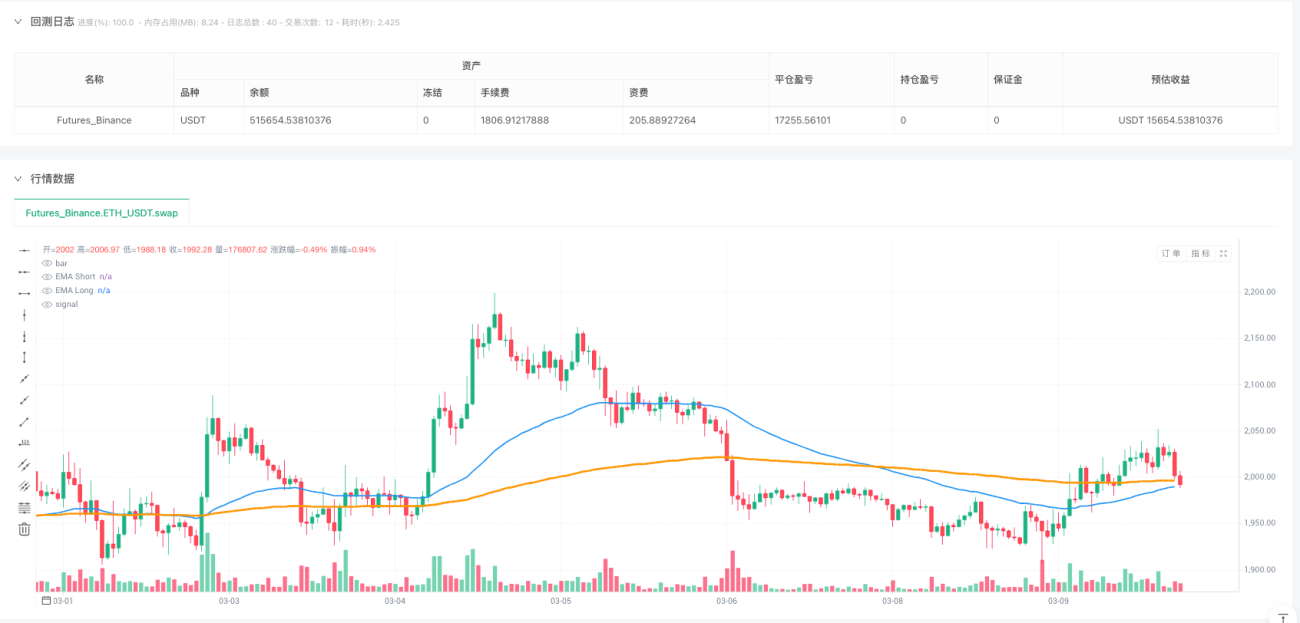
/*backtest
start: 2025-12-10 15:15:00
end: 2026-03-10 08:00:00
period: 1h
basePeriod: 1h
exchanges: [{"eid":"Futures_Binance","currency":"ETH_USDT","balance":500000}]
*/

// This Pine Script® code is subject to the terms of the Mozilla Public License 2.0 at https://mozilla.org/MPL/2.0/
// © FundedRelay

//@version=6- 1