Triple Super Trend Kuantitatif Strategi Perdagangan

1
Follow
1778
Followers
Gambaran keseluruhan
Strategi perdagangan kuantitatif triple overtrend adalah strategi perdagangan garis pendek yang menggabungkan tiga indikator overtrend. Strategi ini sesuai untuk perdagangan dalam sehari dan short-line arbitraj di pasaran perdagangan frekuensi tinggi seperti cryptocurrency, forex dan lain-lain.
Prinsip Strategi
- Menggunakan purata bergerak 200 hari untuk menentukan arah trend pasaran keseluruhan. Harga lebih tinggi apabila naik, harga lebih rendah apabila turun.
- Menggunakan tiga petanda super trend untuk menentukan arah trend segmen pasaran. Petanda super trend dapat menentukan dengan tepat trend overhead segmen pasaran.
- Menggunakan tanda Brin untuk menilai overbought dan oversold untuk membina isyarat masuk. RSI Stoch dapat mengenal pasti peluang untuk berbalik.
- Berdasarkan stop loss overtrend, stop stop overtrend menentukan nisbah pulangan risiko sebanyak 1.5 kali ganda.
Kelebihan Strategik
- Memeriksa pelbagai indikator trend untuk meningkatkan ketepatan keputusan.
- Indikator Overbought dan Oversold mengenal pasti peluang untuk berbalik dan mengambil inisiatif untuk berbalik.
- Pencegahan kerugian mekanisme kawalan nisbah risiko dan keuntungan.
- Ia juga boleh digunakan untuk perdagangan frekuensi rendah dan mempunyai ruang untuk keuntungan yang besar.
Risiko Strategik
- Apabila keadaan kitaran besar tidak baik, risiko kerugian dalam perdagangan garis pendek lebih besar.
- Namun begitu, peluang untuk gagal dalam proses ini masih ada, dan ia boleh menyebabkan keputusan yang salah.
- Ia memerlukan pembiayaan yang kerap dan tidak sesuai untuk perdagangan luar lapangan.
Pengoptimuman Strategi
- Optimumkan parameter purata bergerak untuk tempoh yang lebih lama.
- Optimumkan parameter Stoch RSI untuk mengurangkan kadar isyarat salah.
- Mengoptimumkan parameter kitaran ATR melampaui trend untuk meningkatkan kesan hentikan kerugian.
- Menambah pengurusan kedudukan, meningkatkan kedudukan mengikut kadar penarikan balik
ringkaskan
Strategi perdagangan kuantitatif triple overtrend, menggunakan pengesahan indikator trend ganda untuk meningkatkan ketepatan keputusan, menghentikan stop loss dan mengawal nisbah keuntungan risiko, sesuai untuk perdagangan garis pendek frekuensi tinggi. Parameter pengoptimuman boleh disesuaikan dengan kitaran perdagangan yang lebih lama, mengurangkan kebarangkalian isyarat yang salah, meningkatkan kesan stop loss.
Source
Pine
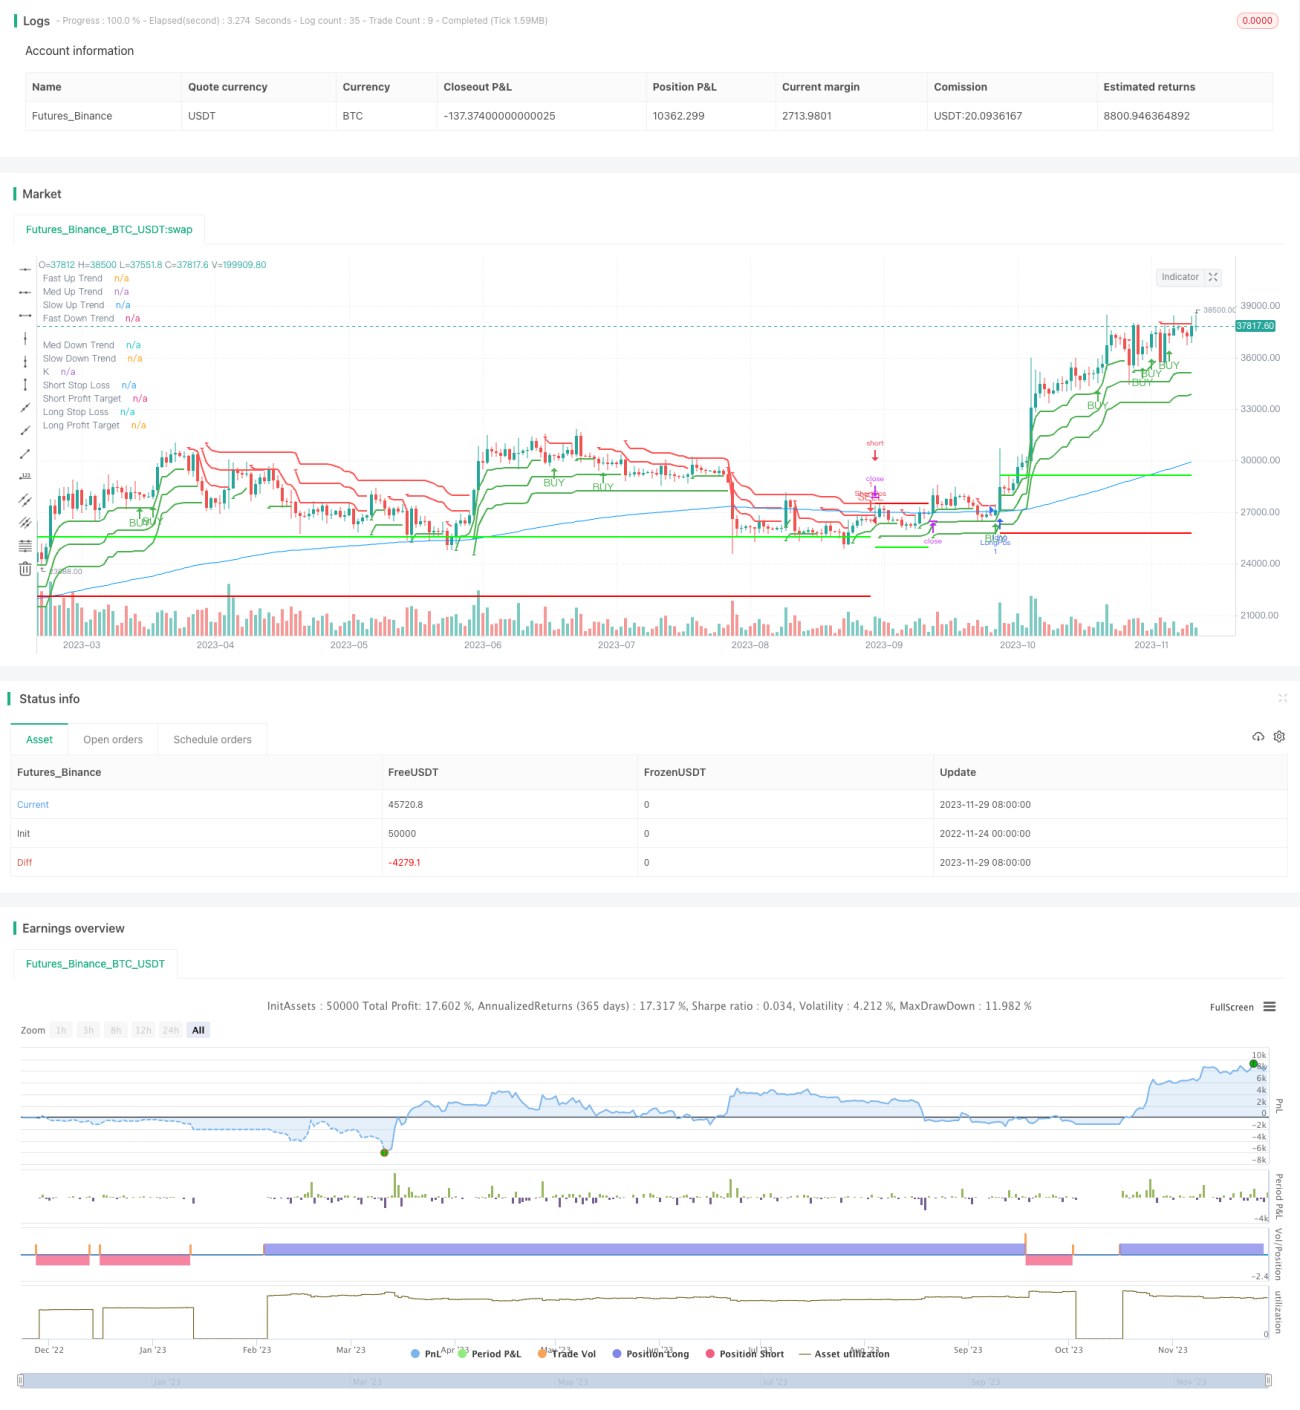
/*backtest
start: 2022-11-24 00:00:00
end: 2023-11-30 00:00:00
period: 1d
basePeriod: 1h
exchanges: [{"eid":"Futures_Binance","currency":"BTC_USDT"}]
*/

//@version=4
strategy("3x SuperTrend Strategy (Mel0nTek) V1", calc_on_every_tick=true, overlay=true)

// ***************************************************Strategy parameters
Related strategies
Comment
All comments (0)
No data
- 1