Strategi Penunjuk Indeks Pedagang Dinamik
Gambaran keseluruhan
Strategi ini didasarkan pada indikator TDI dan saluran tindakan harga (PAC), yang digabungkan dengan saluran Brin dan RSI dan MACD untuk mewujudkan sistem trend.
Strategi ini digunakan terutamanya untuk mencari trend dan menghasilkan isyarat perdagangan apabila terdapat perubahan besar dalam arah trend. Ia menggabungkan beberapa petunjuk yang bertujuan untuk meningkatkan kadar reproduksi dan kualiti isyarat.
Prinsip Strategi
Pusat strategi ini adalah TDI. TDI terdiri daripada beberapa sub-indikator yang diletakkan di atasnya, terutamanya:
- Indeks Relatif Kuat (RSI): Kekuatan lemah harga tindak balas
- Brin Belt: Julat pergerakan harga tindak balas
- Garis harga RSI: purata bergerak sederhana RSI, yang mencerminkan trend harga RSI
- Garis isyarat perdagangan RSI: satu lagi purata bergerak mudah RSI yang digunakan untuk menghasilkan isyarat perdagangan
Apabila garis harga RSI dan garis isyarat perdagangan RSI muncul di titik silang emas, ia memberi isyarat beli; apabila kedua-dua garis muncul di titik silang mati, ia memberi isyarat jual. Laluan isyarat perdagangan yang melintasi garis tengah juga akan menghasilkan isyarat yang lebih lemah.
Selain itu, strategi ini juga menggabungkan indikator saluran tindakan harga. Indikator ini mengira saluran harga berdasarkan harga tertinggi dan terendah dalam tempoh masa.
Untuk menyaring maklumat yang salah, strategi ini juga memperkenalkan penunjuk MACD. Isyarat masuk akan dicetuskan hanya apabila warna tiang MACD sesuai dengan arah isyarat perdagangan.
Kelebihan Strategik
Strategi ini merangkumi beberapa kelebihan berbanding satu indikator:
- TDI lebih sensitif terhadap perubahan trend
- Saluran tindakan harga jelas mencerminkan sokongan dan tekanan
- MACD boleh menyaring laporan palsu
Selain itu, TDI lebih sensitif terhadap perubahan trend berbanding penunjuk trend seperti purata bergerak, yang dapat mengurangkan kerugian yang tidak perlu.
Strategi ini juga boleh disesuaikan dengan parameter untuk menyesuaikan diri dengan keadaan pasaran yang berbeza.
Risiko Strategik
- Tambah-tambah indeks, parameter yang sukar untuk disesuaikan
- Frekuensi dagangan mungkin terlalu tinggi, meningkatkan kos dagangan dan risiko tergelincir
- Pengiktirafan reverse tidak 100% tepat dan mungkin terlepas trend harga untuk terus bergerak ke satu arah
- Perubahan harga dalam perdagangan dalam talian jauh lebih rumit daripada pengesanan semula, dan kesan isyarat sukar untuk ditiru
Peningkatan kerugian tunggal boleh dilakukan dengan memperluaskan had stop loss. Kualiti isyarat dapat dipertingkatkan dengan mengoptimumkan kombinasi parameter. Keadaan kemasukan yang sesuai dapat dikurangkan dengan mengurangkan frekuensi perdagangan.
Arah pengoptimuman
- Menyesuaikan parameter TDI untuk mencari kombinasi terbaik
- Menyesuaikan panjang saluran tindakan harga dan mengoptimumkan pengenalan rintangan sokongan
- Sesuaikan parameter MACD untuk mengoptimumkan penapisan kemasukan
- Menambah pengurusan kedudukan dan strategi hentian bergerak
ringkaskan
Strategi ini menggunakan pelbagai indikator untuk menilai trend dan peluang untuk membalikkannya. Ia boleh disesuaikan dengan parameter untuk menyesuaikan diri dengan pelbagai jenis. Ia mempunyai nilai pertempuran yang tertentu, tetapi kesan isyarat yang hampir sempurna masih sukar.
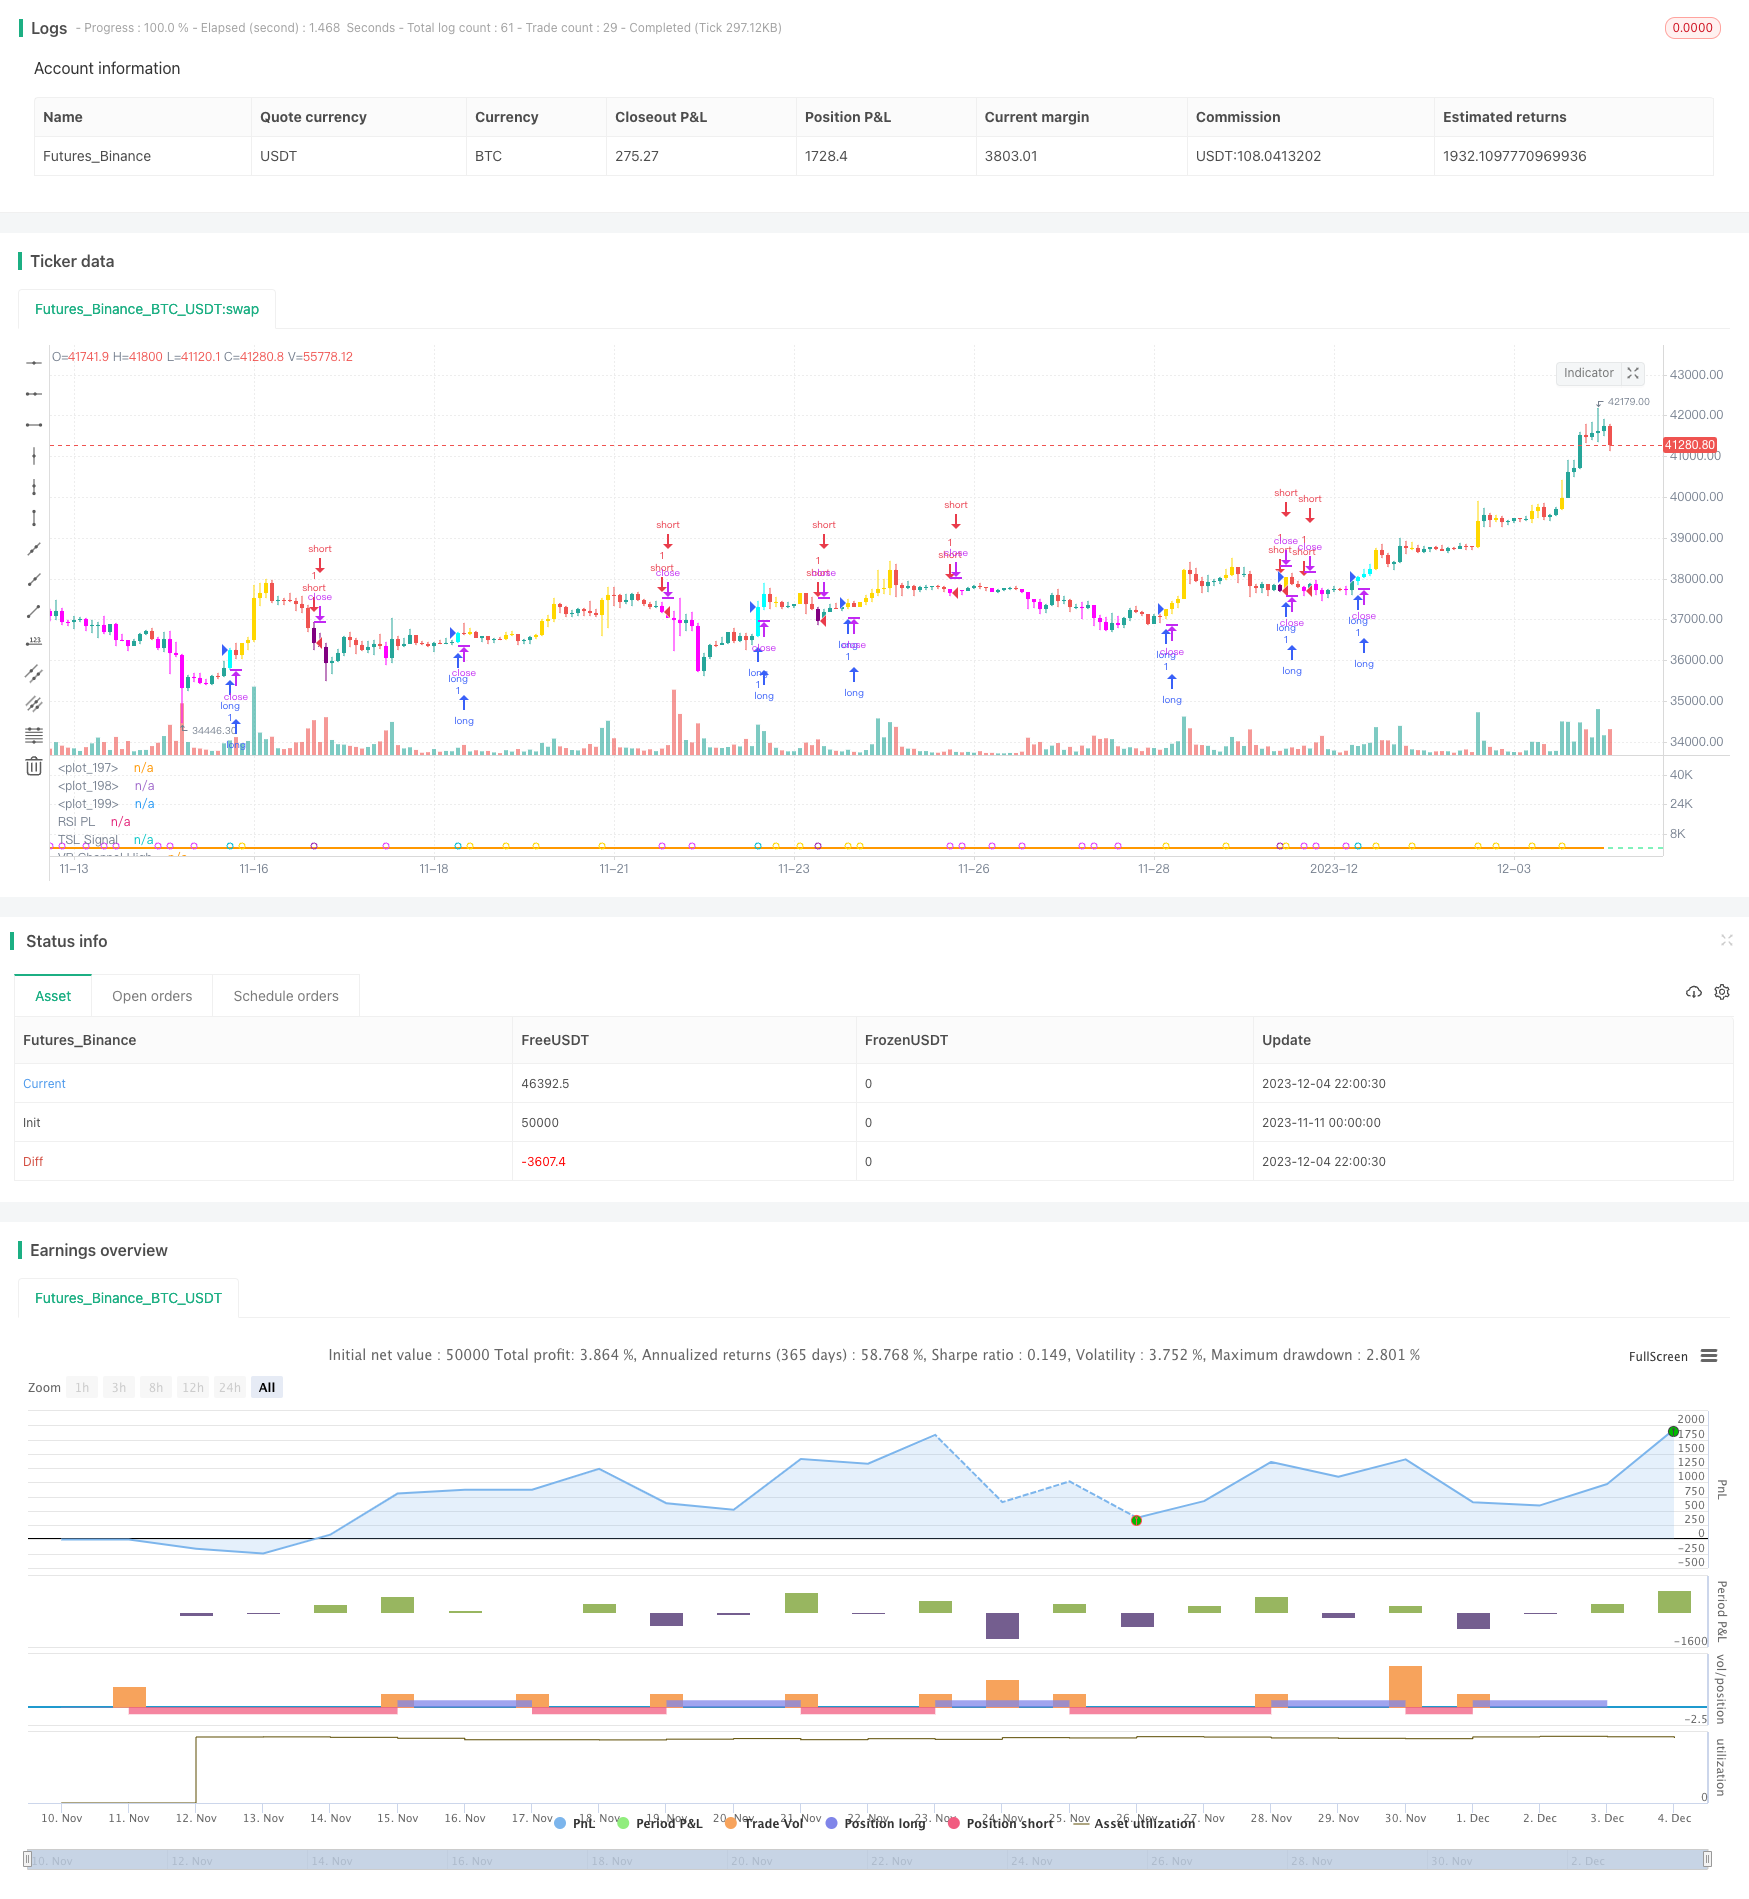
/*backtest
start: 2023-11-11 00:00:00
end: 2023-12-05 00:00:00
period: 2h
basePeriod: 15m
exchanges: [{"eid":"Futures_Binance","currency":"BTC_USDT"}]
*/

//@version=4
//

strategy("[BACKTEST]Traders Dynamic Index Indicator Alert by JustUncleL", shorttitle="[BACKTEST]TDIALT")

//
// author: JustUncleL
// date: 10-Oct-2019
//
// Description:
//   This script is a "strategy" version of the "Traders Dynamic Index Indicator Alert v0.1 by JustUncleL"
//   made available for backtesting to help optimize settings.
//
//   This is a Trend following system utilising the Traders Dynamic Index (TDI),
//   Price Action Channel (PAC) and Heikin Ashi candles.
//   About while ago I came across the use of TDI in "E.A.S.Y. Method" that I found in
//   forexfactory forums: http://www.forexfactory.com/attachment.php?attachmentid=686629&d=1303831008
//   and I was able to set up a chart based on the specifications by using Kurbelklaus scripts.
//   However, I found that the alerts were being generated one or two bars too late,
//   so I was not successful using it with Binary Options. Later I found a variation of the
//   method in the forums which generates alerts a bit earlier, so this indicator is a
//   variation of that early detection version.
//   The indicator can optionally use Heikin  Ashi candles only for all it's calculations,
//   I would recommend viewing the chart with normal Heikin Ashi candles, these
//   smooth out the trends and makes them more visible.
//
//   I found that this metod it works OK with currency pairs or commodities.
//   It also seems to work well with 5min+ timeframe charts,
//   and for Binary Options I would suggest expiry of 2 to 6 candles.
//
//   ALERT GENERATION:
//   =================
//
//   The TDI (Traders Dynamic Index)
//   -------------------------------
//   Volatility Band VB(34), color: Blue, buffer: UpZone, DnZone
//   Relative Strength Index RSI(13)
//   RSI PRICE LINE (2), color: Green, buffer: mab
//   RSI TRADE SIGNAL LINE (7), color: Red, buffer: mbb
//   MARKET BASE LINE MID VB(34), color: Orange, buffer: mid
//
//   Indicator SignalLevels:
//   -----------------------
//   RSI_OversoldLevel : 22 (normally: 32)
//   RSI_OverboughtLevel : 78 (normally: 68)
//
//   Alert Conditions:
//   -----------------
//   Strong Buy (yellow): HIGH>PAC upper && BULL Candle && Candle High>PAC High && RSI>TRADE SIGNAL LINE && RSI>RSI_OversoldLevel &&
//                        && RSI<RSI_OverboughtLevel && TRADE SIGNAL LINE> MARKET BASE LINE
//   Medium Buy (aqua): HIGH>PAC upper && BULL Candle && Candle High>PAC High && RSI>TRADE SIGNAL LINE && RSI>RSI_OversoldLevel
//                        && RSI<RSI_OverboughtLevel && RSI> MARKET BASE LINE && TRADE SIGNAL LINE< MARKET BASE LINE
//   Weak Buy (blue):   HIGH>PAC upper && BULL Candle && Candle High>PAC High && RSI>TRADE SIGNAL LINE && RSI>RSI_OversoldLevel
//                        && RSI<RSI_OverboughtLevel && TRADE SIGNAL LINE<MARKET BASE LINE && RSI< MARKET BASE LINE
//
//   Strong Sell (fuchsia): LOW<PAC lower && BEAR Candle && Candle Low>PAC Low && RSI<TRADE SIGNAL LINE && RSI>RSI_OversoldLevel
//                        && RSI<RSI_OverboughtLevel && TRADE SIGNAL LINE< MARKET BASE LINE
//   Medium Sell (purple): LOW<PAC lower && BEAR Candle && Candle Low>PAC Low && RSI<TRADE SIGNAL LINE && RSI>RSI_OversoldLevel
//                           && RSI<RSI_OverboughtLevel && RSI< MARKET BASE LINE && TRADE SIGNAL LINE> MARKET BASE LINE
//   Weak Sell (black): LOW<PAC lower && BEAR Candle && Candle Low>PAC Low && RSI<TRADE SIGNAL LINE && RSI>RSI_OversoldLevel
//                        && RSI<RSI_OverboughtLevel && TRADE SIGNAL LINE> MARKET BASE LINE && RSI> MARKET BASE LINE
//
//   HIGH LEVEL FILTER (Overbought): RSI>=RSI_OverboughtLevel or MACD Histogram not green
//   LOW LEVEL FILTER (Oversold): RSI<=RSI_OversoldLevel or MACD Histogram not red
//
//   Hints on How to use:
//   --------------------
//   - When a Medium or Strong alert is generated and MACD histogram colour matches the direction
//     of the alert, then place trade in direction of alert candle and MACD.
//   - Use the multi-Hull MA's for trend direction confirmation.
//   - Best positions occur near the MACD(8,16,1) Histogram crossing the zero line.
//   - The optional coloured Dots along the bottom of the indicator represent the first alert
//     of this type that was generated in this sequence.
//   - It is advisable to trade in the direction of the main trend as indicated the HULL MA red cloud:
//     if red cloud underneath PAC then BULLISH trend, if red cloud above PAC then BEARISH trend.
//   - Selecting the HeiKin Ashi candles does affect the MACD and MA caculations, so if you select
//     normal candles the result chart will change. Although the TDI calculations and alerts will stay the
//     same.
//   - When using the Heikin Ashi candles, a good buy entry is indicated by long top wick and no bottom wick
//     for bull (green) candles and good sell entry is indicated by long bottom wick and no top wick for
//     bear (red) candles.
//   - When the MACD histogram is flat and close to zero line,
//     this indicates a ranging market, do NOT trade when this occurs.
//   - When the PAC channel on the main chart is spread apart widely, this is an indication
//     of extreme volitity and choppy chart, do NOT try to trade during these periods.
//     A choppy chart is also indicated by Heikin Ashi candles with long wicks on both sides
//     of the candles.
//   - You can specify what strength level Alerts are generated (default 2):
//     Level (1) means only generate Strong Alerts only.
//     Level (2) means generate Strong and Medium Alerts.
//     Level (3) means generate Strong, Medium and Weak Alerts.
//
//   Modifications:
//   --------------
//     11-Oct-2019
//          - Strategy Version for backtesting created.
//          - Converted to Pinescript V4
//
//     1.3  7-Aug-2017
//          - Modified Alertcondition code so that it only signals on the last completed alerted
//            candle. This should prevent some false alerts and multiple alerts being generated.
//            When setting alarms I suggest using Frequency "Once per bar (on condition)" to get
//            the earliest signal possible.
//          - Added optional alert long/short spikes that only occur on the first Long or Short//      Original code @author LazyBear for basic TDI indicator.

//            signals.
//     1.2  5-Aug-2017:
//          - Added new alerts for Buy and Sell (Long and Short) signals seperately.
//          - Upgraded to version 3 Pinescript.
//          - Added work around patch for opaque bar colouring issue.
//
//     1.1  - Modified code so when viewing Top chart with Heikin Ashi candles, calculations
//            are still based on standard candles, unless Heikin Ashi calculation option selected.
//
//     0.2  - Simplified MACD direction calculation to use just rising/falling.
//     0.1  - Oroginal Version
//   References:
//   -----------
//      Traders Dynamic Index [LazyBear]
//      KK_Traders Dynamic Index_Bar Highlighting by Kurbelklaus
//      KK_Price Action Channel (TDI BH) by Kurbelklaus
//      http://www.forexfactory.com/attachment.php?attachmentid=686629&d=1303831008
//      http://www.forexstrategiesresources.com/trading-system-metatrader-4-iv/504-traders-dynamic-index-how-to-use/
//      http://www.forexfactory.com/showthread.php?t=460148
//      http://www.forexstrategiesresources.com/scalping-forex-strategies-ii/205-scalping-with-tdi-real-macd-stochrainbow/
//
// -----------------------------------------------------------------------------
// Copyright 2016, 2017, 2019 JustUncleL
//
// This program is free software: you can redistribute it and/or modify
// it under the terms of the GNU General Public License as published by
// the Free Software Foundation, either version 3 of the License, or
// any later version.
//
// This program is distributed in the hope that it will be useful,
// but WITHOUT ANY WARRANTY; without even the implied warranty of
// MERCHANTABILITY or FITNESS FOR A PARTICULAR PURPOSE.  See the
// GNU General Public License for more details.
//
// The GNU General Public License can be found here
// <http://www.gnu.org/licenses/>.
//
// -----------------------------------------------------------------------------
//

//
lengthrsi = input(13)
lengthband = input(34)
lengthrsipl = input(2)
lengthtradesl = input(7)
lenH = input(5, minval=1, title="Price Action Channel Length")
lenL = lenH
rsiOSL = input(22, minval=0, maxval=49, title="RSI Oversold Level")
rsiOBL = input(78, minval=51, maxval=100, title="RSI Overbought Level")
strength = input(2, minval=1, maxval=3, step=1, title="Strength Level: (1)Strong (2)Medium (3)All")
sgb = input(false, title="Check Box To Turn Bars Gray")
sbr = input(true, title="Highlight TDI Alert Bars")
sal = input(true, title="Show Alert Condition Status")
uha = input(false, title="Use Heikin Ashi Candles for Calculations")
//

// Constants colours that include fully non-transparent option.
blue100 = #0000FFFF
aqua100 = #00FFFFFF
fuchsia100 = #FF00FFFF
purple100 = #800080FF
gray100 = #808080FF
gold100 = #FFD700FF
white100 = #FFFFFFFF
black100 = #000000FF
gold = #FFD700


// Use only Heikinashi Candles for all calculations or use Standard Candles for calculations.
security_1 = security(heikinashi(syminfo.tickerid), timeframe.period, close)
security_2 = security(syminfo.ticker, timeframe.period, close)
srcClose = uha ? security_1 : security_2
security_3 = security(heikinashi(syminfo.tickerid), timeframe.period, open)
security_4 = security(syminfo.ticker, timeframe.period, open)
srcOpen = uha ? security_3 : security_4
security_5 = security(heikinashi(syminfo.tickerid), timeframe.period, high)
security_6 = security(syminfo.ticker, timeframe.period, high)
srcHigh = uha ? security_5 : security_6
security_7 = security(heikinashi(syminfo.tickerid), timeframe.period, low)
security_8 = security(syminfo.ticker, timeframe.period, low)
srcLow = uha ? security_7 : security_8
//
r = rsi(srcClose, lengthrsi)
ma = sma(r, lengthband)
offs = 1.6185 * stdev(r, lengthband)
upZone = ma + offs
dnZone = ma - offs
mid = (upZone + dnZone) / 2
mab = sma(r, lengthrsipl)
mbb = sma(r, lengthtradesl)
//
hline(rsiOSL, color=color.red, linewidth=1)
hline(50, color=color.black, linewidth=1)
hline(rsiOBL, color=color.lime, linewidth=1)
// Plot the TDI
upl = plot(upZone, color=color.blue, title="VB Channel High", linewidth=2)
dnl = plot(dnZone, color=color.blue, title="VB Channel Low", linewidth=2)
midl = plot(mid, color=color.orange, linewidth=2, title="MBL")
mabl = plot(mab, color=color.green, linewidth=2, title="RSI PL")
mbbl = plot(mbb, color=color.red, linewidth=2, title="TSL Signal")
//
//create RSI TSL cloud to indicate trend direction.
fill(mabl, mbbl, color=mab > mbb ? color.green : color.red, transp=90)

// Calculate Price Action Channel (PAC)
smmaH = 0.0
smmaL = 0.0
sma_1 = sma(srcHigh, lenH)
smmaH := na(smmaH[1]) ? sma_1 : (smmaH[1] * (lenH - 1) + srcHigh) / lenH
sma_2 = sma(srcLow, lenL)
smmaL := na(smmaL[1]) ? sma_2 : (smmaL[1] * (lenL - 1) + srcLow) / lenL
//
umacd = input(false, title="Use MACD Filtering")
fastMA = input(title="MACD Fast MA Length", type=input.integer, defval=8, minval=2)
slowMA = input(title="MACD Slow MA Length", type=input.integer, defval=16, minval=7)
signal = input(title="MACD Signal Length", type=input.integer, defval=1, minval=1)
//
//
[currMacd, _, _] = macd(srcClose[0], fastMA, slowMA, signal)
rising_1 = rising(currMacd, 2)
falling_1 = falling(currMacd, 2)
macdH = currMacd > 0 ? rising_1 ? color.green : color.red :
   falling_1 ? color.red : color.green

//
// Bar - Highlighting  based on indication strength
long = (not umacd or macdH == color.green) and mab > mbb and mab < rsiOBL and
   mab > rsiOSL and srcHigh > smmaH and srcClose > srcOpen ?
   mbb > mid ? 1 : mab > mid and mbb < mid ? 2 : mab < mid and mbb < mid ? 3 : 0 : 0
short = (not umacd or macdH == color.red) and mab < mbb and mab < rsiOBL and
   mab > rsiOSL and srcLow < smmaL and srcClose < srcOpen ?
   mbb < mid ? 1 : mab < mid and mbb > mid ? 2 : mab > mid and mbb > mid ? 3 : 0 : 0
//
// Find the right Bar colour if enabled.
bcolor = not sbr ? na : long == 1 ? gold100 :
   long == 2 and strength > 1 ? aqua100 : long == 3 and strength > 2 ? blue100 :
   short == 1 ? fuchsia100 : short == 2 and strength > 1 ? purple100 :
   short == 3 and strength > 2 ? black100 : sgb ? gray100 : na
//
barcolor(color=bcolor, title="Bars Colours")
//
//
// === ALERT conditions
//
// create alerts only once per sequence type.
//
longCond = long > 0 and long != long[1] and long <= strength
shortCond = short > 0 and short != short[1] and short <= strength

// show dot only when alert condition is met and bar closed.
plotshape(sal and (longCond[1] or shortCond[1]), title="Alert Indicator", location=location.bottom,
          color=long[1] == 1 ? gold : long[1] == 2 ? color.aqua : long[1] == 3 ? color.blue : short[1] == 1 ? color.fuchsia : short[1] == 2 ? color.purple : short[1] == 3 ? color.black : na,
          transp=0, style=shape.circle, offset=-1)
//

// === /ALERT conditions.

// === STRATEGY ===
tradeType = input("BOTH", title="What trades should be taken : ", options=["LONG", "SHORT", "BOTH", "NONE"])

// stop loss
slPoints = input(defval=0, title="Initial Stop Loss Points (zero to disable)", minval=0)
tpPoints = input(defval=0, title="Initial Target Profit Points (zero for disable)", minval=0)

//>>>>>>>>>>>>>>>>>>>>>>>>>>>>>>>>>>>>>>>>>>>>>>>>>>>>>>>>>>>>>>>>>>>>>>>>>>>>>//

testStartYear = input(2018, "Backtest Start Year", minval=1980)
testStartMonth = input(1, "Backtest Start Month", minval=1, maxval=12)
testStartDay = input(1, "Backtest Start Day", minval=1, maxval=31)
testPeriodStart = timestamp(testStartYear, testStartMonth, testStartDay, 0, 0)

testStopYear = input(9999, "Backtest Stop Year", minval=1980)
testStopMonth = input(12, "Backtest Stop Month", minval=1, maxval=12)
testStopDay = input(31, "Backtest Stop Day", minval=1, maxval=31)
testPeriodStop = timestamp(testStopYear, testStopMonth, testStopDay, 0, 0)

testPeriod() =>
    time >= testPeriodStart and time <= testPeriodStop ? true : false

//<<<<<<<<<<<<<<<<<<<<<<<<<<<<<<<<<<<<<<<<<<<<<<<<<<<<<<<<<<<<<<<<<<<<<<<<<<<<<//

//
//set up exit parameters
TP = tpPoints > 0 ? tpPoints : na
SL = slPoints > 0 ? slPoints : na

// Make sure we are within the bar range, Set up entries and exit conditions
if testPeriod() and tradeType != "NONE"
    strategy.entry("long", strategy.long, when=longCond == true and tradeType != "SHORT")
    strategy.entry("short", strategy.short, when=shortCond == true and tradeType != "LONG")
    strategy.close("long", when=shortCond == true and tradeType == "LONG")
    strategy.close("short", when=longCond == true and tradeType == "SHORT")
    strategy.exit("XL", from_entry="long", profit=TP, loss=SL)
    strategy.exit("XS", from_entry="short", profit=TP, loss=SL)

// === /STRATEGY ===
//EOF