Sabar ikuti strategi mengikut trend
Gambaran keseluruhan
Strategi mengikuti trend dengan kesabaran adalah strategi mengikuti trend. Ia menggunakan gabungan indikator rata-rata bergerak untuk menentukan arah trend, dan menggabungkan indikator CCI yang terlalu banyak untuk menghantar isyarat perdagangan. Strategi ini mengikuti trend besar, dan dapat mengelakkan penyekatan dengan berkesan dalam keadaan goyah.
Prinsip Strategi
Strategi ini menggunakan gabungan EMA 21 dan 55 kitaran untuk menentukan arah trend. EMA jangka pendek ditakrifkan sebagai tren naik apabila di atas EMA jangka panjang, dan EMA jangka pendek ditakrifkan sebagai tren menurun apabila di bawah EMA jangka panjang.
Indeks CCI digunakan untuk menilai keadaan overbought dan oversold. Di atas CCI, garis 100 adalah isyarat oversold yang paling bawah, dan di bawah 100 adalah isyarat oversold yang paling atas. Strategi ini terbahagi kepada tiga tahap kekuatan isyarat perdagangan berdasarkan garis overbought dan oversold yang berbeza dalam indikator CCI.
Apabila menilai sebagai trend menaik, jika petunjuk CCI mengeluarkan isyarat oversell yang kuat di bawah, masuklah ke dalam perdagangan. Apabila menilai sebagai trend menurun, jika petunjuk CCI mengeluarkan isyarat oversell yang kuat di atas, masuklah ke dalam perdagangan kosong.
Barisan hentian ditetapkan sebagai penunjuk SuperTrend, dan sasaran keuntungan ditetapkan sebagai jumlah titik tetap.
Analisis kelebihan
Strategi ini mempunyai kelebihan utama:
- Ikuti Trend Besar dan Jangan Tertipu
- Indeks CCI dapat menentukan titik balik dengan berkesan
- Pendahuluan SuperTrend
- Penangguhan tetap dan penangguhan tetap, risiko boleh dikawal
Analisis risiko
Strategi ini mempunyai risiko utama:
- Kebarangkalian Kesesatan Trend
- Kebarangkalian CCI memberi isyarat palsu
- Kebarangkalian terlampau cetek atau terlampau dalam menyebabkan terlampau banyak
- Kemungkinan bahawa stop-loss tetap tidak dapat terus menjejaki trend
Untuk menghadapi risiko ini, kita boleh mengoptimumkan dengan menyesuaikan parameter kitaran EMA, parameter CCI, dan titik berhenti berhenti. Ia juga perlu untuk memperkenalkan lebih banyak petunjuk untuk mengesahkan isyarat strategi.
Arah pengoptimuman
Strategi ini dioptimumkan untuk:
Uji gabungan lebih banyak indikator untuk mencari penilaian trend yang lebih baik dan indikator pengesahan isyarat.
Menggunakan ATR Dynamic Stop Loss Stop untuk lebih baik mengesan trend dan mengawal risiko.
memperkenalkan model pembelajaran mesin berdasarkan latihan data sejarah untuk menilai kebarangkalian trend.
Sesuaikan dan optimumkan parameter untuk pelbagai jenis.
ringkaskan
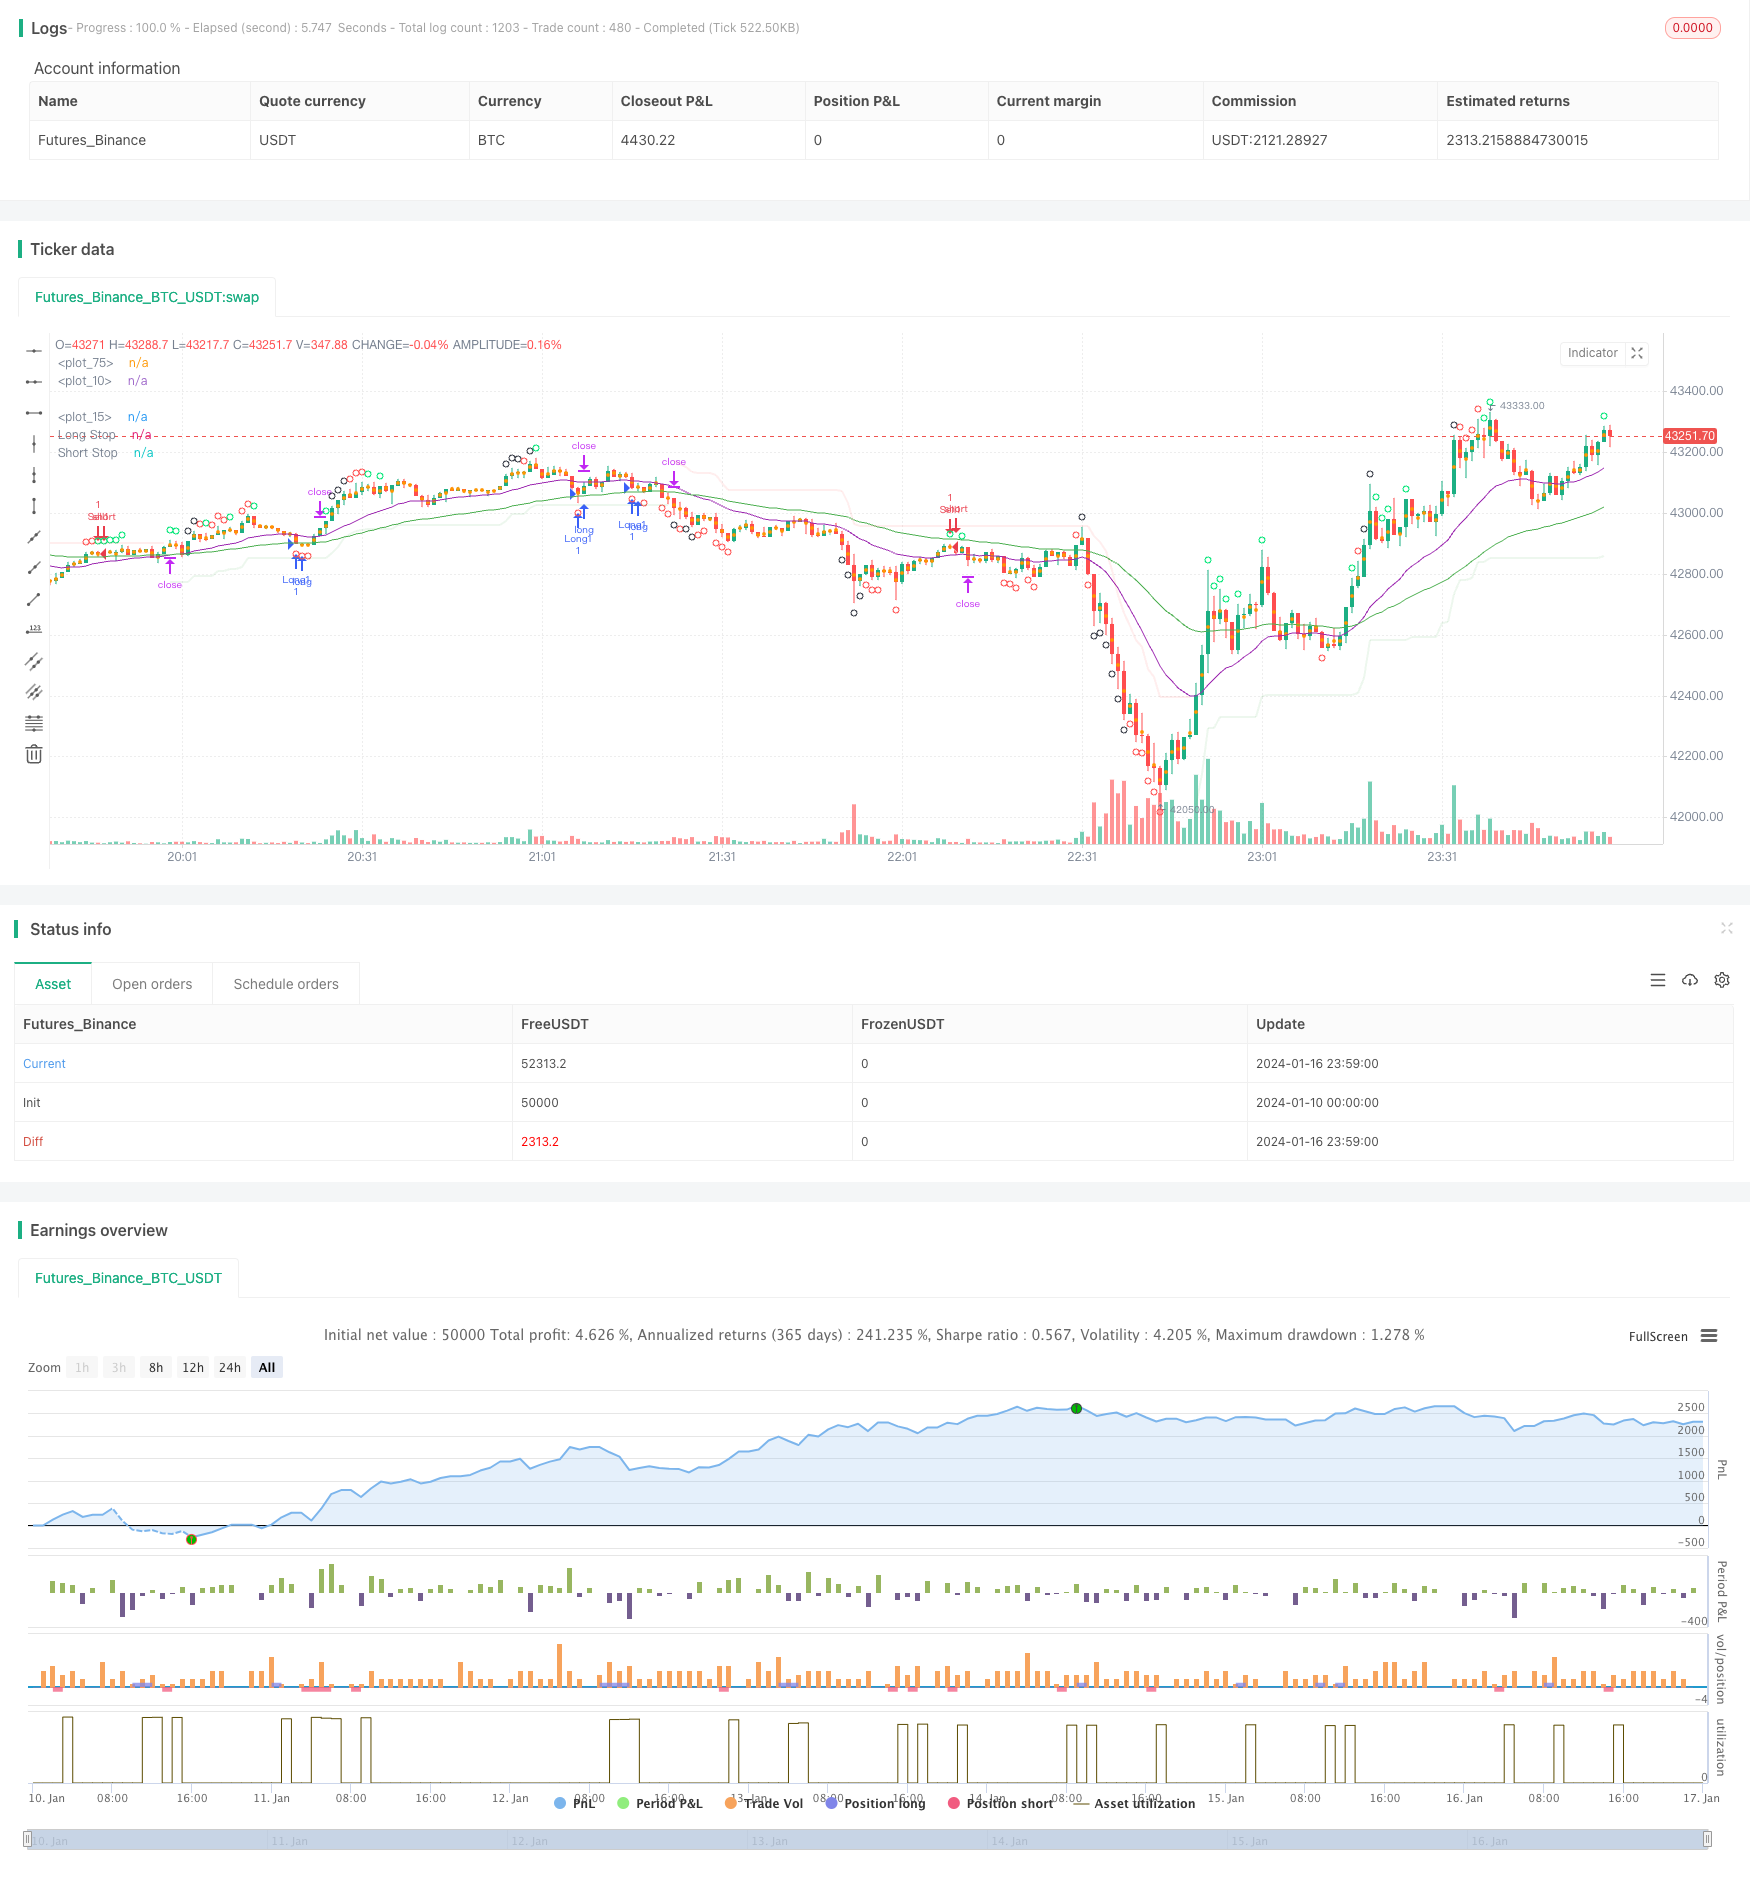
Strategi trend track kesabaran secara keseluruhannya adalah strategi trend follow yang sangat praktikal. Ia menggunakan purata bergerak untuk menentukan arah trend besar, penunjuk CCI menemui isyarat titik reversal, dan garis berhenti super trend ditetapkan dengan munasabah.
/*backtest
start: 2024-01-10 00:00:00
end: 2024-01-17 00:00:00
period: 1m
basePeriod: 1m
exchanges: [{"eid":"Futures_Binance","currency":"BTC_USDT"}]
*/

// This source code is subject to the terms of the Mozilla Public License 2.0 at https://mozilla.org/MPL/2.0/
// © greenmask9

//@version=4
strategy("Patient Trendfollower (7) Strategy", overlay=true)

// 21 EMA
emalength = input(21, title="Short EMA")
emashort = ema(close, emalength)
plot(emashort, color = color.purple, linewidth=1)

// 55 EMA
emalength2 = input(55, title="Long EMA")
ema = ema(close, emalength2)
plot(ema, color = color.green, linewidth=1)

//CCI calculation and inputs
lengthcci = input(20, minval=1, title="Overbought/sold detector period")
src = input(close, title="Overbought/sold detector source")
ma = sma(src, lengthcci)
ccivalue = (src - ma) / (0.015 * dev(src, lengthcci))


//CCI plotting
ccioverbought = input(defval=100, title="Overbought level 1")
ccioverbought2 = input(defval=140, title="Overbought level 2")
ccioverbought3 = input(defval=180, title="Overbought level 3")

ccioversold = input(defval=-100, title="Oversold level 1")
ccioversold2 = input(defval=-140, title="Oversold level 2")
ccioversold3 = input(defval=-180, title="Oversold level 3")

cciOB = (ccivalue >= ccioverbought and ccivalue < ccioverbought2)
plotshape(cciOB,  title= "Overbought", location=location.abovebar, color=color.lime, transp=0, style=shape.circle)
cciOS = (ccivalue <= ccioversold and ccivalue > ccioversold2)
plotshape(cciOS, title= "Oversold", location=location.belowbar, color=color.lime, transp=0, style=shape.circle)

cciOB2 = (ccivalue >= ccioverbought2 and ccivalue < ccioverbought3)
plotshape(cciOB2,  title= "Overbought", location=location.abovebar, color=color.red, transp=0, style=shape.circle)
cciOS2 = (ccivalue <= ccioversold and ccivalue > ccioversold3)
plotshape(cciOS2, title= "Oversold", location=location.belowbar, color=color.red, transp=0, style=shape.circle)

cciOB3 = (ccivalue >= ccioverbought3)
plotshape(cciOB3,  title= "Overbought", location=location.abovebar, color=color.black, transp=0, style=shape.circle)
cciOS3 = (ccivalue <= ccioversold3)
plotshape(cciOS3, title= "Oversold", location=location.belowbar, color=color.black, transp=0, style=shape.circle)

//Supertrend

length = input(title="ATR Period", type=input.integer, defval=55)
mult = input(title="ATR Multiplier", type=input.float, step=0.1, defval=5.0)
wicks = input(title="Take Wicks into Account ?", type=input.bool, defval=true)
illuminate = input(title="Illuminate Trend", type=input.bool, defval=true)

atr = mult * atr(length)

longStop = hl2 - atr
longStopPrev = nz(longStop[1], longStop)
longStop := (wicks ? low[1] : close[1]) > longStopPrev ? max(longStop, longStopPrev) : longStop

shortStop = hl2 + atr
shortStopPrev = nz(shortStop[1], shortStop)
shortStop := (wicks ? high[1] : close[1]) < shortStopPrev ? min(shortStop, shortStopPrev) : shortStop

dir = 1
dir := nz(dir[1], dir)
dir := dir == -1 and (wicks ? high : close) > shortStopPrev ? 1 : dir == 1 and (wicks ? low : close) < longStopPrev ? -1 : dir

longColor = color.new(color.green, 90)
shortColor = color.new(color.red, 90)
noneColor = color.new(color.white, 100)

longStopPlot = plot(dir == 1 ? longStop : na, title="Long Stop", style=plot.style_linebr, linewidth=2, color=longColor)
shortStopPlot = plot(dir == 1 ? na : shortStop, title="Short Stop", style=plot.style_linebr, linewidth=2, color=shortColor)
midPricePlot = plot(ohlc4, title="", style=plot.style_circles, linewidth=0)

longFillColor = illuminate ? (dir == 1 ? longColor : noneColor) : noneColor
shortFillColor = illuminate ? (dir == -1 ? shortColor : noneColor) : noneColor
fill(midPricePlot, longStopPlot, title="Long State Filling", color=longFillColor)
fill(midPricePlot, shortStopPlot, title="Short State Filling", color=shortFillColor)

//entries
uptrend = emashort>ema and dir == 1
upsignal = ccivalue<=ccioversold and ccivalue>ccioversold2
upsignal2 = ccivalue<=ccioversold2 and ccivalue>ccioversold3
upsignal3 = ccivalue<=ccioversold3
downtrend = emashort<ema and dir == -1
downsignal = ccivalue>=ccioverbought and ccivalue<ccioverbought2
downsignal2 = ccivalue>=ccioverbought2 and ccivalue<ccioverbought3
downsignal3 = ccivalue>=ccioverbought3

//adapts to the current bar, I need to save the bars number when the condition for buy was true, static number is spread
spread = input (0.00020, title="Spread")
upstoploss = longStop - spread
downstoploss = shortStop + spread
strategy.initial_capital = 50000
ordersize=floor(strategy.initial_capital/close)
testlong = input(title="Test longs", type=input.bool, defval=true)
testshort = input(title="Test shorts", type=input.bool, defval=true)
//new
degree = input(title="Test level 1 overbought/sold levels", type=input.bool, defval=true)
degree2 = input(title="Test level 2 overbought/sold levels", type=input.bool, defval=false)
degree3 = input(title="Test level 3 overbought/sold levels", type=input.bool, defval=false)

statictarget = input(title="Use static target", type=input.bool, defval=true)
statictargetvalue = input(title="Static target in pips", type=input.integer, defval=400)

//timetrade = input(title="Open trades only withing specified time", type=input.bool, defval=true)
//timtrade = input()

//přidat možnost TP podle ATR a sl podle ATR
buy1 = uptrend and upsignal and strategy.opentrades==0 and testlong and degree
x1 = barssince (buy1)
if (buy1)
//bodlo by zakázat atrtarget v tomto případě
    if (statictarget)
        strategy.entry("Long1", strategy.long, ordersize)
        strategy.exit( "Exitlong", from_entry="Long1" , profit=statictargetvalue,stop=upstoploss[x1])

buy2 = uptrend and upsignal2 and strategy.opentrades==0 and testlong and degree2
x2 = barssince (buy2)
if (buy2)
//bodlo by zakázat atrtarget v tomto případě
    if (statictarget)
        strategy.entry("Long2", strategy.long, ordersize)
        strategy.exit( "Exitlong", from_entry="Long2" , profit=statictargetvalue,stop=upstoploss[x2])

buy3 = uptrend and upsignal3 and strategy.opentrades==0 and testlong and degree3
x3 = barssince (buy3)
if (buy3)
//bodlo by zakázat atrtarget v tomto případě
    if (statictarget)
        strategy.entry("Long3", strategy.long, ordersize)
        strategy.exit( "Exitlong", from_entry="Long3" , profit=statictargetvalue,stop=upstoploss[x3])

sell1 = downtrend and downsignal and strategy.opentrades==0 and testshort and degree
y1 = barssince (sell1)
if (sell1)
    if (statictarget)
        strategy.entry("Sell1", strategy.short, ordersize)
        strategy.exit( "Exitshort", from_entry="Sell1" , profit=statictargetvalue,stop=downstoploss[y1])

sell2 = downtrend and downsignal2 and strategy.opentrades==0 and testshort and degree2
y2 = barssince (sell2)
if (sell2)
    if (statictarget)
        strategy.entry("Sell2", strategy.short, ordersize)
        strategy.exit( "Exitshort", from_entry="Sell2" , profit=statictargetvalue,stop=downstoploss[y2])

sell3 = downtrend and downsignal3 and strategy.opentrades==0 and testshort and degree3
y3 = barssince (sell3)
if (sell3)
    if (statictarget)
        strategy.entry("Sell3", strategy.short, ordersize)
        strategy.exit( "Exitshort", from_entry="Sell3" , profit=statictargetvalue,stop=downstoploss[y3])