
4
Follow
1
Followers
Por favor, pergunte.
-
Eu tentei criar dois objetos de gráficos, cada um com um dado, e cada um com um símbolo de um gráfico, e cada um com um símbolo de um gráfico.
Parece que não funciona, ou é mostrado em um gráfico. -
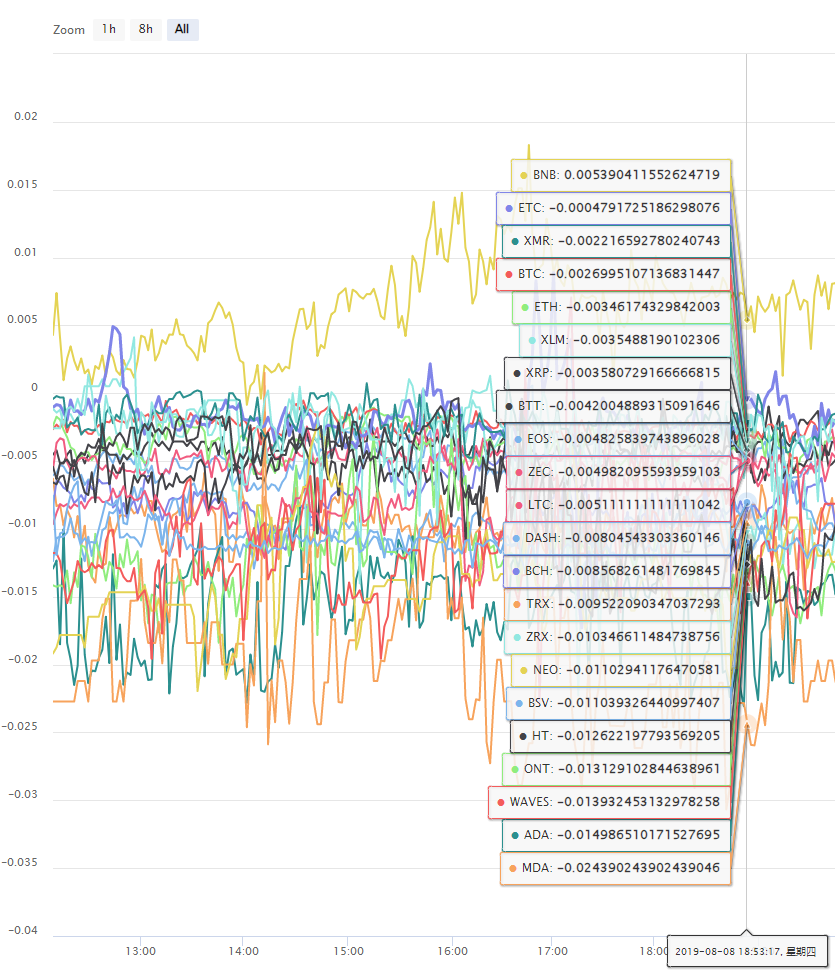
Se uma tabela mostra muitas curvas, que não são visíveis (veja a figura abaixo), será que a opção de um interruptor para cada curva é visível?
Obrigada.
Related Recommendations
Get Started with FMZ Quant PlatformSECURITY BUGI keep getting error: Exchange_GetAccount: Invalid ContractTypeWe have an incredibly profitable market making algorithm for sideways markets on Bitmex - but need expert to help eliminate wait times during downward volatility in the marketError with deribitLimitations of the backtesting engineHow to install ta-lib on linux docker?5.5 Trading strategy optimization5.4 Why do we need an off-sample test5.3 How to read the strategy backtest performance report
Comment
All comments (3)

可以显示两个图表,在策略广场有范例:
https://www.fmz.com/strategy/136056
https://www.fmz.com/strategy/38203
7 years ago
- 1