Estratégia de negociação de linha

Visão geral
A estratégia baseia-se na ideia de quebrar os principais suportes e resistências, identificando as principais linhas de tendência ascendente e descendente nos gráficos de preços e negociando quando os preços quebram as linhas de tendência. A estratégia é simples e confiável e se aplica a ambientes de mercado onde a tendência é clara.
Princípio da estratégia
A estratégia identifica pontos críticos de subida e descida dos preços, calculando os pontos altos e baixos das linhas colunares à esquerda e à direita, para obter linhas de suporte e de pressão. Especificamente:
-
usar
pivothigh()epivotlow()Função de detecção de pontos altos e baixos críticos. -
A equação para traçar a linha de suporte e a linha de pressão de acordo com o ponto mais alto e mais baixo.
-
Quando o preço ultrapassa a linha de pressão, faça mais; quando o preço ultrapassa a linha de suporte, faça menos.
-
A escolha de fazer mais ou menos dependendo da direção da tendência
-
Pode-se escolher se a posição será desviada para a posição zero no momento da ruptura.
-
É possível optar por parar a perda, parar a queda e parar a perda de cauda.
-
Opções de Stop Swing, Stop ATR e Stop Fix.
A estratégia é simples e prática, combinando o acompanhamento de tendências e a reversão de tendências, com uma estratégia de ruptura de negociação através de uma simples pista de tendência.
Análise de vantagens
- As estratégias são simples, fáceis de entender e de implementar.
- A teoria da ruptura tem uma vantagem de probabilidade.
- Pode-se configurar o Stop Loss Stop, para controlar o risco.
- Pode ser acompanhado ou invertido.
- Parâmetros otimizáveis para diferentes cenários de mercado.
Análise de Riscos
- O sinal de ruptura pode ter sido mal comunicado.
- A configuração inadequada do ponto de parada pode aumentar os prejuízos.
- A operação de reversão corre o risco de ser enganada.
- O parameter tuning requer experiência e pode falhar se não for configurado corretamente.
- A tendência pura não é válida para os movimentos de tremores.
Pode-se reduzir o risco através da otimização da estratégia de parada de perdas, avaliação da qualidade do sinal de ruptura, avaliação do tempo de reversão e outros métodos.
Direção de otimização
- Avaliação da confiabilidade dos sinais de ruptura e melhoria da precisão.
- Combinação de volume e amplificação do sinal de ruptura.
- Optimizar a estratégia de stop loss e adaptar-se às flutuações do mercado.
- Avaliar o melhor momento para reverter.
- parameter tuning。
- Avaliação do modelo multifator.
- Avaliação em combinação com outros indicadores.
Resumir
A estratégia é simples e prática em geral, para capturar a tendência de preços através de uma simples ruptura de tendência, com riscos controláveis. A estratégia pode ser otimizada em vários aspectos e se aplica a mais situações de mercado, sendo, em geral, uma estratégia de seguimento de tendências muito prática.
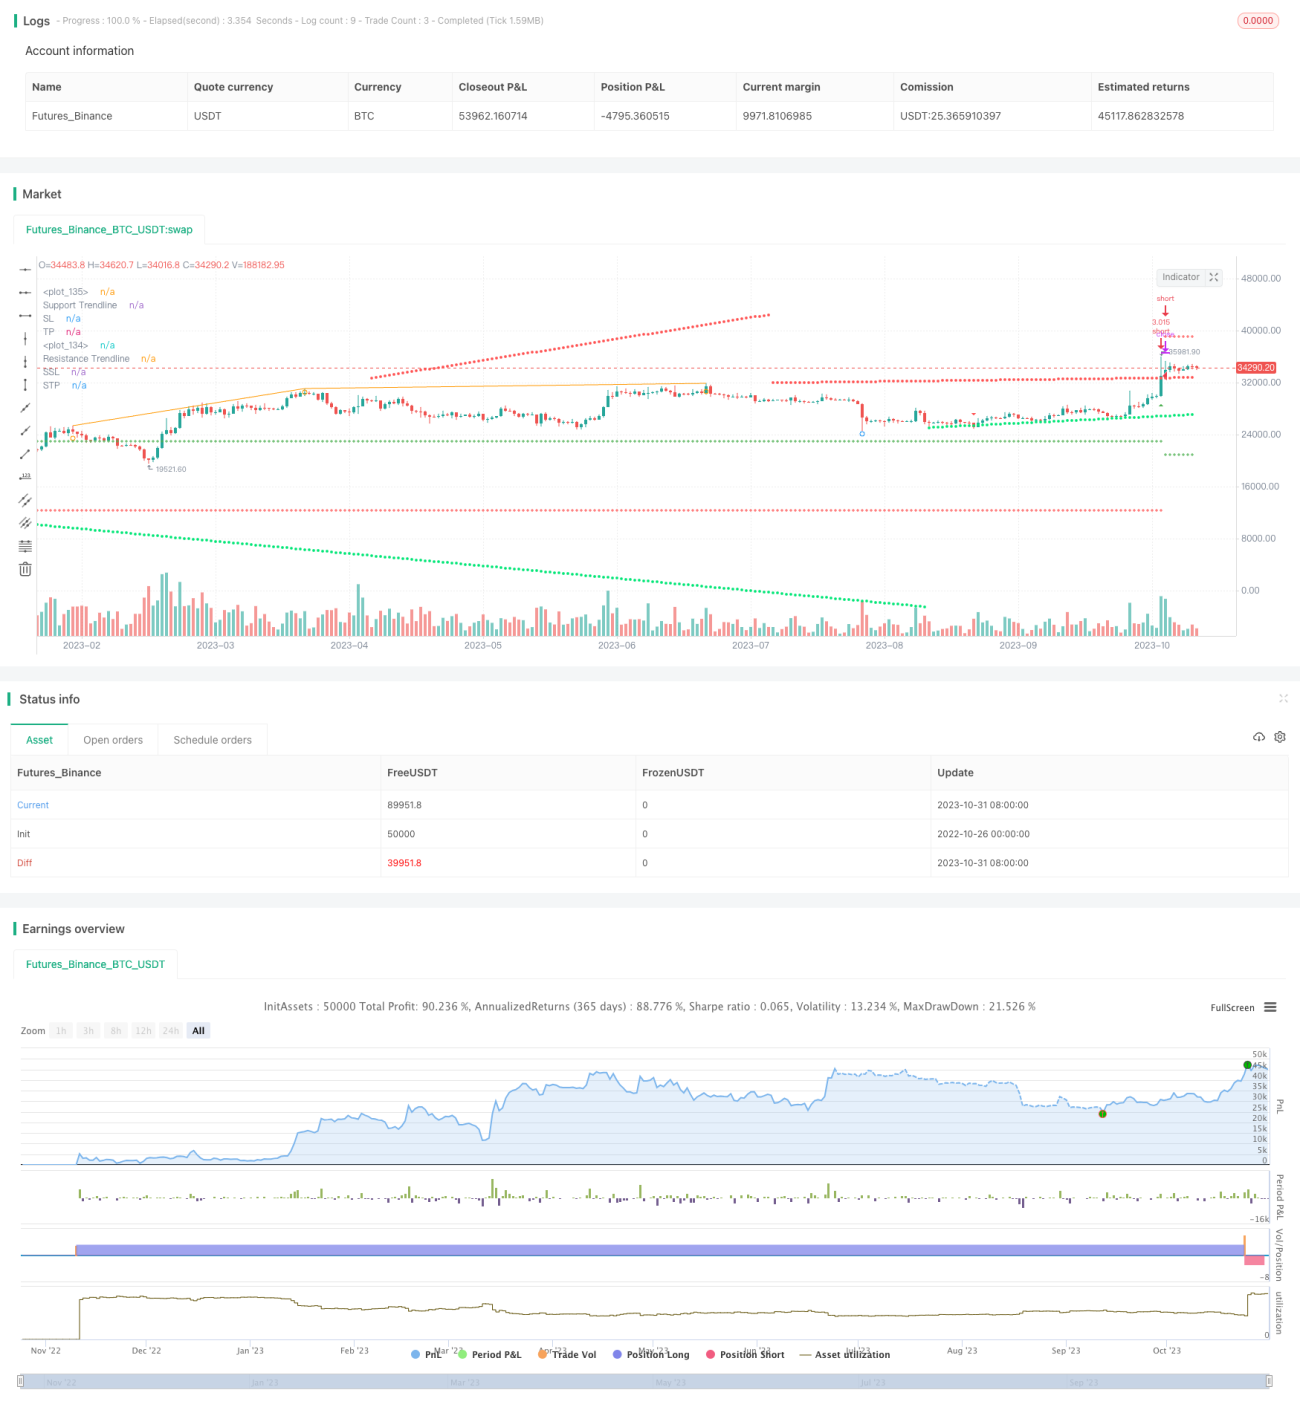
/*backtest
start: 2022-10-26 00:00:00
end: 2023-11-01 00:00:00
period: 1d
basePeriod: 1h
exchanges: [{"eid":"Futures_Binance","currency":"BTC_USDT"}]
*/

// This source code is subject to the terms of the Mozilla Public License 2.0 at https://mozilla.org/MPL/2.0/
// © tweakerID and © BacktestRookies

// Using the clever calculations and code by BacktestRookies, here is a strategy that buys - 1