Momentum combinado com estratégia de negociação quantitativa multifatorial de julgamento de tendências


Data de criação: 2023-11-23 14:58:57 última modificação: 2023-11-23 14:58:57
cópia: 0 Cliques: 644
1
focar em
1617
Seguidores

Momentum combinado com estratégia de negociação quantitativa multifatorial de julgamento de tendências

Visão geral

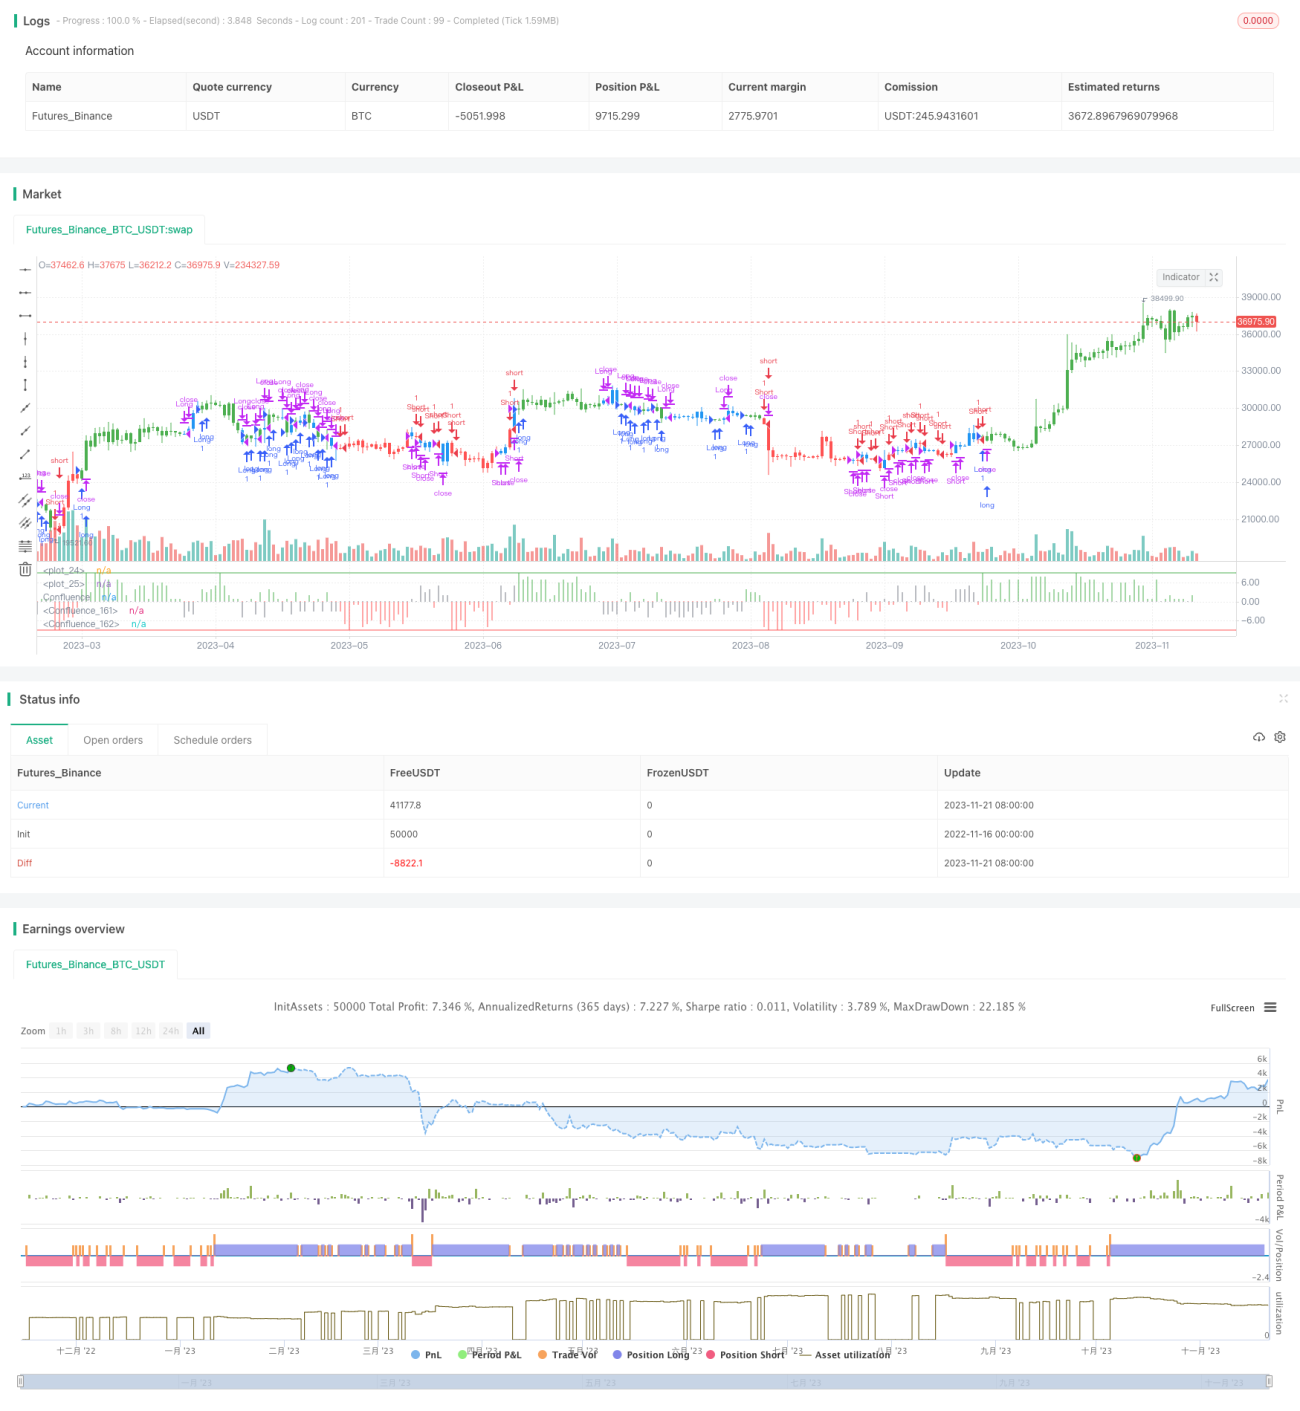
Esta estratégia é uma estratégia de negociação quantitativa de determinação de múltiplos fatores que combina indicadores de dinamismo e indicadores de tendência. A estratégia determina a tendência geral do mercado e a direção da dinâmica através da combinação matemática de várias médias, emitindo sinais de negociação de acordo com as condições de depreciação.

Princípio da estratégia

  1. Computação de médias de múltiplos grupos e indicadores de dinâmica
    • Calcule a média de Harmonics, a média de curto prazo, a média de médio prazo e a média de longo prazo.
    • Calcular a diferença entre as médias para refletir a tendência de mudança de preço
    • Cálculo de derivativos de primeira ordem de cada média para refletir a dinâmica de variação de preços
    • Calcular um indicador de consonância para determinar a direção da tendência
  2. Compreensão de sinais de negociação
    • Operação de ponderação de vários fatores, como indicadores de força, indicadores de tendência
    • A distância entre os resultados e o limiar para avaliar o estado atual do mercado
    • Emissão de sinais de negociação de longo prazo

Análise de vantagens

  1. Avaliar múltiplos fatores para melhorar a precisão do sinal
    • Considere o preço, as tendências e a dinâmica
    • Diferentes fatores podem ter diferentes pesos
  2. Parâmetros ajustáveis para diferentes mercados
    • Parâmetros de média, limites entre os blocos de negociação
    • Adaptável a diferentes ciclos e condições de mercado
  3. A estrutura do código é clara e fácil de entender.
    • Nomenclatura, comentários completos
    • Fácil de redesenhar e otimizar

Análise de Riscos

  1. Parâmetros difíceis de otimizar
    • A análise de dados históricos é necessária para encontrar os parâmetros ótimos
  2. A frequência de transações pode ser muito alta.
    • A avaliação de múltiplos fatores pode gerar excesso de transações
  3. Eficácia e relevância para o mercado
    • Estratégias de avaliação de tendências, suscetíveis a comportamentos irracionais

Direção de otimização

  1. Adição de lógica de stop loss
    • Evitar maiores prejuízos de comportamentos irracionais
  2. Optimizar configurações de parâmetros
    • Buscar combinações ótimas de parâmetros para aumentar a estabilidade da estratégia
  3. Adicionar elementos de aprendizagem de máquina
    • Usar aprendizagem profunda para avaliar o estado atual do mercado e auxiliar na tomada de decisões estratégicas

Resumir

Esta estratégia julga o estado do mercado através de uma combinação de vários fatores de indicadores de dinâmica e indicadores de tendência, e emite sinais de negociação de acordo com o limite definido. A vantagem da estratégia é que é altamente configurável, adequada a diferentes ambientes de mercado e fácil de entender. A desvantagem é a dificuldade de otimização de parâmetros, a frequência de negociação pode ser excessiva e o efeito é fortemente relacionado ao mercado.

Código-fonte da estratégia
/*backtest
start: 2022-11-16 00:00:00
end: 2023-11-22 00:00:00
period: 1d
basePeriod: 1h
exchanges: [{"eid":"Futures_Binance","currency":"BTC_USDT"}]
*/

//@version=2
////////////////////////////////////////////////////////////
//  Copyright by HPotter v1.0 14/03/2017
// This is modified version of Dale Legan's "Confluence" indicator written by Gary Fritz.
// ================================================================
// Here is Gary`s commentary:
// Since the Confluence indicator returned several "states" (bull, bear, grey, and zero), 
// he modified the return value a bit:
// -9 to -1 = Bearish
// -0.9 to 0.9 = "grey" (and zero)
// 1 to 9 = Bullish
// The "grey" range corresponds to the "grey" values plotted by Dale's indicator, but 
// they're divided by 10.
//
// You can change long to short in the Input Settings
// Please, use it only for learning or paper trading. Do not for real trading.
////////////////////////////////////////////////////////////

strategy(title="Confluence", shorttitle="Confluence")
Harmonic = input(10, minval=1)
BuyBand = input(9)
SellBand = input(-9)
reverse = input(false, title="Trade reverse")
hline(SellBand, color=red, linestyle=line)
hline(BuyBand, color=green, linestyle=line)

Price = close

STL = round((Harmonic * 2) - 1 - 0.5)
ITL = round((STL * 2) - 1 - 0.5)
LTL = round((ITL * 2) - 1 - 0.5)
HOFF = round(Harmonic / 2 - 0.5)
SOFF = round(STL / 2 - 0.5)
IOFF = round(ITL / 2 - 0.5)

xHavg = sma(Price, Harmonic)
xSavg = sma(Price, STL)
xIavg = sma(Price, ITL)
xLavg = sma(Price, LTL)

xvalue2 = xSavg - xHavg[HOFF]
xvalue3 = xIavg - xSavg[SOFF]
xvalue12 = xLavg - xIavg[IOFF]

xmomsig = xvalue2 + xvalue3 + xvalue12

xLavgOHLC = sma(ohlc4, LTL - 1)

xH2 = sma(Price, Harmonic - 1)
xS2 = sma(Price, STL - 1)
xI2 = sma(Price, ITL - 1)
xL2 = sma(Price, LTL - 1)

DerivH = (xHavg * 2) - xHavg[1]
DerivS = (xSavg * 2) - xSavg[1]
DerivI = (xIavg * 2) - xIavg[1]
DerivL = (xLavg * 2) - xLavg[1]
SumDH = Harmonic * DerivH
SumDS = STL * DerivS
SumDI = ITL * DerivI
SumDL = LTL * DerivL

LengH = Harmonic - 1
LengS = STL - 1
LengI = ITL - 1
LengL = LTL - 1

N1H = xH2 * LengH
N1S = xS2 * LengS
N1I = xI2 * LengI
N1L = xL2 * LengL

DRH = SumDH - N1H
DRS = SumDS - N1S
DRI = SumDI - N1I
DRL = SumDL - N1L

SumH = xH2 * (Harmonic - 1)
SumS = xS2 * (STL - 1)
SumI = xI2 * (ITL - 1)
SumL = xLavgOHLC * (LTL - 1)

xvalue5 = (SumH + DRH) / Harmonic
xvalue6 = (SumS + DRS) / STL
xvalue7 = (SumI + DRI) / ITL
xvalue13 = (SumL + DRL) / LTL

value9 = xvalue6 - xvalue5[HOFF]
value10 = xvalue7 - xvalue6[SOFF]
value14 = xvalue13 - xvalue7[IOFF]
xmom = value9 + value10 + value14

HT = sin(xvalue5 * 2 * 3.14 / 360) + cos(xvalue5 * 2 * 3.14 / 360)
HTA = sin(xHavg * 2 * 3.14 / 360) + cos(xHavg * 2 * 3.14 / 360)
ST = sin(xvalue6 * 2 * 3.14 / 360) + cos(xvalue6 * 2 * 3.14 / 360)
STA = sin(xSavg * 2 * 3.14 / 360) + cos(xSavg * 2 * 3.14 / 360)
IT = sin(xvalue7 * 2 * 3.14 / 360) + cos(xvalue7 * 2 * 3.14 / 360)
ITA = sin(xIavg * 2 * 3.14 / 360) + cos(xIavg * 2 * 3.14 / 360)

xSum = HT + ST + IT
xErr = HTA + STA + ITA

Condition2 = (((xSum > xSum[SOFF]) and (xHavg < xHavg[SOFF])) or ((xSum < xSum[SOFF]) and (xHavg > xHavg[SOFF])))
Phase = iff(Condition2 , -1 , 1)
xErrSum = (xSum - xErr) * Phase
xErrSig = sma(xErrSum, SOFF)

xvalue70 = xvalue5 - xvalue13
xvalue71 = sma(xvalue70, Harmonic)


ErrNum = iff (xErrSum > 0 and xErrSum < xErrSum[1] and xErrSum < xErrSig, 1,
          iff (xErrSum > 0 and xErrSum < xErrSum[1] and xErrSum > xErrSig, 2, 
           iff (xErrSum > 0 and xErrSum > xErrSum[1] and xErrSum < xErrSig, 2,
             iff (xErrSum > 0 and xErrSum > xErrSum[1] and xErrSum > xErrSig, 3,
              iff (xErrSum < 0 and xErrSum > xErrSum[1] and xErrSum > xErrSig, -1,
               iff (xErrSum < 0 and xErrSum < xErrSum[1] and xErrSum > xErrSig, -2,
                 iff (xErrSum < 0 and xErrSum > xErrSum[1] and xErrSum < xErrSig, -2,
                  iff (xErrSum < 0 and xErrSum < xErrSum[1] and xErrSum < xErrSig, -3, 0))))))))


momNum = iff (xmom > 0 and xmom < xmom[1] and xmom < xmomsig , 1,
          iff (xmom > 0 and xmom < xmom[1] and xmom > xmomsig, 2,
           iff (xmom > 0 and xmom > xmom[1] and xmom < xmomsig, 2,
             iff (xmom > 0 and xmom > xmom[1] and xmom > xmomsig, 3,
              iff (xmom < 0 and xmom > xmom[1] and xmom > xmomsig, -1,
               iff (xmom < 0 and xmom < xmom[1] and xmom > xmomsig, -2,
                 iff (xmom < 0 and xmom > xmom[1] and xmom < xmomsig, -2,
                  iff (xmom < 0 and xmom < xmom[1] and xmom < xmomsig, -3, 0))))))))

TCNum =  iff (xvalue70 > 0 and xvalue70 < xvalue70[1] and xvalue70 < xvalue71, 1,
          iff (xvalue70 > 0 and xvalue70 < xvalue70[1] and xvalue70 > xvalue71, 2,
           iff (xvalue70 > 0 and xvalue70 > xvalue70[1] and xvalue70 < xvalue71, 2,
             iff (xvalue70 > 0 and xvalue70 > xvalue70[1] and xvalue70 > xvalue71, 3,
              iff (xvalue70 < 0 and xvalue70 > xvalue70[1] and xvalue70 > xvalue71, -1,
               iff (xvalue70 < 0 and xvalue70 < xvalue70[1] and xvalue70 > xvalue71, -2,
                 iff (xvalue70 < 0 and xvalue70 > xvalue70[1] and xvalue70 < xvalue71, -2,
                  iff (xvalue70 < 0 and xvalue70 < xvalue70[1] and xvalue70 < xvalue71, -3,0))))))))

value42 = ErrNum + momNum + TCNum
Confluence = iff (value42 > 0 and xvalue70 > 0, value42,
              iff (value42 < 0 and xvalue70 < 0, value42,
               iff ((value42 > 0 and xvalue70 < 0) or (value42 < 0 and xvalue70 > 0), value42 / 10, 0)))
Res1 = iff (Confluence >= 1, Confluence, 0)
Res2 = iff (Confluence <= -1, Confluence, 0)
Res3 = iff (Confluence == 0, 0, iff (Confluence > -1 and Confluence < 1, 10 * Confluence, 0))
pos = iff(Res2 >= SellBand and Res2 != 0, -1,
	     iff(Res1 <= BuyBand and Res1 != 0, 1, 
	       iff(Res3 != 0, 0, nz(pos[1], 0))))
possig = iff(reverse and pos == 1, -1,
          iff(reverse and pos == -1, 1, pos))	   
if (possig == 1) 
    strategy.entry("Long", strategy.long)
if (possig == -1)
    strategy.entry("Short", strategy.short)	   	 
if (possig == 0)
    strategy.close("Long", when = possig == 0)	 
    strategy.close("Short", when = possig == 0)	 
barcolor(possig == -1 ? red: possig == 1 ? green : blue )
plot(Res1, color=green, title="Confluence", linewidth=3, style = histogram)
plot(Res2, color=red, title="Confluence", linewidth=3, style = histogram)
plot(Res3, color=gray, title="Confluence",  linewidth=3, style = histogram)