Estratégia de take-profit e trailing stop-loss seguindo tendências
Visão geral
A estratégia de parada de seguimento de tendência é uma estratégia de negociação quantitativa que combina a funcionalidade de acompanhamento de tendência, parada parcial e parada de seguimento completo, com o objetivo de capturar a tendência de aumento de preços em um mercado de touros e lucrar com uma parada inteligente, ao mesmo tempo em que usa o rastreamento de parada para controlar o risco de queda.
Princípio da estratégia
A estratégia usa a média móvel rápida e a forquilha da média móvel lenta como sinal de compra. Quando a média móvel rápida é atravessada pela média móvel lenta, indicando que uma tendência de aumento de preços se forma, a estratégia abre mais posições.
Depois, a estratégia define um preço de parada, que é igual ao preço de abertura da posição multiplicado pela proporção de parada definida. Quando o preço atinge esse preço de parada, a estratégia elimina parcialmente a posição, vendendo 50% da posição por padrão. Isso atinge a parada parcial e bloqueia parte dos lucros.
Em seguida, a estratégia também inicia o mecanismo de parada de seguimento de tendência. Quando o preço continua a subir, o preço de parada segue o preço com uma proporção de passo definida trailingTakeProfitDeviationPerc. Isso permite que o preço de parada acompanhe a tendência de alta do preço e realize o ponto de parada de seguimento de tendência.
Ao mesmo tempo, a estratégia também inicia o rastreamento de stop loss. Quando o preço atinge o preço de stop loss, o preço de stop loss começa a subir o rastreamento, que sempre é mantido no nível do ponto alto multiplicado pela proporção de queda do stop loss. Isso permite que o preço de stop loss possa subir o rastreamento, bloqueando mais lucros e, ao mesmo tempo, controlando o risco de queda.
Quando o preço retorna, a estratégia para de rastrear o preço de stop loss, e dirige-se diretamente para o preço de mercado para a posição de equilíbrio.
Análise de vantagens
A estratégia integra várias funções, como o acompanhamento de tendências, paradas parciais e stop loss de acompanhamento integral, com as seguintes vantagens:
- A capacidade de capturar de forma eficaz as tendências de aumento dos preços e de acertar os sinais de compra;
- O mecanismo de bloqueio parcial permite bloquear parte dos lucros e evitar a recuperação total dos lucros;
- O mecanismo de rastreamento de tendências permite que os preços de suspensão se ajustem ao aumento dos preços;
- Abertura do Stop Loss Tracking para bloquear mais lucros e controlar o risco de queda;
- Os parâmetros da estratégia são configuráveis e podem ser ajustados ao nível de risco que você pode suportar.
Análise de Riscos
A estratégia também apresenta alguns riscos, como:
- A compra pode ocorrer após uma queda acentuada do preço, sem que seja possível parar ou parar o prejuízo, o que leva a uma expansão dos prejuízos;
- No final de uma tendência, o preço de um stop-loss não consegue acompanhar a tendência a tempo e pode ter perdido o seu melhor ponto de parada.
- O preço de stop loss é muito alto e a queda acentuada do preço leva a perdas excessivas;
- A frequência de transações pode ser muito alta e os custos de transação e perdas de ponto de deslizamento são maiores.
Em contrapartida, o que pode ser melhorado e aperfeiçoado são os seguintes aspectos:
- Configurar razoavelmente os parâmetros das médias móveis para evitar sinais errados;
- Reduzir adequadamente a proporção de bloqueios para reduzir o risco;
- Aumentar a margem de perda e controlar os prejuízos individuais;
- Ajustar os parâmetros de proporção de passo para otimizar o efeito do rastreamento de parada.
Direção de otimização
A estratégia ainda tem espaço para ser melhorada:
- A introdução de mais indicadores para avaliar as tendências e evitar falsos avanços;
- A adição de um módulo de gerenciamento de posições para aumentar o tamanho das posições;
- Aumentar o mecanismo de ajuste dinâmico do stop loss para tornar os parâmetros mais automáticos;
- Aumentar o mecanismo de filtragem para evitar transações equivocadas de variedades de alta energia.
Essas otimizações podem tornar as estratégias mais estáveis, mais eficientes e melhorar a performance.
Resumir
A estratégia de stop loss de rastreamento de stop loss de rastreamento de tendência utiliza um conjunto de técnicas como o rastreamento de tendência, o stop stop inteligente e o stop loss de rastreamento completo, com base na captura de tendências de aumento de preços, além de realizar a movimentação do nível de perda de rastreamento e rastreamento de stop loss. Isso permite que a estratégia funcione com a tendência e obtenha mais lucro no mercado de touros.
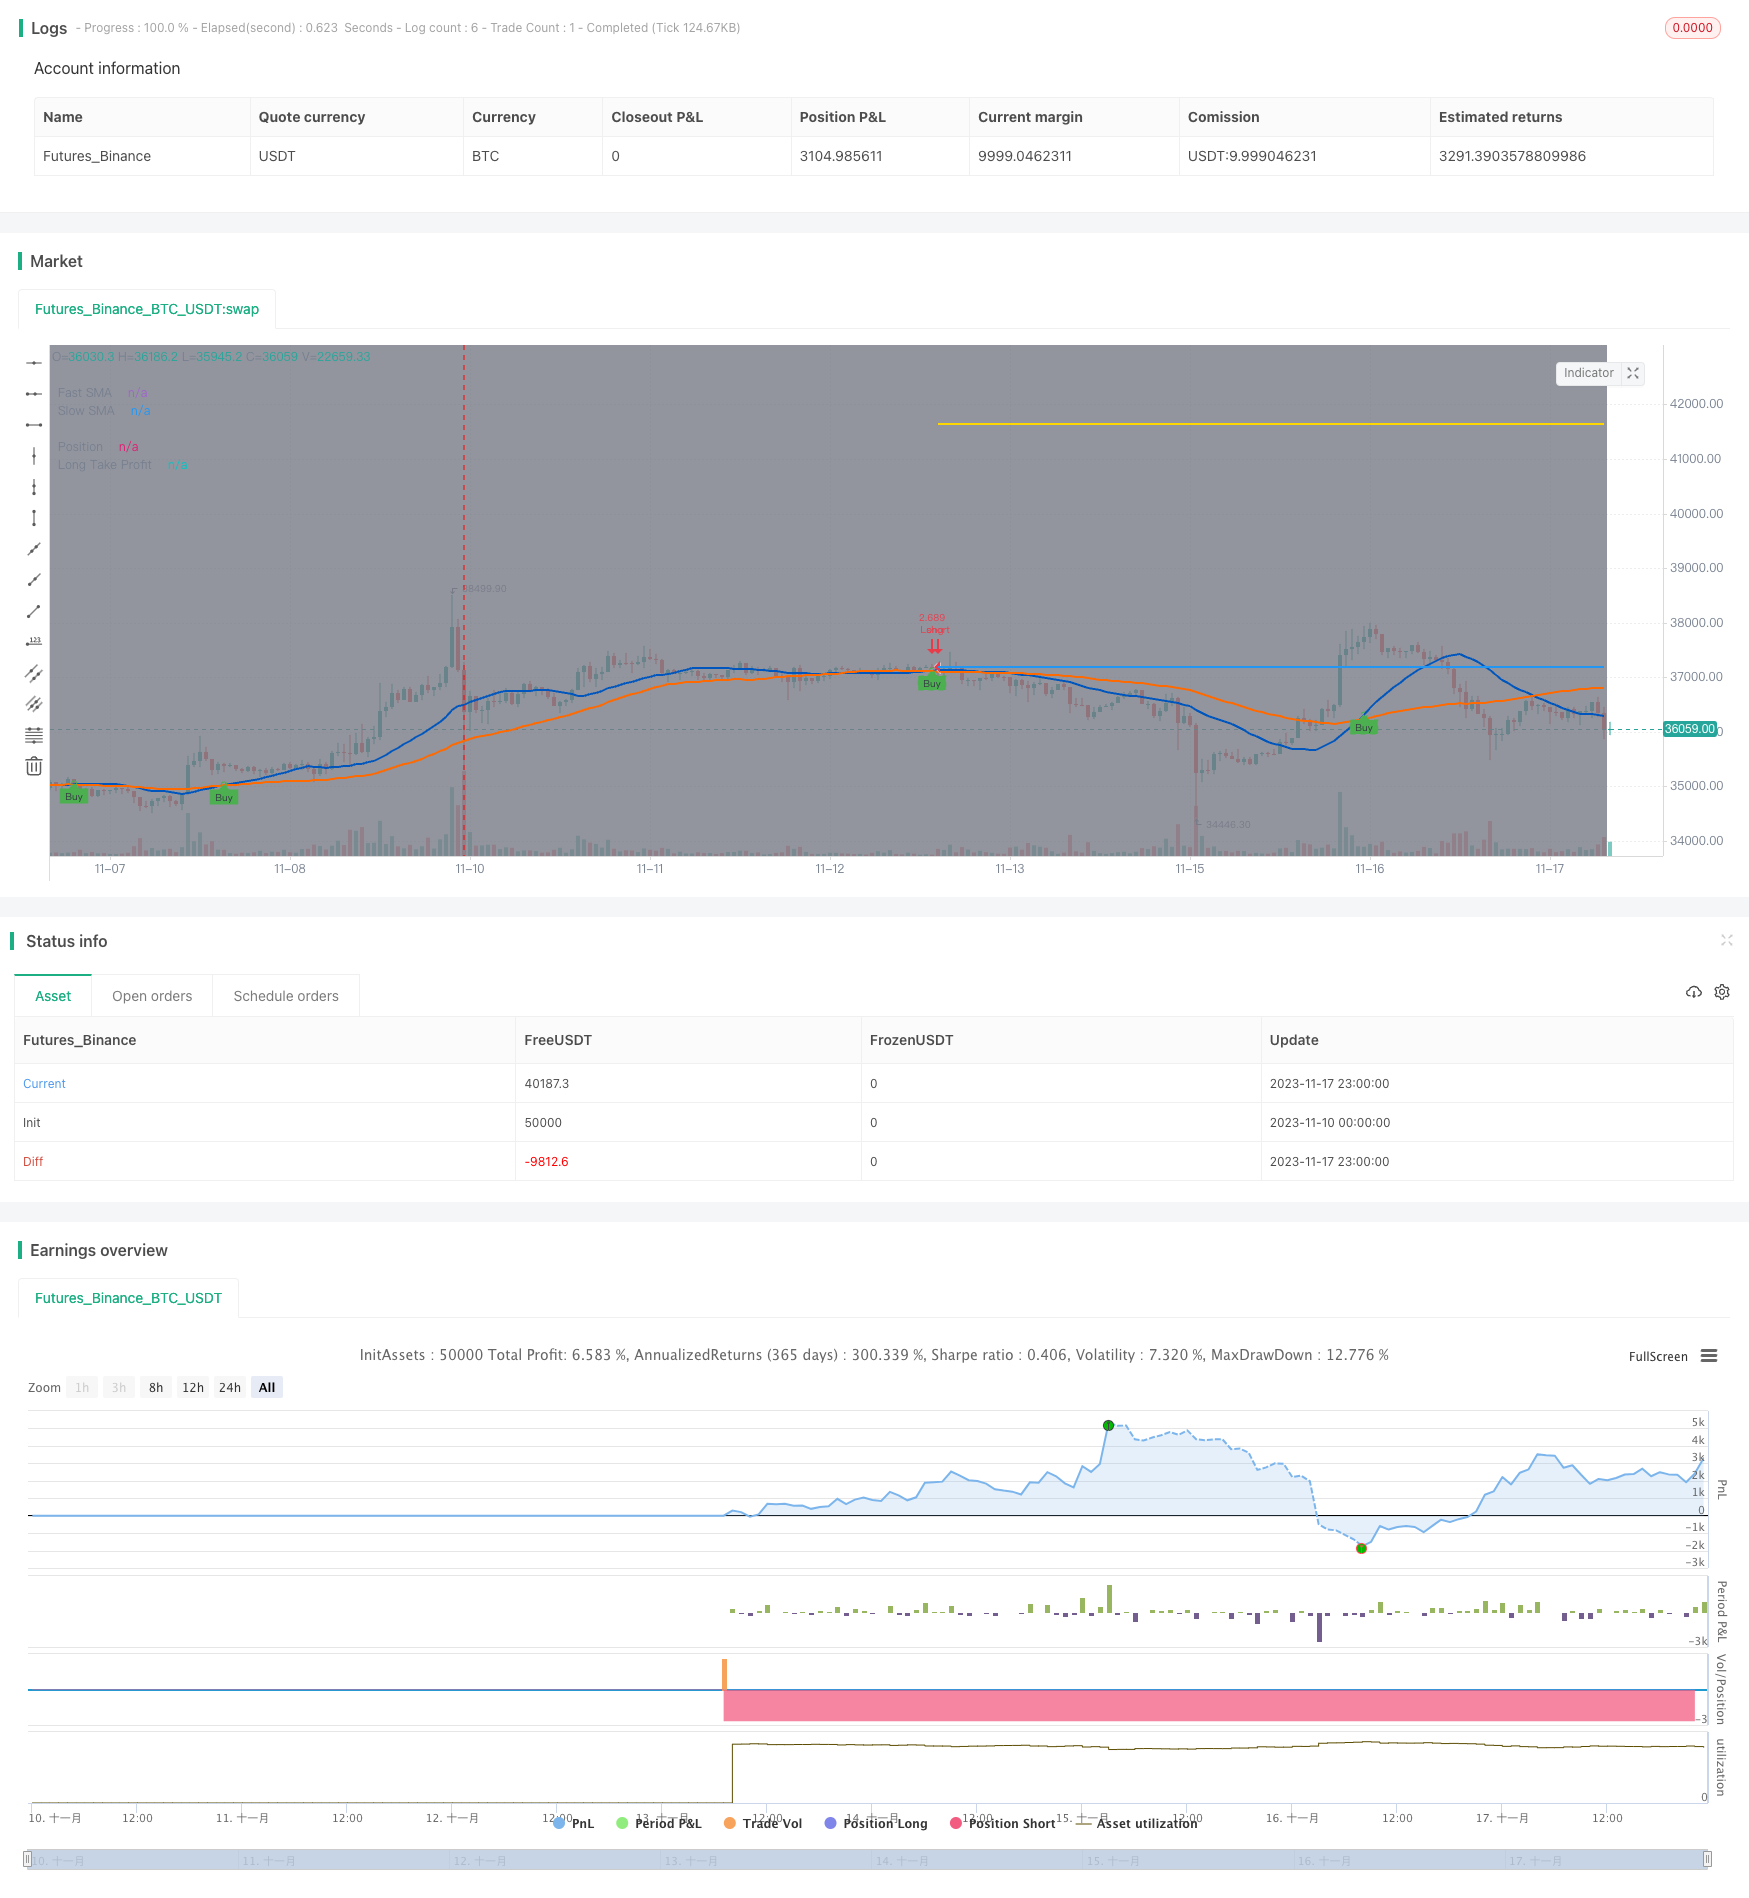
/*backtest
start: 2023-11-10 00:00:00
end: 2023-11-18 00:00:00
period: 1h
basePeriod: 15m
exchanges: [{"eid":"Futures_Binance","currency":"BTC_USDT"}]
*/

//@version=4
//
// ▒▒▒▒▒▒▒▒▒▒▒▒▒▒▒▒▒▒▒▒▒▒▒▒▒▒▒▒▒▒▒▒▒▒▒▒▒▒▒▒▒▒▒▒▒▒▒▒▒▒▒▒▒▒▒▒▒▒▒▒▒▒▒▒▒▒▒▒▒▒▒▒▒▒▒▒▒▒▒▒▒▒▒▒▒▒▒▒▒▒▒▒▒▒▒▒▒▒▒▒▒▒▒▒▒▒▒▒▒▒▒▒▒▒
//  -----------------------------------------------------------------------------
//  Copyright 2021 Iason Nikolas | jason5480
//  Trainiling Take Profit Trailing Stop Loss script may be freely distributed under the MIT license.
//
//  Permission is hereby granted, free of charge,
//  to any person obtaining a copy of this software and associated documentation files (the "Software"),
//  to deal in the Software without restriction, including without limitation the rights to use, copy, modify, merge,
//  publish, distribute, sublicense, and/or sell copies of the Software, and to permit persons to whom the Software is furnished to do so,
//  subject to the following conditions:
//
//  The above copyright notice and this permission notice shall be included in all copies or substantial portions of the Software.
//
//  THE SOFTWARE IS PROVIDED "AS IS", WITHOUT WARRANTY OF ANY KIND,
//  EXPRESS OR IMPLIED, INCLUDING BUT NOT LIMITED TO THE WARRANTIES OF MERCHANTABILITY,
//  FITNESS FOR A PARTICULAR PURPOSE AND NONINFRINGEMENT. IN NO EVENT SHALL THE AUTHORS OR COPYRIGHT HOLDERS BE LIABLE FOR ANY CLAIM,
//  DAMAGES OR OTHER LIABILITY, WHETHER IN AN ACTION OF CONTRACT, TORT OR OTHERWISE, ARISING FROM,
//  OUT OF OR IN CONNECTION WITH THE SOFTWARE OR THE USE OR OTHER DEALINGS IN THE SOFTWARE.
//
//  -----------------------------------------------------------------------------
//
//  Authors:  @jason5480
//  Revision: v1.0.1
//  Date:     18-Apr-2021
//
//  Description
//  =============================================================================
//  This strategy will go long if fast MA crosses over slow MA.
//  The strategy will exit from long position when the price increases by a fixed percentage.
//  If the trailing take profit is checked then the strategy instead of setting a limit order in a predefined price (based on the percentage)
//  it will follow the price with small steps (percentagewise)
//  If the price drops by this percentage then the exit order will be executed
//
//  The strategy has the following parameters:
//
//  Fast SMA Length - How many candles back to calculte the fast SMA.
//  Slow SMA Length - How many candles back to calculte the slow SMA.
//  Take Profit % - The percentage of the price increase to set the take profit price target.
//  Enable Trailing - Enable or disable the trailing for take profit.
//  Training Take Profit Deviation % - The step to follow the price when the take profit limit is reached.
//  Trailing Stop Loss % - The stop loss percentage drop that will close your position. After the take profit price is reached the trailing stop loss price target will follow the price upwards (for long positions).
//
//  -----------------------------------------------------------------------------
//  Disclaimer:
//    1. I am not licensed financial advisors or broker dealer. I do not tell you
//       when or what to buy or sell. I developed this software which enables you
//       execute manual or automated trades using TradingView. The
//       software allows you to set the criteria you want for entering and exiting
//       trades.
//    2. Do not trade with money you cannot afford to lose.
//    3. I do not guarantee consistent profits or that anyone can make money with no
//       effort. And I am not selling the holy grail.
//    4. Every system can have winning and losing streaks.
//    5. Money management plays a large role in the results of your trading. For
//       example: lot size, account size, broker leverage, and broker margin call
//       rules all have an effect on results. Also, your Take Profit and Stop Loss
//       settings for individual pair trades and for overall account equity have a
//       major impact on results. If you are new to trading and do not understand
//       these items, then I recommend you seek education materials to further your
//       knowledge.
//
//    YOU NEED TO FIND AND USE THE TRADING SYSTEM THAT WORKS BEST FOR YOU AND YOUR
//    TRADING TOLERANCE.
//
//    I HAVE PROVIDED NOTHING MORE THAN A TOOL WITH OPTIONS FOR YOU TO TRADE WITH THIS PROGRAM ON TRADINGVIEW.
//
//    I accept suggestions to improve the script.
//    If you encounter any problems I will be happy to share with me.
//  -----------------------------------------------------------------------------
//
// ▒▒▒▒▒▒▒▒▒▒▒▒▒▒▒▒▒▒▒▒▒▒▒▒▒▒▒▒▒▒▒▒▒▒▒▒▒▒▒▒▒▒▒▒▒▒▒▒▒▒▒▒▒▒▒▒▒▒▒▒▒▒▒▒▒▒▒▒▒▒▒▒▒▒▒▒▒▒▒▒▒▒▒▒▒▒▒▒▒▒▒▒▒▒▒▒▒▒▒▒▒▒▒▒▒▒▒▒▒▒▒▒▒▒
// SETUP ============================================================================================================
strategy(title = "Trailing Take Profit Trailing Stop Loss",
         shorttitle = "TTPTSL",
         overlay = true,
         pyramiding = 0,
         default_qty_type = strategy.cash,
         default_qty_value = 100000,
         initial_capital = 100000)

//
// ▒▒▒▒▒▒▒▒▒▒▒▒▒▒▒▒▒▒▒▒▒▒▒▒▒▒▒▒▒▒▒▒▒▒▒▒▒▒▒▒▒▒▒▒▒▒▒▒▒▒▒▒▒▒▒▒▒▒▒▒▒▒▒▒▒▒▒▒▒▒▒▒▒▒▒▒▒▒▒▒▒▒▒▒▒▒▒▒▒▒▒▒▒▒▒▒▒▒▒▒▒▒▒▒▒▒▒▒▒▒▒▒▒▒
// INPUTS ===========================================================================================================

// STRATEGY INPUT ===================================================================================================
fastMALen = input(defval = 21, title = "Fast SMA Length", type = input.integer, group = "Strategy", tooltip = "How many candles back to calculte the fast SMA.")
slowMALen = input(defval = 49, title = "Slow SMA Length", type = input.integer, group = "Strategy", tooltip = "How many candles back to calculte the slow SMA.")

longTakeProfitPerc = input(defval = 12.0, title = 'Take Profit %', type = input.float, step = 0.1, group = "Strategy", tooltip = "The percentage of the price increase to set the take profit price target.") / 100
profitQuantityPerc = input(defval = 50, title = 'Take Profit Quantity %', type = input.float, step = 1.0, group = "Strategy", tooltip = "The percentage of the position that will be withdrawn when the take profit price target is hit.") / 100

enableTrailing = input(defval = true, title = "Enable Trailing", type = input.bool, group = "Strategy", tooltip = "Enable or disable the trailing for take profit.")
trailingTakeProfitDeviationPerc = input(defval = 1.0, title = 'Trailing Take Profit Deviation %', type = input.float, step = 0.05, group = "Strategy", tooltip = "The step to follow the price when the take profit limit is reached.") / 100

longTrailingStopLossPerc  = input(defval = 7.5, title = 'Trailing Stop Loss %',  type = input.float, step = 0.1, group = "Strategy", tooltip = "The stop loss percentage drop that will close your position. After the take profit price is reached the trailing stop loss price target will follow the price upwards (for long positions).") / 100

// BACKTEST PERIOD INPUT ============================================================================================
fromDate = input(defval = timestamp("01 Jan 2021 00:00 UTC"), title = "From Date", type = input.time, minval = timestamp("01 Jan 1970 00:00 UTC"), group = "Backtest Period") // backtest start date
toDate   = input(defval = timestamp("31 Dec 2121 23:59 UTC"), title = "To Date",   type = input.time, minval = timestamp("01 Jan 1970 00:00 UTC"), group = "Backtest Period") // backtest finish date

isWithinBacktestPeriod() => true // create function "within window of time"

// SHOW PLOT INPUT ==================================================================================================
showDate = input(defval = true, title = "Show Backtest Range", type = input.bool, group = "Plot", tooltip = "Gray out the backround of the backtest period.")

//
// ▒▒▒▒▒▒▒▒▒▒▒▒▒▒▒▒▒▒▒▒▒▒▒▒▒▒▒▒▒▒▒▒▒▒▒▒▒▒▒▒▒▒▒▒▒▒▒▒▒▒▒▒▒▒▒▒▒▒▒▒▒▒▒▒▒▒▒▒▒▒▒▒▒▒▒▒▒▒▒▒▒▒▒▒▒▒▒▒▒▒▒▒▒▒▒▒▒▒▒▒▒▒▒▒▒▒▒▒▒▒▒▒▒▒
// STRATEGY =========================================================================================================

fastMA = sma(close, fastMALen)
slowMA = sma(close, slowMALen)

startLongDeal = crossover(fastMA, slowMA)

longTakeProfitPrice = strategy.position_avg_price * (1 + longTakeProfitPerc)

longTrailingTakeProfitStepTicks = longTakeProfitPrice * trailingTakeProfitDeviationPerc / syminfo.mintick

// determine trailing stop loss price. Trailing starts when the take profit price is reached
longTrailingStarted = false
longTrailingStarted := if (strategy.position_size > 0)
    crossover(high, longTakeProfitPrice) or (high[1] >= longTakeProfitPrice) or longTrailingStarted[1]
else
    false

float longTrailingStopLossPrice = na
longTrailingStopLossPrice := if (strategy.position_size > 0)
    stopValue = longTrailingStarted == true ? high * (1 - longTrailingStopLossPerc) : strategy.position_avg_price * (1 - longTrailingStopLossPerc)
    max(stopValue, nz(longTrailingStopLossPrice[1]))
else
    na

//
// ▒▒▒▒▒▒▒▒▒▒▒▒▒▒▒▒▒▒▒▒▒▒▒▒▒▒▒▒▒▒▒▒▒▒▒▒▒▒▒▒▒▒▒▒▒▒▒▒▒▒▒▒▒▒▒▒▒▒▒▒▒▒▒▒▒▒▒▒▒▒▒▒▒▒▒▒▒▒▒▒▒▒▒▒▒▒▒▒▒▒▒▒▒▒▒▒▒▒▒▒▒▒▒▒▒▒▒▒▒▒▒▒▒▒
// STRATEGY EXECUTION ===============================================================================================

if (isWithinBacktestPeriod())
    // getting into LONG position
    strategy.entry(id = "Long", long = strategy.long, when = startLongDeal, comment = "Long", alert_message = "Long("  + syminfo.ticker + "): Started")
    if (strategy.position_size > 0)
        strategy.exit(id = "TTP", from_entry = "Long", qty = profitQuantityPerc * strategy.position_size, limit = enableTrailing ? na : longTakeProfitPrice, trail_price = enableTrailing ? longTakeProfitPrice : na, trail_offset = enableTrailing ? longTrailingTakeProfitStepTicks : na, oca_name = 'Exit Long', comment = "Long Take Profit", alert_message = "Long(" + syminfo.ticker + "): Trailing Take Profit activated")
        strategy.order(id = "TSL", long = strategy.short, qty = strategy.position_size, stop = longTrailingStopLossPrice, oca_name = 'Exit Long', oca_type = strategy.oca.cancel, comment = "Stop/Trail", when = true, alert_message = "Long("  + syminfo.ticker + "): Trailing Stop Loss activated")
    else
        strategy.cancel(id = "TTP", when = true)
        strategy.cancel(id = "TSL", when = true)

//
// ▒▒▒▒▒▒▒▒▒▒▒▒▒▒▒▒▒▒▒▒▒▒▒▒▒▒▒▒▒▒▒▒▒▒▒▒▒▒▒▒▒▒▒▒▒▒▒▒▒▒▒▒▒▒▒▒▒▒▒▒▒▒▒▒▒▒▒▒▒▒▒▒▒▒▒▒▒▒▒▒▒▒▒▒▒▒▒▒▒▒▒▒▒▒▒▒▒▒▒▒▒▒▒▒▒▒▒▒▒▒▒▒▒▒
// PLOT DATE POSITION MA AND TRAILING TAKE PROFIT STOP LOSS =========================================================

bgcolor(color = showDate and isWithinBacktestPeriod() ? color.gray : na, transp = 90)

plot(series = fastMA, color = #0056BD, style = plot.style_line, linewidth = 2, title = "Fast SMA")
plot(series = slowMA, color = #FF6A00, style = plot.style_line, linewidth = 2, title = "Slow SMA")
plotshape(series = isWithinBacktestPeriod() and startLongDeal and strategy.position_size <= 0 ? fastMA : na, title = "UpTrend Begins", location = location.absolute, style = shape.circle, size = size.tiny, color = color.green, transp = 0)
plotshape(series = isWithinBacktestPeriod() and startLongDeal and strategy.position_size <= 0 ? fastMA : na, title = "Buy", text = "Buy", location = location.absolute, style = shape.labelup, size = size.tiny, color = color.green, textcolor = color.black, transp = 0)

plot(series = strategy.position_avg_price, color = color.blue, style = plot.style_linebr, linewidth = 2, title = "Position")
plot(series = longTakeProfitPrice, color = #FFD700, style = plot.style_linebr, linewidth = 2, title = "Long Take Profit")
plot(series = longTrailingStopLossPrice, color = color.fuchsia, style = plot.style_linebr, linewidth = 2, title = "Long Trail Stop")

// ==================================================================================================================