Estratégia de negociação de média móvel de rompimento de momentum
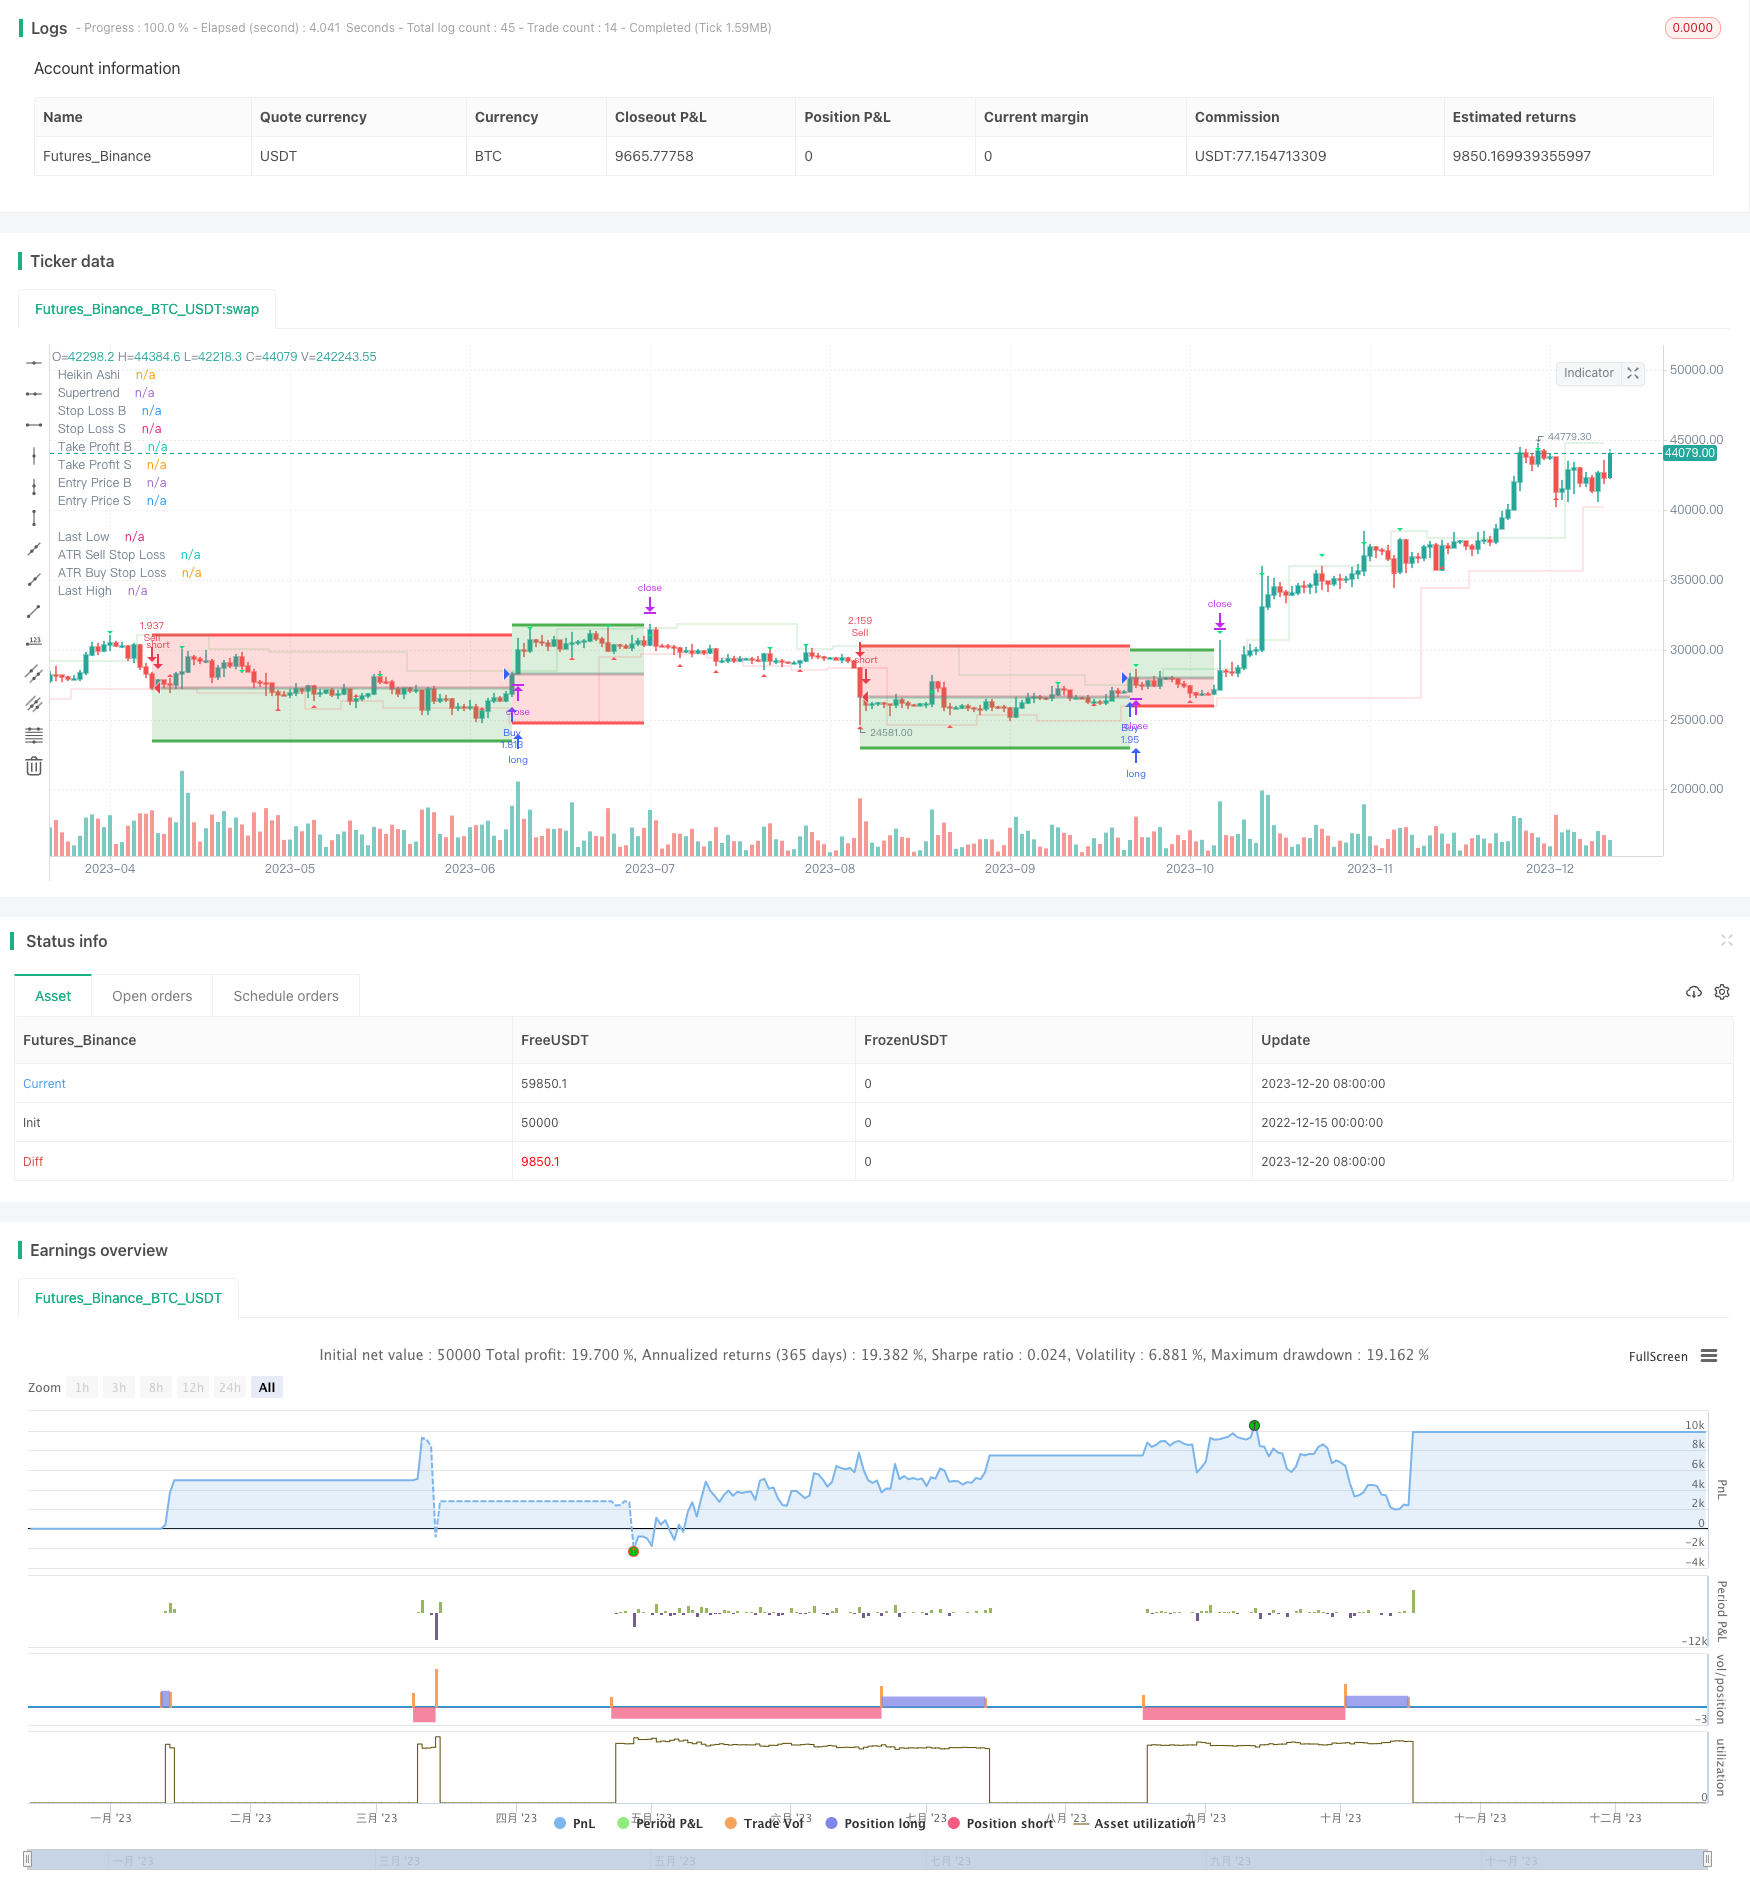
Visão geral
A estratégia usa indicadores de tendência super para identificar a direção da tendência do mercado, em combinação com a forma de Heikin Ashi para o lançamento. Além disso, a estratégia prevê o stop loss e o stop loss para bloquear os lucros.
Princípio da estratégia
O indicador de tendência super usada para determinar a direção da tendência do mercado. O indicador baseia-se na média real de oscilação e um determinado número de vezes para determinar a ascensão e descensão. Quando o preço quebra a ascensão é um sinal de otimismo, e vice-versa, um sinal de baixa.
Combinação de Heikin Ashi com o filtro de forma de gráfico de entrada no mercado. Quando o indicador de tendência super emitir um sinal, ao mesmo tempo Heikin Ashi faz mais quando o indicador de tendência é positivo e vazio quando o indicador de tendência é negativo.
A estratégia oferece várias formas de parar, como parar proporcional, parar fixo, parar de fluxo real médio e parar de ponto central. As formas de parar incluem parar proporcional, parar fixo, parar de retorno de risco e assim por diante.
Análise de vantagens
Os indicadores de tendências super podem ser usados para monitorar as tendências do mercado e evitar a perda de oportunidades importantes.
O filtro Heikin Ashi é usado para reduzir transações desnecessárias e aumentar a probabilidade de vitória.
Existem várias opções de bloqueio de perdas, que podem ser configuradas de acordo com as preferências pessoais para controlar o risco de forma eficaz.
Pode-se escolher se é possível ou não reiniciar ativamente a posição em equilíbrio quando novos sinais surgirem, garantindo sempre acompanhar as tendências mais recentes.
Análise de Riscos
Os indicadores de tendência super estão atrasados em reagir às mudanças no mercado e podem perder o ponto de viragem da tendência.
O filtro de Heikin Ashi não pode evitar completamente a ocorrência de transações perdedoras.
A configuração errada do stop loss pode levar a uma partida prematura ou a uma perda excessiva.
A repetição frequente de transações leva a custos mais elevados e a riscos de deslizamento.
Pode-se reduzir o risco acima mencionado, ajustando os parâmetros do indicador de tendência super, combinando outros indicadores como filtro e otimizando o stop loss.
Direção de otimização
Ajustar os parâmetros do indicador de tendência super para encontrar a melhor combinação de parâmetros.
Tente usar diferentes dados de preços como fontes de cálculo de indicadores de tendências, como preços de fechamento, preços médios, etc.
Adicionar outros filtros de avaliação de indicadores, como o indicador KDJ, a média móvel, etc.
Optimizar a configuração do Stop Loss Stop para obter a melhor relação de risco/retorno.
Teste a eficácia de abrir posições de quantidade fixa ou proporcional ao capital.
Resumir
A estratégia integra indicadores de tendências super e tecnologia Heikin Ashi, que permite obter efetivamente os benefícios da tendência do mercado, seguindo a direção da tendência e escolhendo o momento certo para a entrada no mercado. Ao mesmo tempo, a configuração flexível de stop-loss também permite o controle de risco. A estabilidade e a lucratividade da estratégia podem ser aumentadas ainda mais com a otimização de parâmetros e a adição de outras condições de filtro.
/*backtest
start: 2022-12-15 00:00:00
end: 2023-12-21 00:00:00
period: 1d
basePeriod: 1h
exchanges: [{"eid":"Futures_Binance","currency":"BTC_USDT"}]
*/


//# * —————————————————————————————————————————————————————————————————————————————————————————————————————————————————————
//# *
//# *  Script       |  [MT Trader] Backtest Template w/ Supertrend Strategy
//# *  Description  |  Small template open source made in pinescript with the purpose of testing
//# *                  different strategies and how they could be improved
//# *
//# *  Author       |  ©VertMT
//# *
//# *  Pinescript   |  https://www.tradingview.com/pine-script-docs/en/v5/Introduction.html
//# *                 @version=5
//# *
//# *  Revision History
//# *    Release    |  Jul 30, 2022  | Initial Release
//# *
//# *
//# *  Reference    |  https://tradingview.com/script/wzevYXew-TEMPLATE-Code-Block-Comments/
//# *
//# *
//# *    ███▄ ▄███▓ ▄▄▄█████▓
//# *   ▓██▒▀█▀ ██▒ ▓  ██▒ ▓▒
//# *   ▓██    ▓██░ ▒ ▓██░ ▒░
//# *   ▒██    ▒██  ░ ▓██▓ ░
//# *   ▒██▒   ░██▒   ▒██▒ ░
//# *   ░ ▒░   ░  ░   ▒ ░░
//# *   ░  ░      ░     ░
//# *   ░      ░      ░
//# *
//# * —————————————————————————————————————————————————————————————————————————————————————————————————————————————————————

//@version=5
strategy("[MT Trader] Backtest template w/ SuperTrend Strategy", overlay=true, pyramiding = 0, calc_on_order_fills = false, commission_type = strategy.commission.percent, commission_value = 0.03, default_qty_type = strategy.percent_of_equity, default_qty_value = 100, initial_capital=100, currency=currency.USD, process_orders_on_close=true, backtest_fill_limits_assumption=0)


// ————————————————————————————————————————————————————————————————————————————————————————————————————————————————————————
// —————————————————————————————————————— 1. 📆 Timeframe 📆 ——————————————————————————————————————————————————————————————
//# * —————————————————————————————————————————————————————————————————————————————————————————————————————————————————————
//# *
//# *        In this section you can configure the strategy so that it only runs between 2
//# *               time periods, being also able to adjust to any time zone.
//# *
//# *        En este apartado se puede configurar la estrategia para que solo se ejecute entre
//# *        2 periodos de tiempo, siendo capaz tambien de ajustarse a cualquier zona horaria.
//# *
// ————————————————————————————————————————————————————————————————————————————————————————————————————————————————————————


dateFilter  = input.bool(group='📆 Timeframe 📆', defval=false)
startTime   = input(group='📆 Timeframe 📆', defval=timestamp('01 Jan 2022 00:00'), title='Start Time')
endTime     = input(group='📆 Timeframe 📆', defval=timestamp('31 Dec 2022 23:45'), title='End Time')
zoneTime    = input.string("UTC", options = ["UTC-10", "UTC-8", "UTC-7", "UTC-6", "UTC-5", "UTC-4", "UTC-3", "UTC", "UTC+1", "UTC+2", "UTC+3", "UTC+4", "UTC+4:30", "UTC+5", "UTC+5:30", "UTC+6", "UTC+7", "UTC+8", "UTC+9", "UTC+9:30", "UTC+10", "UTC+11", "UTC+12", "UTC+12:45", "UTC+13"], title='UTC', group='📆 Timeframe 📆', tooltip="Match this time zone with that of your graph so that all values are displayed correctly. \n\nHaga coincidir esta zona horaria con la de su gráfico para que todos los valores se muestren correctamente.")

cTime = timestamp(year(timenow), month(timenow), dayofmonth(timenow), hour(timenow), minute(timenow))
sTime = timestamp(year(startTime), month(startTime), dayofmonth(startTime), hour(startTime), minute(startTime), second(startTime))
eTime = timestamp(year(endTime), month(endTime), dayofmonth(endTime), hour(endTime), minute(endTime), second(endTime))

bgcolor(dateFilter and time == sTime or dateFilter and time == eTime?color.new(color.white, 80):na, title="Date Range")
plotshape(dateFilter and time == sTime, title="Start Time", style=shape.labelup, location=location.belowbar, color=color.white, text="Start", textcolor=color.black, size=size.tiny)
plotshape(dateFilter and time == eTime, title="End Time",   style=shape.labelup, location=location.belowbar, color=color.white, text="End",   textcolor=color.black, size=size.tiny)

zcTime = zoneTime == "UTC-10" ? cTime - 10*60*60000 : zoneTime == "UTC-8" ? cTime - 8*60*60000 : zoneTime == "UTC-7" ? cTime - 7*60*60000 : zoneTime == "UTC-6" ? cTime - 6*60*60000 : zoneTime == "UTC-5" ? cTime - 5*60*60000 : zoneTime == "UTC-4" ? cTime - 4*60*60000 : zoneTime == "UTC-3" ? cTime - 3*60*60000 : zoneTime == "UTC" ? cTime - 0*60*60000 : zoneTime == "UTC+1" ? cTime + 1*60*60000 :  zoneTime == "UTC+2" ? cTime + 2*60*60000 : zoneTime == "UTC+3" ? cTime + 3*60*60000 : zoneTime == "UTC+4" ? cTime + 4*60*60000 : zoneTime == "UTC+4:30" ? cTime + 4*60*60000 + 30*60000 : zoneTime == "UTC+5" ? cTime + 5*60*60000 : zoneTime == "UTC+5" ? cTime + 5*60*60000 + 30*60000 : zoneTime == "UTC+6" ? cTime + 6*60*60000 : zoneTime == "UTC+7" ? cTime + 7*60*60000 : zoneTime == "UTC+8" ? cTime + 8*60*60000 : zoneTime == "UTC+9" ? cTime + 9*60*60000 : zoneTime == "UTC+9" ? cTime + 9*60*60000 + 30*60000 : zoneTime == "UTC+10" ? cTime + 10*60*60000 : zoneTime == "UTC+11" ? cTime + 11*60*60000 : zoneTime == "UTC+12" ? cTime + 12*60*60000 : zoneTime == "UTC+12:45" ? cTime + 12*60*60000 + 45*60000 : zoneTime == "UTC+13" ? cTime + 13*60*60000 : 0
zsTime = zoneTime == "UTC-10" ? sTime - 10*60*60000 : zoneTime == "UTC-8" ? sTime - 8*60*60000 : zoneTime == "UTC-7" ? sTime - 7*60*60000 : zoneTime == "UTC-6" ? sTime - 6*60*60000 : zoneTime == "UTC-5" ? sTime - 5*60*60000 : zoneTime == "UTC-4" ? sTime - 4*60*60000 : zoneTime == "UTC-3" ? sTime - 3*60*60000 : zoneTime == "UTC" ? sTime - 0*60*60000 : zoneTime == "UTC+1" ? sTime + 1*60*60000 :  zoneTime == "UTC+2" ? sTime + 2*60*60000 : zoneTime == "UTC+3" ? sTime + 3*60*60000 : zoneTime == "UTC+4" ? sTime + 4*60*60000 : zoneTime == "UTC+4:30" ? sTime + 4*60*60000 + 30*60000 : zoneTime == "UTC+5" ? sTime + 5*60*60000 : zoneTime == "UTC+5" ? sTime + 5*60*60000 + 30*60000 : zoneTime == "UTC+6" ? sTime + 6*60*60000 : zoneTime == "UTC+7" ? sTime + 7*60*60000 : zoneTime == "UTC+8" ? sTime + 8*60*60000 : zoneTime == "UTC+9" ? sTime + 9*60*60000 : zoneTime == "UTC+9" ? sTime + 9*60*60000 + 30*60000 : zoneTime == "UTC+10" ? sTime + 10*60*60000 : zoneTime == "UTC+11" ? sTime + 11*60*60000 : zoneTime == "UTC+12" ? sTime + 12*60*60000 : zoneTime == "UTC+12:45" ? sTime + 12*60*60000 + 45*60000 : zoneTime == "UTC+13" ? sTime + 13*60*60000 : 0
zeTime = zoneTime == "UTC-10" ? eTime - 10*60*60000 : zoneTime == "UTC-8" ? eTime - 8*60*60000 : zoneTime == "UTC-7" ? eTime - 7*60*60000 : zoneTime == "UTC-6" ? eTime - 6*60*60000 : zoneTime == "UTC-5" ? eTime - 5*60*60000 : zoneTime == "UTC-4" ? eTime - 4*60*60000 : zoneTime == "UTC-3" ? eTime - 3*60*60000 : zoneTime == "UTC" ? eTime - 0*60*60000 : zoneTime == "UTC+1" ? eTime + 1*60*60000 :  zoneTime == "UTC+2" ? eTime + 2*60*60000 : zoneTime == "UTC+3" ? eTime + 3*60*60000 : zoneTime == "UTC+4" ? eTime + 4*60*60000 : zoneTime == "UTC+4:30" ? eTime + 4*60*60000 + 30*60000 : zoneTime == "UTC+5" ? eTime + 5*60*60000 : zoneTime == "UTC+5" ? eTime + 5*60*60000 + 30*60000 : zoneTime == "UTC+6" ? eTime + 6*60*60000 : zoneTime == "UTC+7" ? eTime + 7*60*60000 : zoneTime == "UTC+8" ? eTime + 8*60*60000 : zoneTime == "UTC+9" ? eTime + 9*60*60000 : zoneTime == "UTC+9" ? eTime + 9*60*60000 + 30*60000 : zoneTime == "UTC+10" ? eTime + 10*60*60000 : zoneTime == "UTC+11" ? eTime + 11*60*60000 : zoneTime == "UTC+12" ? eTime + 12*60*60000 : zoneTime == "UTC+12:45" ? eTime + 12*60*60000 + 45*60000 : zoneTime == "UTC+13" ? eTime + 13*60*60000 : 0

tradeDateIsAllowed() =>
    dateFilter ? time >= sTime and time <= eTime : true
dateRange = tradeDateIsAllowed()


// ————————————————————————————————————————————————————————————————————————————————————————————————————————————————————————
// —————————————————————————————————————— 2. 🔰 Strategy 🔰 ———————————————————————————————————————————————————————————————
//# * —————————————————————————————————————————————————————————————————————————————————————————————————————————————————————
//# *
//# *                Here are located the options that you can use in this strategy.
//# *
//# *           Aqui se encuentran ubicados las opciones que puedes utilizar en esta estrategia.
//# *
//# *
//# *  Heikin Ashi  |  https://tradingview.com/script/U1QGgSOw-Heikin-Ashi-Source-Function-HTF/
//# *
// ————————————————————————————————————————————————————————————————————————————————————————————————————————————————————————


superTrend    =   input.bool(group='🔰 Strategy 🔰', defval=true,    title="Supertrend")
closeNewEntry =   input.bool(group='🔰 Strategy 🔰', defval=true,    title="Close Position on New Entry", tooltip="When it is active and a new alert is fired, the current position is closed to open a new one, otherwise, the operations only close when reach sl/tp \n\nCuando está activa y una nueva alerta es disparada se cierra la posicion actual para abrir una nueva, en caso contrario las operaciones solo se cierran al tocar sl/tp")
heikinPrice   =   input.bool(group='🔰 Strategy 🔰', defval=false,   title="Heikin Ashi Entry", tooltip="When activated, entries will be based on Heikin Ashi candles but executed at Japanese candles prices. Disable the border of the candles from chart settings for a better experience. \n\nCuando se active, las entradas se basarán en velas heikin ashi pero se ejecutarán a precios de velas japonesas. Deshabilite el borde de las velas desde la configuración del gráfico para una mejor experiencia.")


// —————————————————————————————————————— 1. Heikin Ashi Entry —————————————————————————————————————————————————————————————————


heikin(_src)  =>
    Close  = not heikinPrice ? close : ohlc4
    Open   = float(na)
    Open  := not heikinPrice ? open  : na(Open[1]) ? (open + close) / 2 : (nz(Open[1]) + nz(Close[1])) / 2
    High   = not heikinPrice ? high  : math.max(high, math.max(Open, Close))
    Low    = not heikinPrice ? low   : math.min(low,  math.min(Open, Close))
    HL2    = not heikinPrice ? hl2   : math.avg(High, Low)
    HLC3   = not heikinPrice ? hlc3  : math.avg(High, Low, Close)
    OHLC4  = not heikinPrice ? ohlc4 : math.avg(Open, High, Low, Close)
    HLCC4  = not heikinPrice ? ohlc4 : math.avg(High, Low, Close, Close)
    Price  = _src == 'close' ? Close : _src == 'open' ? Open : _src == 'high' ? High : _src == 'low' ? Low : _src == 'hl2' ? HL2 : _src == 'hlc3' ? HLC3 : _src == 'ohlc4' ? OHLC4 : HLCC4
    Source = math.round(Price / syminfo.mintick) * syminfo.mintick

heikinColor   = heikin('close') > heikin('open') ? #26a69a : #ef5350
plotcandle(heikin('open'), heikin('high'), heikin('low'), heikin('close'), title="Heikin Ashi", color=heikinColor, wickcolor=heikinColor, bordercolor=heikinColor)
barcolor(color=color.new(heikinPrice ? heikinColor:na, 100))

Open  = heikinPrice ? heikin('open')  : open
High  = heikinPrice ? heikin('high')  : high
Low   = heikinPrice ? heikin('low')   : low
Close = heikinPrice ? heikin('close') : close
HL2   = heikinPrice ? heikin('hl2')   : hl2
HLC3  = heikinPrice ? heikin('hl3')   : hlc3
OHLC4 = heikinPrice ? heikin('ohlc4') : ohlc4
HLCC4 = heikinPrice ? heikin('hlcc4') : hlcc4


// ————————————————————————————————————————————————————————————————————————————————————————————————————————————————————————
// —————————————————————————————————————— 2-1. Indicators —————————————————————————————————————————————————————————————————
//# * —————————————————————————————————————————————————————————————————————————————————————————————————————————————————————
//# *
//# *                         Here are the indicators used for the strategy
//# *
//# *                  Aqui se encuentran los indicadores usados para la estrategia.
//# *
//# *
//# *  Supertrend  |  https://tradingview.com/script/P5Gu6F8k/
//# *
// ————————————————————————————————————————————————————————————————————————————————————————————————————————————————————————

// —————————————————————————————————————— 1. Supertrend ———————————————————————————————————————————————————————————————————


stPeriods    = input(group="Supertrend", title='ATR Period', defval=10)
stSourceX    = input(group="Supertrend", title='Source', defval=hl2)
stMultiplier = input.float(group="Supertrend", title='ATR Multiplier', defval=3.0, step=0.1)
stChangeATR  = input(group="Supertrend", title='Change ATR Calculation Method ?', defval=false)
showsignals  = input(group="Supertrend", title='Plot Supertrend', defval=false)

varip float stSource = 0.0
stSource := stSourceX == close ? Close : stSourceX == open ? Open : stSourceX == high ? High : stSourceX == low ? Low : stSourceX == hl2 ? HL2 : stSourceX == hlc3 ? HLC3 : stSourceX == ohlc4 ? OHLC4 : HLCC4

tr   = math.max(High - Low, math.abs(High - Close[1]), math.abs(Low - Close[1]))    // The true range and functions that need olhc need to be calculated with the custom olhc values
atr2 = ta.sma(tr, stPeriods)                                                        // in lines 117-124 for the heikin ashi entries, otherwise the functions will be calculated with
atr  = stChangeATR ? atr2 : ta.rma(tr, stPeriods)                                   // Japanese values and the entries will be in Japanese candlesticks.
up   = stSource - stMultiplier * atr
up1  = nz(up[1], up)                                                                // El rango verdadero y las funciones que necesitan olhc, necesitan ser calculados con los valores
up   := Close[1] > up1 ? math.max(up, up1) : up                                     // olhc personalizados en las líneas 117-124 para las entradas heikin ashi, de lo contrario las
dn   = stSource + stMultiplier * atr                                                // funciones serán calculadas con valores japoneses y las entradas estarán en velas japonesas.
dn1  = nz(dn[1], dn)
dn   := Close[1] < dn1 ? math.min(dn, dn1) : dn
trend = 1
trend := nz(trend[1], trend)
trend := trend == -1 and Close > dn1 ? 1 : trend == 1 and Close < up1 ? -1 : trend

supertrend = trend == 1 ? true : false         //🔵
supertrendBuy  = trend == 1 and trend[1] == -1 //🟢
supertrendSell = trend == -1 and trend[1] == 1 //🔴


upPlot = plot(trend == 1 and showsignals ? up : na, title='Supertrend', style=plot.style_linebr, color=color.new(color.green, 0), linewidth=2)
dnPlot = plot(trend != 1 and showsignals ? dn : na, title='Supertrend', style=plot.style_linebr, color=color.new(color.red,   0), linewidth=2)

plotshape(supertrendBuy  and showsignals ? up : na, title='Supertrend', style=shape.circle,      color=color.new(color.green, 0), location=location.absolute, size=size.tiny)
plotshape(supertrendBuy  and showsignals ? up : na, title='Supertrend', style=shape.labelup,     color=color.new(color.green, 0), location=location.absolute, text='Buy',  textcolor=color.new(color.white, 0))

plotshape(supertrendSell and showsignals ? dn : na, title='Supertrend', style=shape.circle,      color=color.new(color.red,   0), location=location.absolute, size=size.tiny)
plotshape(supertrendSell and showsignals ? dn : na, title='Supertrend', style=shape.labeldown,   color=color.new(color.red,   0), location=location.absolute, text='Sell', textcolor=color.new(color.white, 0))

mPlot = plot(ohlc4, title='Supertrend', style=plot.style_circles, linewidth=0, color=color.new(color.white, 100))
longFillColor  = trend ==  1 ? color.green : color.white
shortFillColor = trend == -1 ? color.red   : color.white
fill(mPlot, upPlot, title='UpTrend Highligter',   color=color.new(longFillColor,  90))
fill(mPlot, dnPlot, title='DownTrend Highligter', color=color.new(shortFillColor, 90))


// ————————————————————————————————————————————————————————————————————————————————————————————————————————————————————————
// —————————————————————————————————————— 3. Stop Loss and Take Profit ————————————————————————————————————————————————————
//# * —————————————————————————————————————————————————————————————————————————————————————————————————————————————————————
//# *
//# *           Various options for stop loss and take profit are already pre-programmed to
//# *                   protect the investment from unexpected market movements.
//# *
//# *           Diversas opciones para stop loss y take profit se encuentran ya pre-programadas
//# *               para asi proteger la inversion de movimientos innesperados del mercado
//# *
//# *
// ————————————————————————————————————————————————————————————————————————————————————————————————————————————————————————


SL       = input.bool(   group="🔴 Stop Loss 🔴",   title="Use Stop Loss",     defval=true)
optionSL = input.string( group="🔴 Stop Loss 🔴",   title="Type of Stop",      defval="Last High/Low",        options = ["Fixed %", "Fixed $", "ATR", "Last High/Low", "Custom"])
fixedPSL = input.float(  group="🔴 Stop Loss 🔴",   title="Fixed %",           defval=1,   minval = 0)  / 100
fixedESL = input.float(  group="🔴 Stop Loss 🔴",   title="Fixed $",           defval=100, minval = 0)
atrL     = input.int(    group="🔴 Stop Loss 🔴",   title="ATR Lenght",        defval=14,  minval = 1)
atrM     = input.float(  group="🔴 Stop Loss 🔴",   title="ATR Multiplier",    defval=1,   minval = 0)
leftBHL  = input.int(    group="🔴 Stop Loss 🔴",   title="Last H/L Left",     defval=5,   minval = 1)
rightBHL = input.int(    group="🔴 Stop Loss 🔴",   title="last H/L Right",    defval=5,   minval = 1)
customSL = input.string( group="🔴 Stop Loss 🔴",   title="Custom",            defval="Custom",         options = ["Custom"])
trailSL  = input.bool(   group="🔴 Stop Loss 🔴",   title="Trailng Stop Loss", defval=false,            tooltip="The maximum stop loss price will decrease as the closing price moves further away from the entry price. \n\nEl precio maximo de stop loss ira disminuyendo mientras el precio de cierre se aleje mas del precio de entrada")

TP       = input.bool(   group="🟢 Take Profit 🟢", title="Use Take Profit",   defval=true)
optionTP = input.string( group="🟢 Take Profit 🟢", title="Type of Stop",      defval="Ratio 1:#",        options = ["Fixed %", "Fixed $", "Ratio 1:#", "Custom"])
fixedPTP = input.float(  group="🟢 Take Profit 🟢", title="Fixed %",           defval=1,   minval = 0)  / 100
fixedETP = input.float(  group="🟢 Take Profit 🟢", title="Fixed $",           defval=100, minval = 0)
ratioTP  = input.float(  group="🟢 Take Profit 🟢", title="Ratio 1:",          defval=1,   minval = 0)
customTP = input.string( group="🟢 Take Profit 🟢", title="Custom",            defval="Custom",         options = ["Custom"])

inOperationB = strategy.position_size >  0 ? true : false
inOperationS = strategy.position_size <  0 ? true : false
inOperation  = strategy.position_size != 0 ? true : false

varip float stopLossB   = 0
varip float takeProfitB = 0
varip float stopLossS   = 0
varip float takeProfitS = 0
varip float entryPrice  = 0
varip float entryPriceB = 0
varip float entryPriceS = 0
varip float trailingB = 0
varip float trailingS = 0

buy  = superTrend and supertrendBuy  //🟢
sell = superTrend and supertrendSell //🔴


// —————————————————————————————————————————— 1. ATR ————————————————————————————————————————————————————————————————————————

atrHigh = ta.rma(ta.tr(true), atrL) * atrM + high
atrLow  = low - ta.rma(ta.tr(true), atrL) * atrM

atrHighPlot = plot(atrHigh, title='ATR Sell Stop Loss', color=color.new(color.red,   not inOperation and optionSL == "ATR" ? 70 : 100), style=plot.style_stepline)
atrLowPlot  = plot(atrLow,  title='ATR Buy Stop Loss',  color=color.new(color.green, not inOperation and optionSL == "ATR" ? 70 : 100), style=plot.style_stepline)


// —————————————————————————————————————— 2. Pivot Points ———————————————————————————————————————————————————————————————————

mb = leftBHL + rightBHL + 1
highestbars_1 = ta.highestbars(mb)
lowestbars_1  = ta.lowestbars(mb)
iff_1 = highestbars_1 == -leftBHL ? high[leftBHL] : na
iff_2 = lowestbars_1  == -leftBHL ?  low[leftBHL] : na
lowest  = not na(high[mb]) ? iff_1 : na
highest = not na( low[mb]) ? iff_2 : na

varip float highestHigh = 0
varip float lowestLow = 0
highestHigh := ta.valuewhen(lowest, high[leftBHL], 0)
lowestLow   := ta.valuewhen(highest, low[leftBHL], 0)

plotshape(highest, title="Last Low",  color=color.new(color.red,   optionSL == "Last High/Low" ?  0 : 100), style=shape.triangleup,   location=location.belowbar, size=size.tiny, offset=-leftBHL)
plotshape(lowest,  title="Last High", color=color.new(color.lime,  optionSL == "Last High/Low" ?  0 : 100), style=shape.triangledown, location=location.abovebar, size=size.tiny, offset=-leftBHL)

plot(lowestLow,    title='Last Low',  color=color.new(color.red,   optionSL == "Last High/Low" ? 70 : 100), style=plot.style_stepline)
plot(highestHigh,  title='Last High', color=color.new(color.green, optionSL == "Last High/Low" ? 70 : 100), style=plot.style_stepline)


// —————————————————————————————————————— 3. Stop Loss ——————————————————————————————————————————————————————————————————————

calculateSL() =>
    varip float stopResult = 0
    varip float stop = 0

    if optionSL == "Fixed %"       and buy
        stop := entryPriceB - ( entryPriceB * fixedPSL)

    if optionSL == "Fixed %"       and sell
        stop := entryPriceS + ( entryPriceS * fixedPSL)

    if optionSL == "Fixed $"       and buy
        stop := entryPriceB - fixedESL

    if optionSL == "Fixed $"       and sell
        stop := entryPriceS + fixedESL

    if optionSL == "Last High/Low" and buy
        stop := lowestLow

    if optionSL == "Last High/Low" and sell
        stop := highestHigh

    if optionSL == "ATR"           and buy
        stop := atrLow

    if optionSL == "ATR"           and sell
        stop := atrHigh

    if optionSL == "Custom"        and buy
        stop := entryPriceB - ( entryPriceB * fixedPSL)

    if optionSL == "Custom"        and sell
        stop := entryPriceS + ( entryPriceS * fixedPSL)

    stopResult := stop


// —————————————————————————————————————— 4. Take Profit ————————————————————————————————————————————————————————————————————

calculateTP() =>
    varip float takeResult = 0
    varip float take = 0

    if optionTP == "Fixed %"            and buy
        take := entryPriceB + ( entryPriceB * fixedPTP)

    if optionTP == "Fixed %"            and sell
        take := entryPriceS - ( entryPriceS * fixedPTP)

    if optionTP == "Fixed $"            and buy
        take := entryPriceB + fixedETP

    if optionTP == "Fixed $"            and sell
        take := entryPriceS - fixedETP

    if optionTP == "Ratio 1:#"          and buy
        take := entryPriceB + ( trailingB * ratioTP )

    if optionTP == "Ratio 1:#"          and sell
        take := entryPriceS - ( trailingS * ratioTP )

    if optionTP == "Custom"             and buy
        take := entryPriceB + ( entryPriceB * fixedPTP)

    if optionTP == "Custom"             and sell
        take := entryPriceS - ( entryPriceS * fixedPTP)

    takeResult := take


// —————————————————————————————————————— 5. BUY ————————————————————————————————————————————————————————————————————————————

if inOperationB and trailSL and not buy
    stopLossBNew = close - trailingB
    stopLossB := stopLossBNew > stopLossB ? stopLossBNew : stopLossB[1]
    strategy.exit("Buy Exit", "Buy", stop=stopLossB, limit=takeProfitB)

if dateRange and buy and (((inOperation and closeNewEntry) or not inOperation))
    entryPrice  := close
    entryPriceB := close
    stopLossB   := SL ? calculateSL() : na
    trailingB   := close - stopLossB
    takeProfitB := TP ? calculateTP() : na
    strategy.entry("Buy", strategy.long, limit=entryPriceB)
    strategy.exit("Buy Exit", "Buy", stop=stopLossB, limit=takeProfitB)

if sell and inOperationB and not closeNewEntry
    strategy.cancel("Buy")

// —————————————————————————————————————— 6. SELL ———————————————————————————————————————————————————————————————————————————

if inOperationS and trailSL and not sell
    stopLossSNew = close + trailingS
    stopLossS := stopLossSNew > stopLossS ? stopLossSNew : stopLossS[1]
    strategy.exit("Sell Exit", "Sell", stop=stopLossS, limit=takeProfitS)

if dateRange and sell and (((inOperation and closeNewEntry) or not inOperation))
    entryPrice  := close
    entryPriceS := close
    stopLossS   := SL ? calculateSL() : na
    trailingS   := stopLossS - close
    takeProfitS := TP ? calculateTP() : na
    strategy.entry("Sell", strategy.short, limit=entryPriceS)
    strategy.exit("Sell Exit", "Sell", stop=stopLossS, limit=takeProfitS)

if sell and inOperationS and not closeNewEntry
    strategy.cancel("Sell")


slbp = plot(stopLossB,   color=color.new(color.red,   inOperationB ?  0 : 100), style=plot.style_linebr, linewidth=3, title="Stop Loss B")
slsp = plot(stopLossS,   color=color.new(color.red,   inOperationS ?  0 : 100), style=plot.style_linebr, linewidth=3, title="Stop Loss S")
tpbp = plot(takeProfitB, color=color.new(color.green, inOperationB ?  0 : 100), style=plot.style_linebr, linewidth=3, title="Take Profit B")
tpsp = plot(takeProfitS, color=color.new(color.green, inOperationS ?  0 : 100), style=plot.style_linebr, linewidth=3, title="Take Profit S")
epbp = plot(entryPriceB, color=color.new(color.gray,  inOperationB ? 50 : 100), style=plot.style_linebr, linewidth=3, title="Entry Price B")
epsp = plot(entryPriceS, color=color.new(color.gray,  inOperationS ? 50 : 100), style=plot.style_linebr, linewidth=3, title="Entry Price S")

fill(epbp, slbp, color=color.new(color.red,   inOperationB ? 75 : 100))
fill(epbp, tpbp, color=color.new(color.green, inOperationB ? 75 : 100))
fill(epsp, slsp, color=color.new(color.red,   inOperationS ? 75 : 100))
fill(epsp, tpsp, color=color.new(color.green, inOperationS ? 75 : 100))