Indicador de momentum rastreia estratégia de mudança de preço de curto prazo
Visão geral
A estratégia usa indicadores de volume para rastrear mudanças de preços de curto prazo, determinar a direção da tendência do mercado e executar operações de compra e venda. A estratégia é chamada de Price Volume Trend Strategy, que reflete a estratégia de usar mudanças de preço e mudanças de volume de transação para determinar a tendência.
Princípio da estratégia
A estratégia começa com o cálculo da dinâmica dos preços. Ao calcular a diferença entre o preço do ciclo atual e o preço do ciclo anterior, pode-se refletir a mudança absoluta do preço no último ciclo. Um valor positivo indica um aumento no preço e um valor negativo indica uma queda no preço.
Quando o preço mais recente é maior do que o movimento médio, o preço está subindo; quando o preço mais recente é menor do que o movimento médio, o preço está caindo. De acordo com este indicador, a direção da tendência do preço é julgada.
Com base na tendência de aumento e queda de preços, execute as operações de compra e venda correspondentes.
Análise de vantagens
- A estratégia é rápida para avaliar as tendências e capturar rapidamente as mudanças de preços de curto prazo, adequada para operações de curta linha.
- Filtragem de volume de transação para evitar falsas descobertas
- Implementação de uma lógica de operação de perseguição de queda
- Frequência de negociação elevada para investidores ativos
Análise de Riscos
- Susceptível a variações anormais do mercado, com risco de falsos sinais
- Risco de deslizamento de transações frequentes
- A tendência é de que os investidores devem investir mais em ações de longo prazo, e não em ações de médio e longo prazo.
Direção de otimização
- Ajustar os parâmetros do indicador de volume de movimento para otimizar o julgamento
- Otimização de parâmetros de filtragem de volume de transação para melhorar a qualidade do sinal
- Aumentar os mecanismos de suspensão de prejuízos e controlar as perdas individuais
- A combinação de mais fatores de julgamento para garantir uma condução multifatorial
Resumir
A estratégia traça tendências de mudanças de preços de curto prazo através de indicadores de dinâmica, para determinar rapidamente a hora de comprar e vender. A vantagem é operar rapidamente, para combater a queda; A desvantagem é a qualidade do sinal e a rentabilidade a longo prazo.
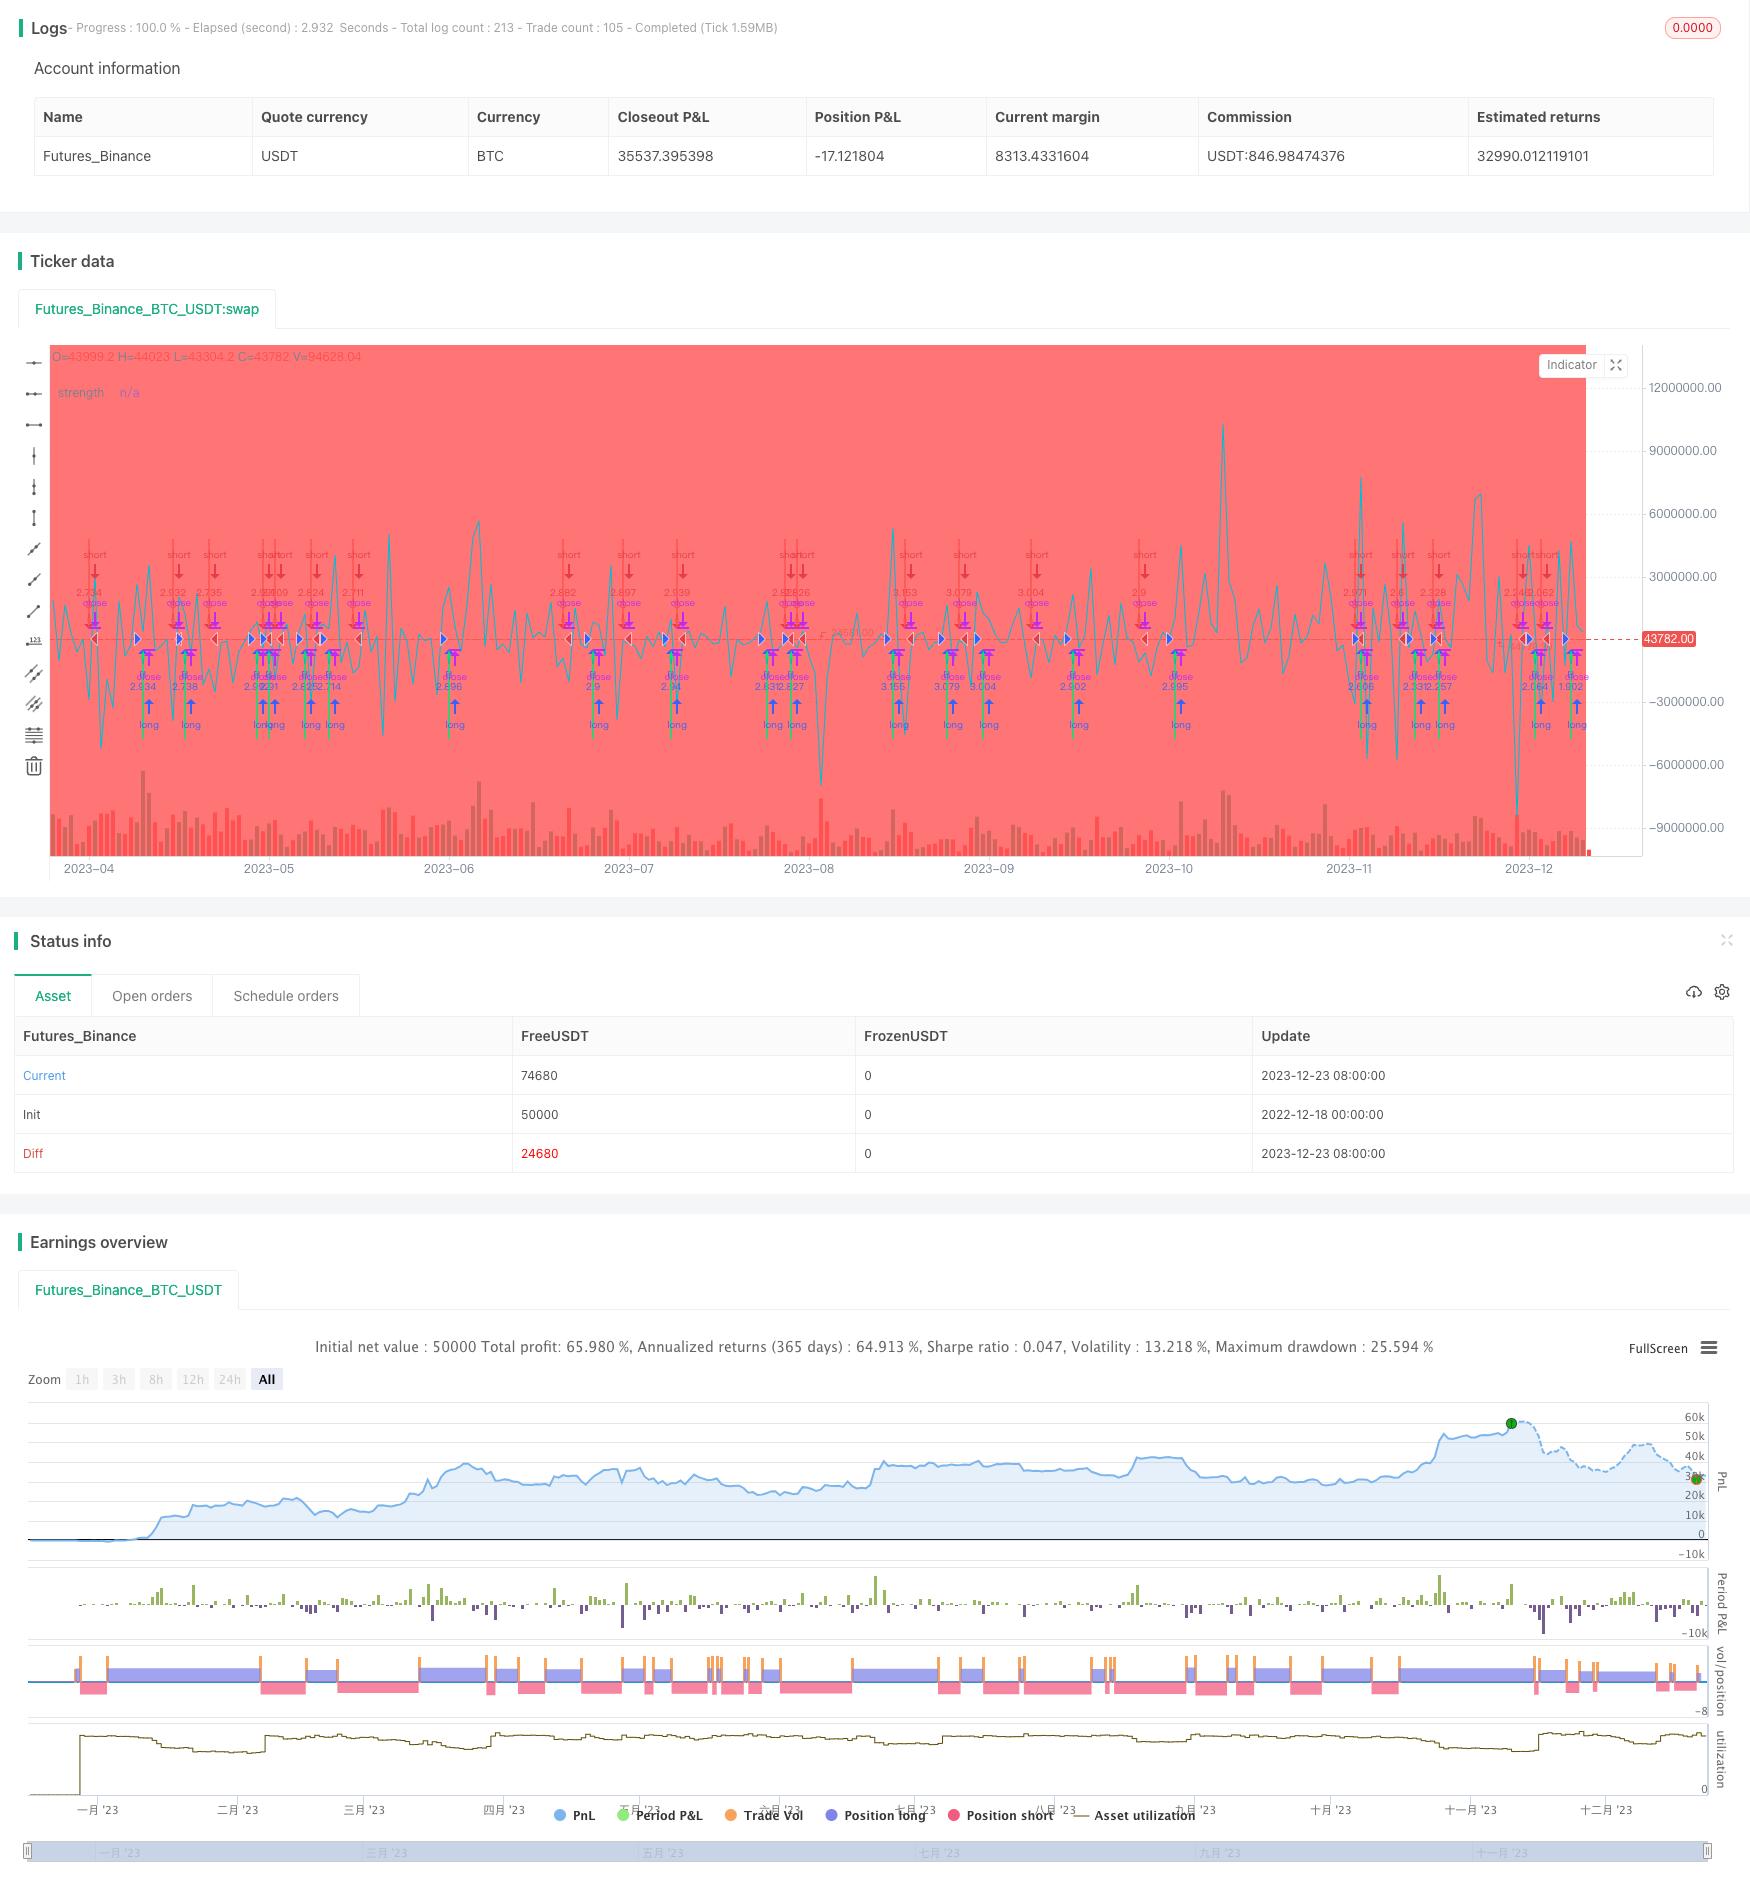
/*backtest
start: 2022-12-18 00:00:00
end: 2023-12-24 00:00:00
period: 1d
basePeriod: 1h
exchanges: [{"eid":"Futures_Binance","currency":"BTC_USDT"}]
*/

// This source code is subject to the terms of the Mozilla Public License 2.0 at https://mozilla.org/MPL/2.0/
// © russtic

//@version=2

strategy("HA smoothed eliminator v2  ",pyramiding=1, slippage=10, default_qty_type=strategy.percent_of_equity,
     commission_type=strategy.commission.percent, commission_value=0.075, overlay=true,
     default_qty_value=100, initial_capital=1000)

FromMonth1 = input(defval=1, title="From Month", minval=1, maxval=12)
FromDay1 = input(defval=1, title="From Day", minval=1, maxval=31)
FromYear1 = input(defval=2019, title="From Year", minval=2010)
ToMonth1 = input(defval=12, title="To Month", minval=1, maxval=12)
ToDay1 = input(defval=31, title="To Day", minval=1, maxval=31)
ToYear1 = input(defval=2020, title="To Year", minval=2010)
start1 = timestamp(FromYear1, FromMonth1, FromDay1, 00, 00)
finish1 = timestamp(ToYear1, ToMonth1, ToDay1, 23, 59)
window1() => true

t1 = time(timeframe.period, "0300-1200")
t2 = time(timeframe.period, "0930-1700")
London = na(t1) ? na : green
NY = na(t2) ? na : red

bgcolor(London, title="London")
bgcolor(NY, title="New York")
///////////////////////////
// HA smoothed

len=(1 )
o=ema(open,len)
c=ema(close,len)
h=ema(high,len)
l=ema(low,len)

haclose = (o+h+l+c)/4
haopen = na(haopen[1]) ? (o + c)/2 : (haopen[1] + haclose[1]) / 2
hahigh = max (h, max(haopen,haclose))
halow = min (l, min(haopen,haclose))

len2=(len)
o2=ema(haopen, len2)
c2=ema(haclose, len2)
h2=ema(hahigh, len2)
l2=ema(halow, len2)

buy= (o2<c2)

closebuy= (o2>c2)

sell= (o2>c2)

closesell= (o2<c2)

//
/// END NEW SCRIPT

//
//
//                  MERGE SCRIPTS
a1= o2<c2
b1=o2>c2
is_uptrend = (a1)// and (p> 0)
is_downtrend =  (b1)// and (p <0)
barcolor(b1 ? red: a1 ? lime : blue)

//end


// =========================start     PVT -GIVES EACH BAR A VALUE
facton = (true)//, title="arrow elimination (factor) on ")
Length1 = 2//input(2, title="PVT Length", minval=1)

xPrice = close//input(title="Source", type=source, defval=close)
xsma = wma(xPrice, Length1)
nRes = xPrice - xsma
pos = iff(nRes > 0, 1,
	     iff(nRes < 0, -1, nz(pos[1], 0)))
forex= input(true, title = 'strength toggle ')
forexyes = (forex == true)? 10000 : (forex == false)? 1: na

plot(nRes*forexyes , color=aqua, title="strength", transp=100)
// =========================         end pvt
//
//=============================     start factor // ELIMINATES  weak signals
//                  start trend
//
factor = input(600.00, title = "strength elimination")
factor1 = factor - (factor*2)//input(-100.00, title = "sell strength elimination ")
facton1 = (facton == true) and is_uptrend == 1 and nRes*forexyes>factor ? 1 : (facton == true) and is_downtrend == 1 and nRes*forexyes<factor1 ? -1 : (facton == false)
// ==================== =====
//
//===========================    end factor
nRestrend = (nRes*forexyes)
//=========================== plot arrows
plot1 = iff(is_uptrend[1] == 1, 0 , 1)
plot2 = iff(is_downtrend[1]  == 1, 0 , 1)
uparrowcond =  is_downtrend ? false : nz(uparrowcond[1], false) == true ? uparrowcond[1] : (facton1 and is_uptrend and nRes*forexyes>factor)
downarrowcond =  is_uptrend ? false : nz(downarrowcond[1], false) == true ? downarrowcond[1] : (facton1 and is_downtrend and nRes*forexyes<factor1)
//prevarrowstate = uparrowcond  ? 1 : downarrowcond ? -1 : nz(prevarrowstate[1], 0)


candledir = (open < close)? 1: (open>close)? -1 : na // ONLY OPENS ON SAME BAR DIRECTION AS SIGNAL


up=nz(uparrowcond[1], false) == false and ( is_uptrend and nRes*forexyes>factor) and candledir ? 1:na
dn=nz(downarrowcond[1], false) == false and ( is_downtrend and nRes*forexyes<factor1) and candledir? -1:na


sig=0
if up==1
    sig:=1
else
    if dn==-1
        sig:=-1
    else
        sig:=sig[1]
plotarrow(sig[1]!=1 and sig==1?1:na, title="BUY ARROW", colorup=lime, maxheight=80, minheight=50, transp=0)// up arrow
plotarrow(sig[1]!=-1 and sig==-1?-1:na, title="SELL ARROW", colordown=red, maxheight=80, minheight=50, transp=0)// down arrow

//========================= alert condition
alertcondition(sig[1]!=1 and sig==1?1:na, title="BUY eliminator", message="BUY " )
alertcondition(sig[1]!=-1 and sig==-1?-1:na, title="SELL eliminator",  message="SELL ")


strategy.entry("B", true, when=(sig[1]!=1 and sig==1?1:na) and window1())
strategy.entry("S", false,when=(sig[1]!=-1 and sig==-1?-1:na) and window1())