
4
Follow
1
Followers
Я не знаю, что это такое.
-
Я попробовал создать два объекта chart, каждый из которых добавляет данные, а затем добавляет их в свой собственный график.
Это не работает, это показывается на графике. -
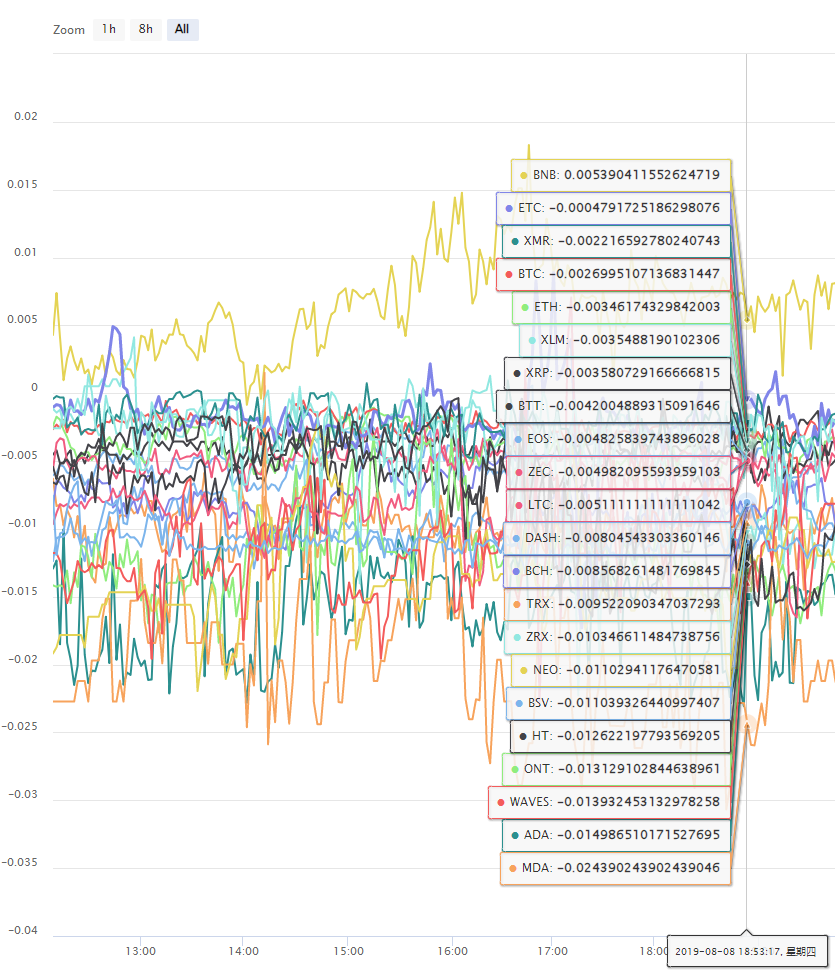
Если в таблице показано много кривых, которые не видны (см. рисунок ниже), можно ли сделать выборочный переключатель для каждой из кривых?
Спасибо.
Related Recommendations
Get Started with FMZ Quant PlatformSECURITY BUGI keep getting error: Exchange_GetAccount: Invalid ContractTypeWe have an incredibly profitable market making algorithm for sideways markets on Bitmex - but need expert to help eliminate wait times during downward volatility in the marketError with deribitLimitations of the backtesting engineHow to install ta-lib on linux docker?5.5 Trading strategy optimization5.4 Why do we need an off-sample test5.3 How to read the strategy backtest performance report
Comment
All comments (3)

可以显示两个图表,在策略广场有范例:
https://www.fmz.com/strategy/136056
https://www.fmz.com/strategy/38203
7 years ago
- 1