Отрегулируйте стратегию снижения и покупки


Дата создания: 2023-10-24 14:14:00 Последнее изменение: 2023-10-24 14:14:00
Копировать: 0 Количество просмотров: 735
1
Подписаться
1617
Подписчики

Отрегулируйте стратегию снижения и покупки

Обзор

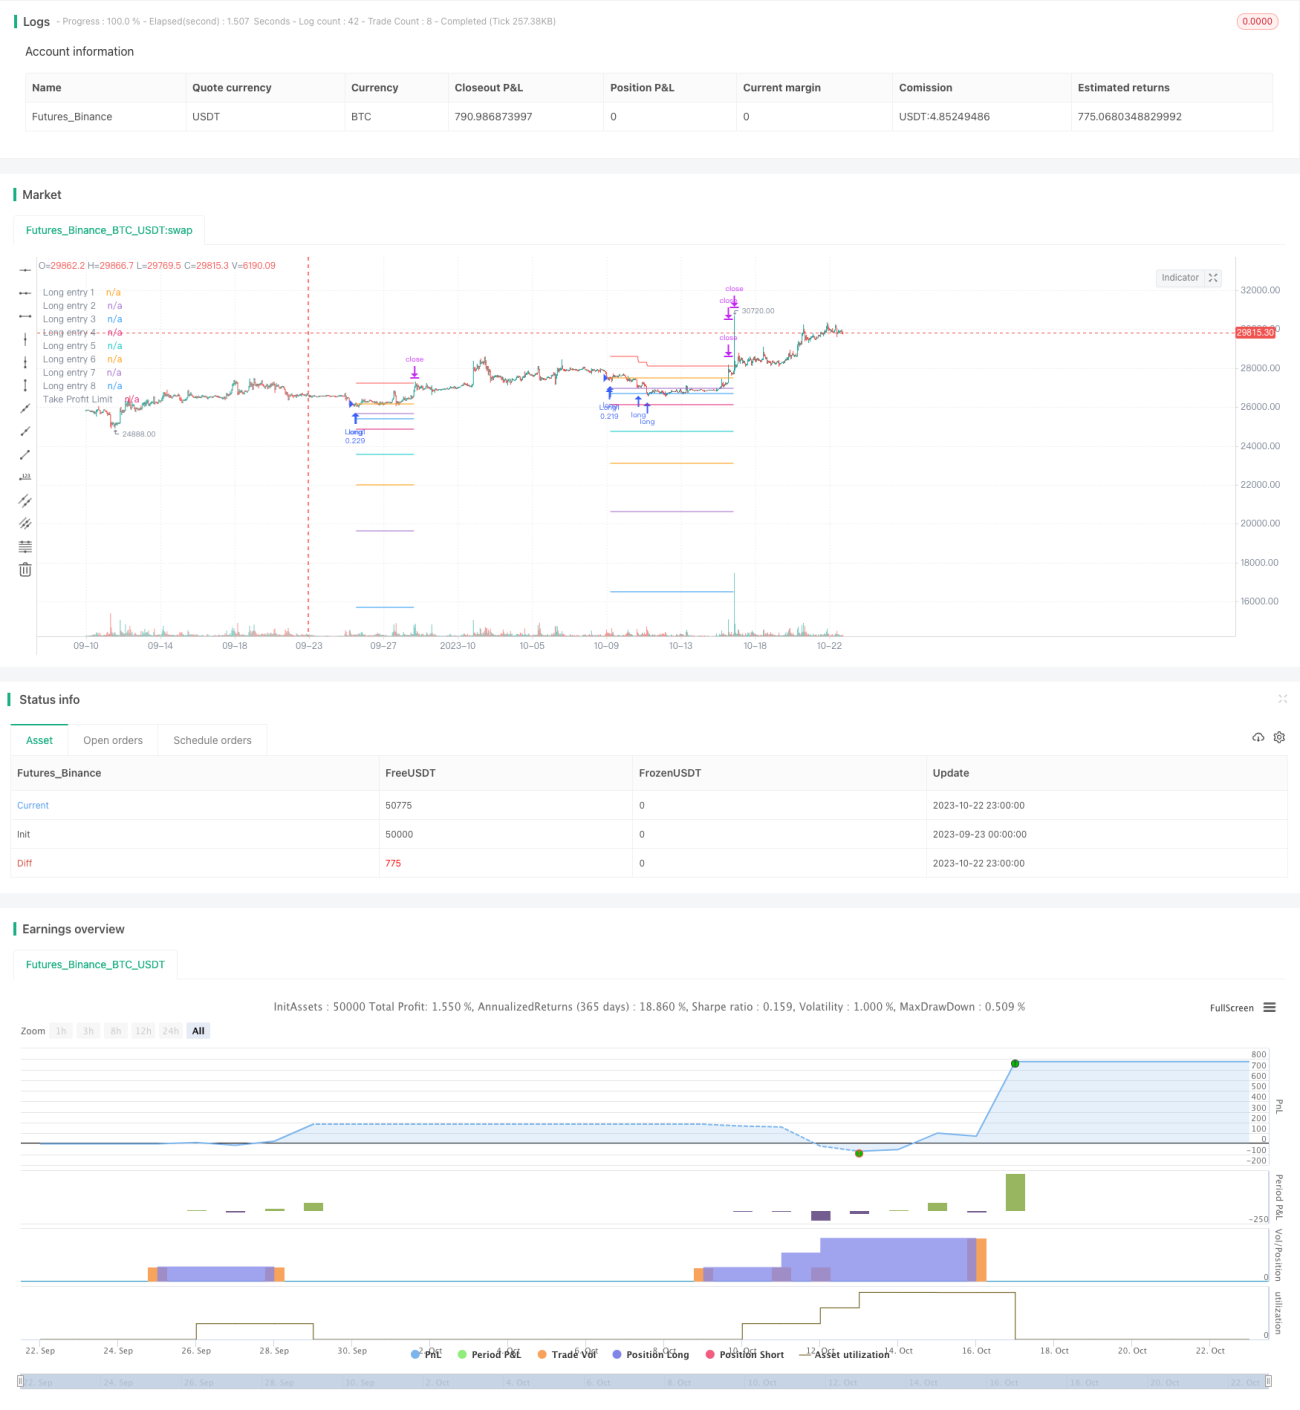
Стратегия использует RSI в сочетании с ценовым выравниванием, чтобы искать возможности перепродажи и делать больше позиций, когда цена акций опускается ниже средней. По мере дальнейшего падения цены акций стратегия будет постепенно наращивать позиции по заданному проценту, чтобы достичь средней стоимости хранения позиции.

Стратегический принцип

  1. Когда RSI ниже линии пробыли 29 и цена закрытия ниже средней линии, сделайте более открытый первый ордер.

  2. При первом падении цены на акции до 2%, при третьем падении до 3%, и так далее, до 8 падений. Это обеспечивает эффект создания запасов по партиям.

  3. Каждый раз, когда открывается позиция, записывается цена открытия. Эти ценовые точки являются эталонными ценами для входа. И эти ценовые линии начерчиваются на графике.

  4. После открытия позиции рассчитывается средняя цена за позицию. С 3% от средней цены в качестве цены остановки для каждой позиции и 4% в качестве цены остановки для всей позиции.

  5. Когда цена выросла больше, чем стоп-цена определенной позиции, выбирается ликвидация этой позиции.

  6. Прогрессирующий стоп: каждый раз, когда устраняется позиция, прибыль, полученная от этой позиции, вычитается из общей цены стоп. Таким образом, стоп-линия может медленно двигаться вниз, и она будет полностью остановлена только тогда, когда прибыль всех позиций будет достаточной, чтобы компенсировать максимальные потери.

  7. Когда цена вызывает постепенную остановку, выберите полную ликвидацию.

Анализ преимуществ

  1. Индекс RSI позволяет более точно определить перепроданные зоны, что помогает использовать возможности для обратного отсчета.

  2. В случае, если в течение года в течение одного месяца в течение одного месяца в течение одного месяца в течение одного месяца в течение одного месяца в течение одного месяца в течение одного месяца в течение одного месяца в течение одного месяца в течение одного месяца.

  3. Постепенная остановка может снизить риск потерь и обеспечить постепенный выход. Даже если возникнут убытки, они могут быть контролированы до определенного уровня.

  4. Конфигурируемые коэффициенты стоп-аппажа и коэффициенты пополнения, которые могут быть скорректированы в зависимости от рыночного риска стратегии.

  5. На графике изображены линии отсчета открытия позиции и линии остановки, что позволяет интуитивно оценить распределение позиций.

Анализ рисков

  1. В шокирующих ситуациях, возможно, несколько раз запускать позиции и останавливаться, торговля часто приводит к потере скольжения. Можно соответствующим образом ослабить параметры RSI, уменьшить количество торгов.

  2. Неправильная установка количества и пропорций депозитов может привести к чрезмерной торговле, и их следует тщательно распределять в зависимости от состояния средств.

  3. Если рынок продолжит снижаться, то риски могут быть бездонными. Следует предусматривать максимальный лимит на количество пополнений, и последний уровень пополнения должен быть консервативным.

  4. Недостаточное количество остановок может привести к преждевременному остановке. Соответствующее количество остановок должно быть установлено на основе исторических данных.

Направление оптимизации

  1. Можно ввести MACD и другие индикаторы для фильтрации сигналов RSI, чтобы уменьшить недействительные сделки.

  2. Стойки могут быть установлены в соответствии с ATR, чтобы избежать больших потерь в экстремальных ситуациях.

  3. Можно оптимизировать параметры, такие как количество пополнений, соотношение, соотношение остановки, чтобы стратегия была более адаптирована к различным видам.

  4. Степень остановки может быть разумно скорректирована в зависимости от колебаний, а при больших колебаниях - соответствующим образом ослаблена.

Подвести итог

Эта стратегия использует RSI, чтобы определить перепроданные зоны, чтобы совершить обратную торговлю в соответствии с ценовой равновесием. В то же время используется интеллектуальный механизм наращивания и постепенного остановки, чтобы обеспечить высокоэффективную многостратегию при условии контроля риска.

Исходный код стратегии
/*backtest
start: 2023-09-23 00:00:00
end: 2023-10-23 00:00:00
period: 1h
basePeriod: 15m
exchanges: [{"eid":"Futures_Binance","currency":"BTC_USDT"}]
*/

// This source code is subject to the terms of the Mozilla Public License 2.0 at https://mozilla.org/MPL/2.0/
//@version=5
// © A3Sh

// RSI Strategy that buys the dips, uses Price Averaging and Pyramiding.
// When the price drops below specified percentages of the price (8 PA layers), new entries are openend to average the price of the assets.
// Open entries are closed by a specified take profit.
// Entries can be reopened, after closing and consequently crossing a PA layer again.
// This strategy is based on the RSI+PA+DCA strategy I created earlier. The difference is the way the Take Profit is calculated.
// Instead of directly connecting the take profit limit to the decreasing average price level with an X percent above the average price, 
// the take profit is calculated for a part on the decreasing average price and for another part on the deduction 
// of the profits of the individual closed positions.
// The Take Profit Limit drop less significant then the average price level and the full position only completely exits 
// when enough individual closed positions made up for the losses.
// This makes it less risky and more conservative and great for a long term trading strategy
// RSI code is adapted from the build in Relative Strength Index indicator
// MA Filter and RSI concept adapted from the Optimized RSI Buy the Dips strategy, by Coinrule
// https://www.tradingview.com/script/Pm1WAtyI-Optimized-RSI-Strategy-Buy-The-Dips-by-Coinrule/
// Pyramiding entries code adapted from Pyramiding Entries on Early Trends startegy, by Coinrule
// https://www.tradingview.com/script/7NNJ0sXB-Pyramiding-Entries-On-Early-Trends-by-Coinrule/
// Plot entry layers code adapted from HOWTO Plot Entry Price by vitvlkv
// https://www.tradingview.com/script/bHTnipgY-HOWTO-Plot-Entry-Price/


strategy(title='RSI+PA+PTP', pyramiding=16, overlay=true, initial_capital=400, default_qty_type=strategy.percent_of_equity, default_qty_value=15, commission_type=strategy.commission.percent, commission_value=0.075, close_entries_rule='FIFO')

port = input.float(12, group = "Risk", title='Portfolio % Used To Open The 8 Positions', step=0.1, minval=0.1, maxval=100)
q    = strategy.equity / 100 * port / open


// Long position PA entry layers. Percentage from the entry price of the the first long
ps2 = input.float(2,  group = "Long Position Entry Layers", title='2nd Long Entry %', step=0.1)
ps3 = input.float(3,  group = "Long Position Entry Layers", title='3rd Long Entry %', step=0.1)
ps4 = input.float(5,  group = "Long Position Entry Layers", title='4th Long Entry %', step=0.1)
ps5 = input.float(10, group = "Long Position Entry Layers", title='5th Long Entry %', step=0.1)
ps6 = input.float(16, group = "Long Position Entry Layers", title='6th Long Entry %', step=0.1)
ps7 = input.float(25, group = "Long Position Entry Layers" ,title='7th Long Entry %', step=0.1)
ps8 = input.float(40, group = "Long Position Entry Layers", title='8th Long Entry %', step=0.1)


// Calculate Moving Averages
plotMA               = input.bool(group = "Moving Average Filter", title='Plot Moving Average', defval=false)
movingaverage_signal = ta.sma(close, input(100, group = "Moving Average Filter", title='MA Length'))

plot (plotMA ? movingaverage_signal : na, color = color.new (color.green, 0))


// RSI inputs and calculations
rsiLengthInput = input.int(14, minval=1, title="RSI Length", group="RSI Settings")
rsiSourceInput = input.source(close, "Source", group="RSI Settings")

up   = ta.rma(math.max(ta.change(rsiSourceInput), 0), rsiLengthInput)
down = ta.rma(-math.min(ta.change(rsiSourceInput), 0), rsiLengthInput)
rsi  = down == 0 ? 100 : up == 0 ? 0 : 100 - (100 / (1 + up / down))

overSold = input.int(29, title="Oversold, Trigger to Enter First Position", group = "RSI Settings")

// Long trigger (co)
co = ta.crossover(rsi, overSold) and close < movingaverage_signal


// Store values to create and plot the different PA layers
long1 = ta.valuewhen(co, close, 0)
long2 = ta.valuewhen(co, close - close / 100 * ps2, 0)
long3 = ta.valuewhen(co, close - close / 100 * ps3, 0)
long4 = ta.valuewhen(co, close - close / 100 * ps4, 0)
long5 = ta.valuewhen(co, close - close / 100 * ps5, 0)
long6 = ta.valuewhen(co, close - close / 100 * ps6, 0)
long7 = ta.valuewhen(co, close - close / 100 * ps7, 0)
long8 = ta.valuewhen(co, close - close / 100 * ps8, 0)

eps1 = 0.00
eps1 := na(eps1[1]) ? na : eps1[1]

eps2 = 0.00
eps2 := na(eps2[1]) ? na : eps2[1]

eps3 = 0.00
eps3 := na(eps3[1]) ? na : eps3[1]

eps4 = 0.00
eps4 := na(eps4[1]) ? na : eps4[1]

eps5 = 0.00
eps5 := na(eps5[1]) ? na : eps5[1]

eps6 = 0.00
eps6 := na(eps6[1]) ? na : eps6[1]

eps7 = 0.00
eps7 := na(eps7[1]) ? na : eps7[1]

eps8 = 0.00
eps8 := na(eps8[1]) ? na : eps8[1]

plot(strategy.position_size > 0 ? eps1 : na, title='Long entry 1', style=plot.style_linebr)
plot(strategy.position_size > 0 ? eps2 : na, title='Long entry 2', style=plot.style_linebr)
plot(strategy.position_size > 0 ? eps3 : na, title='Long entry 3', style=plot.style_linebr)
plot(strategy.position_size > 0 ? eps4 : na, title='Long entry 4', style=plot.style_linebr)
plot(strategy.position_size > 0 ? eps5 : na, title='Long entry 5', style=plot.style_linebr)
plot(strategy.position_size > 0 ? eps6 : na, title='Long entry 6', style=plot.style_linebr)
plot(strategy.position_size > 0 ? eps7 : na, title='Long entry 7', style=plot.style_linebr)
plot(strategy.position_size > 0 ? eps8 : na, title='Long entry 8', style=plot.style_linebr)


// Take Profit Settings
ProfitTarget_Percent     = input.float(3.0,   group = "Take Profit Settings", title='Take Profit % (Per Position)')
ProfitTarget_Percent_All = input.float(4.0,   group = "Take Profit Settings", title='Take Profit % (Exit All, Progressive Take Profit Limit')
TakeProfitProgression    = input.float(12,    group = "Take Profit Settings", title='Take Profit Progression', tooltip = 'Progression is defined by the position size. By default 12% of the start equity (portfolio) is used to open a position, see Risk. This same % percentage is used to calculate the profit amount that will be deducted from the Take Profit Limit.')
entryOn                  = input.bool (true,  group = "Take Profit Settings", title='New entries affect Take Profit limit', tooltip = 'This option changes the behaviour of the Progressive Take Profit. When switchted on, the difference between the former and current original Take Profit is deducted from the Progressive Take Profit. When switchted off, the Progressive Take Profit is only affected by the profit deduction or each closed position.')
avPricePlot              = input.bool (false, group = "Take Profit Settings", title='Plot Average Price (FIFO)')
// Original Take Profit Limit
tpLimit                  = strategy.position_avg_price + (strategy.position_avg_price / 100 * ProfitTarget_Percent_All) 


// Create variables to calculate the Take Profit Limit Progresssion
var endVal   = 0.0   
var startVal = 0.0

// The value at the the start of the loop is the value of the end of the previous loop
startVal := endVal 

// Set variable to the original Take Profit Limit when the first position opens.
if strategy.position_size > 0 and strategy.position_size[1] ==0
    endVal := tpLimit  

// Everytime a specific position opens, the difference of the previous (original) Take Profit price and the current (original) Take Profit price will be deducted from the Progressive Take Profit Limit
// This feature can be toggled on and off in the settings panel. By default it is toggled on.
entryAmount = 0.0
for i = 1 to strategy.opentrades
    entryAmount := i
    if entryOn  and strategy.position_size > 0 and strategy.opentrades[1] == (entryAmount) and strategy.opentrades == (entryAmount + 1)
        endVal := startVal - (tpLimit[1] - tpLimit)

// Everytime a specific position closes, the amount of profit from that specific position will be deducted from the Progressive Take Profit Limit.
exitAmount = 0.0
for id = 1 to strategy.opentrades
    exitAmount := id
    if strategy.opentrades[1] ==(exitAmount + 1) and strategy.opentrades == (exitAmount)
        endVal := startVal - (TakeProfitProgression / 100 * strategy.opentrades.entry_price (id - 1) / 100 * ProfitTarget_Percent )

// The Final Take Profit Price
tpn = (strategy.position_avg_price + (strategy.position_avg_price / 100 * ProfitTarget_Percent_All))  - (strategy.position_avg_price + (strategy.position_avg_price / 100 * ProfitTarget_Percent_All) - endVal)
plot  (strategy.position_size > 0 ? tpn : na, title = "Take Profit Limit", color=color.new(color.red, 0), style = plot.style_linebr, linewidth = 1) 

// Plot position average price as reference
plot  (avPricePlot ? strategy.position_avg_price : na, title= "Average price", color = color.new(color.white, 0), style = plot.style_linebr, linewidth = 1) 


// When to trigger the Take Profit per position or the Progressive Take Profit
tpl1 = close < tpn ? eps1 + close * (ProfitTarget_Percent / 100) : tpn
tpl2 = close < tpn ? eps2 + close * (ProfitTarget_Percent / 100) : tpn
tpl3 = close < tpn ? eps3 + close * (ProfitTarget_Percent / 100) : tpn
tpl4 = close < tpn ? eps4 + close * (ProfitTarget_Percent / 100) : tpn
tpl5 = close < tpn ? eps5 + close * (ProfitTarget_Percent / 100) : tpn
tpl6 = close < tpn ? eps6 + close * (ProfitTarget_Percent / 100) : tpn
tpl7 = close < tpn ? eps7 + close * (ProfitTarget_Percent / 100) : tpn
tpl8 = close < tpn ? eps8 + close * (ProfitTarget_Percent / 100) : tpn


// Submit Entry Orders
if co and strategy.opentrades == 0
    eps1 := long1
    eps2 := long2
    eps3 := long3
    eps4 := long4
    eps5 := long5
    eps6 := long6
    eps7 := long7
    eps8 := long8

    strategy.entry('Long1', strategy.long, q)

if strategy.opentrades == 1
    strategy.entry('Long2', strategy.long, q, limit=eps2)

if strategy.opentrades == 2
    strategy.entry('Long3', strategy.long, q, limit=eps3)

if strategy.opentrades == 3
    strategy.entry('Long4', strategy.long, q, limit=eps4)

if strategy.opentrades == 4
    strategy.entry('Long5', strategy.long, q, limit=eps5)

if strategy.opentrades == 5
    strategy.entry('Long6', strategy.long, q, limit=eps6)

if strategy.opentrades == 6
    strategy.entry('Long7', strategy.long, q, limit=eps7)

if strategy.opentrades == 7
    strategy.entry('Long8', strategy.long, q, limit=eps8)


// Submit Exit orders
if strategy.position_size > 0
    strategy.exit(id='Exit 1', from_entry='Long1', limit=tpl1)
    strategy.exit(id='Exit 2', from_entry='Long2', limit=tpl2)
    strategy.exit(id='Exit 3', from_entry='Long3', limit=tpl3)
    strategy.exit(id='Exit 4', from_entry='Long4', limit=tpl4)
    strategy.exit(id='Exit 5', from_entry='Long5', limit=tpl5)
    strategy.exit(id='Exit 6', from_entry='Long6', limit=tpl6)
    strategy.exit(id='Exit 7', from_entry='Long7', limit=tpl7)
    strategy.exit(id='Exit 8', from_entry='Long8', limit=tpl8)


// Make sure that all open limit orders are canceled after exiting all the positions 
longClose = strategy.position_size[1] > 0 and strategy.position_size == 0 ? 1 : 0
if longClose
    strategy.cancel_all()