Стратегия торговли тройной скользящей средней

Обзор
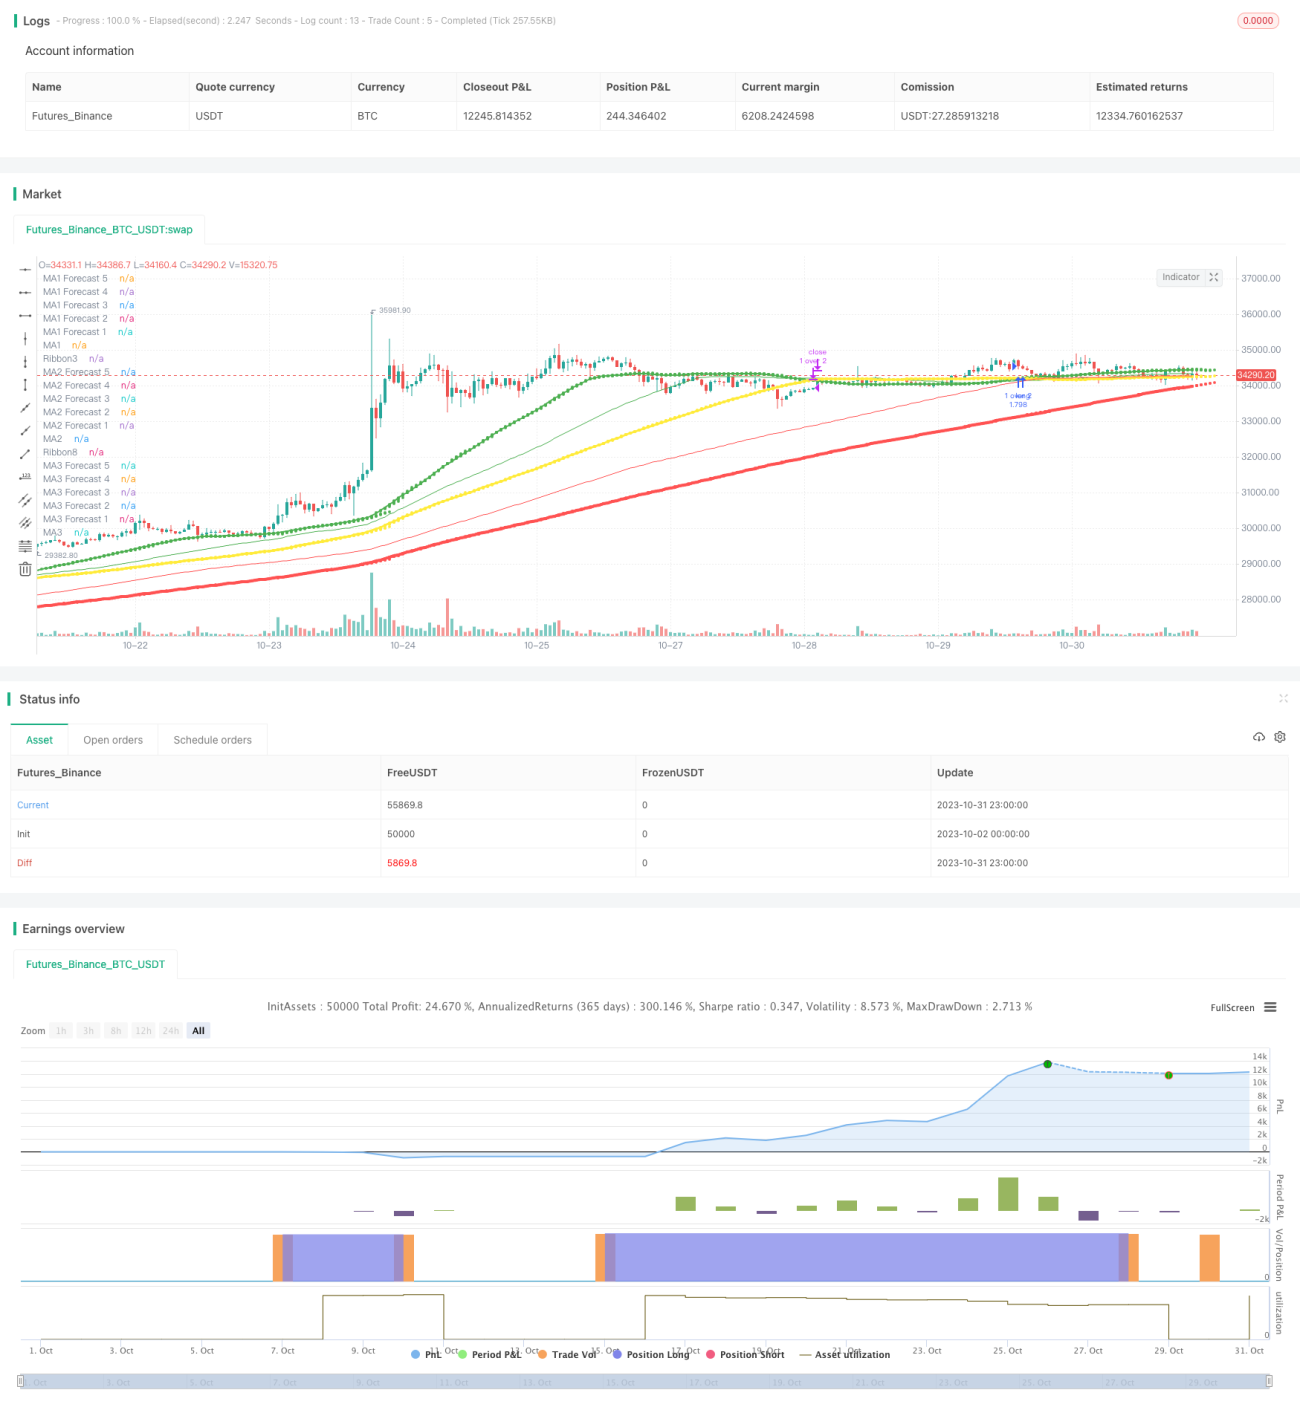
Эта стратегия является стратегией торговли, основанной на трёх движущихся средних. Она одновременно использует три движущихся средних разных периодов для принятия многорыночных решений, и является типичной стратегией, которая следует за тенденцией.
Стратегический принцип
-
Эта стратегия использует 3 движущихся средних: MA1, MA2 и MA3, 3 движущихся средних цикла устанавливаются пользователем, обычно настройка MA1 < MA2 < MA3, например, MA1 - 50 циклов, MA2 - 100 циклов, MA3 - 200 циклов.
-
Стратегия использует MA1 в качестве основной линии отсчета для принятия торговых решений. Когда короткий период MA1 проходит через длинный период MA2 или MA3, делайте больше; когда MA1 проходит через MA2 или MA3, делайте пустоту.
-
Стратегия может выбирать, чтобы торговать только на MA1 и MA2, или только на MA1 и MA3, или торговать на обоих.
-
При появлении перекрестного сигнала, используйте рыночную цену, чтобы открыть позицию. Стоп-стоп может быть установлен на определенный процент, например, 30% стоп-стоп, 15% стоп-стоп.
-
Для оптимизации стратегии можно изменить циклические параметры MA-линий, изменить процент стоп-стоп-лосс, добавить другие индикаторы фильтрации сигналов и т. д.
Анализ преимуществ
-
Использование множественных скользящих средних для принятия решений позволяет эффективно отфильтровывать ложные прорывы.
-
Используя комбинацию различных циклических МА, можно динамически корректировать позиции в тренде, реализуя тенденционное слежение.
-
Гибкость выбора: торговать только на "Golden Cross" или "Death Cross" или и то, и другое.
-
Стоп-лошади эффективно контролируют одиночные потери.
Анализ рисков
-
В этом случае, как отмечается в статье, "последнее, что нужно сделать, - это придерживаться тенденциозной стратегии, которая может привести к убыткам во время шока".
-
Неправильная установка цикла MA может привести к частым сделкам и снижению выигрышной способности.
-
После неудачного прорыва, если не остановить потери вовремя, это может привести к большим потерям.
-
Если стоп-стоп будет слишком мягким, то убыток может быть слишком большим.
Направление оптимизации
-
Оптимизируйте параметры MA, чтобы найти оптимальную комбинацию параметров.
-
Добавить другие показатели для фильтрации, оптимизировать время входа. Например, MACD, KDJ и т. Д.
-
Оптимизация стоп-стоп-лосс, чтобы оптимизировать стратегию прибыли и риска.
-
Повышение управления позициями, например, открытие позиций с фиксированным количеством или управление капиталом.
-
Повышение скольжения стоп-линий и оптимизация стоп-стратегии для прорыва.
Подвести итог
Эта стратегия в целом является типичной стратегией отслеживания тенденций, которая, судя по перекрестному пересечению нескольких групп МА, относится к относительно стабильной стратегии отслеживания тенденций. Ее можно дополнительно улучшить с помощью методов оптимизации параметров, фильтрации показателей, управления позицией и т. Д. Но основная идея проста и ясна, подходит для обучения и практики новичков.
- 1