Стратегия супертренда, поглощающего бомбу

Обзор
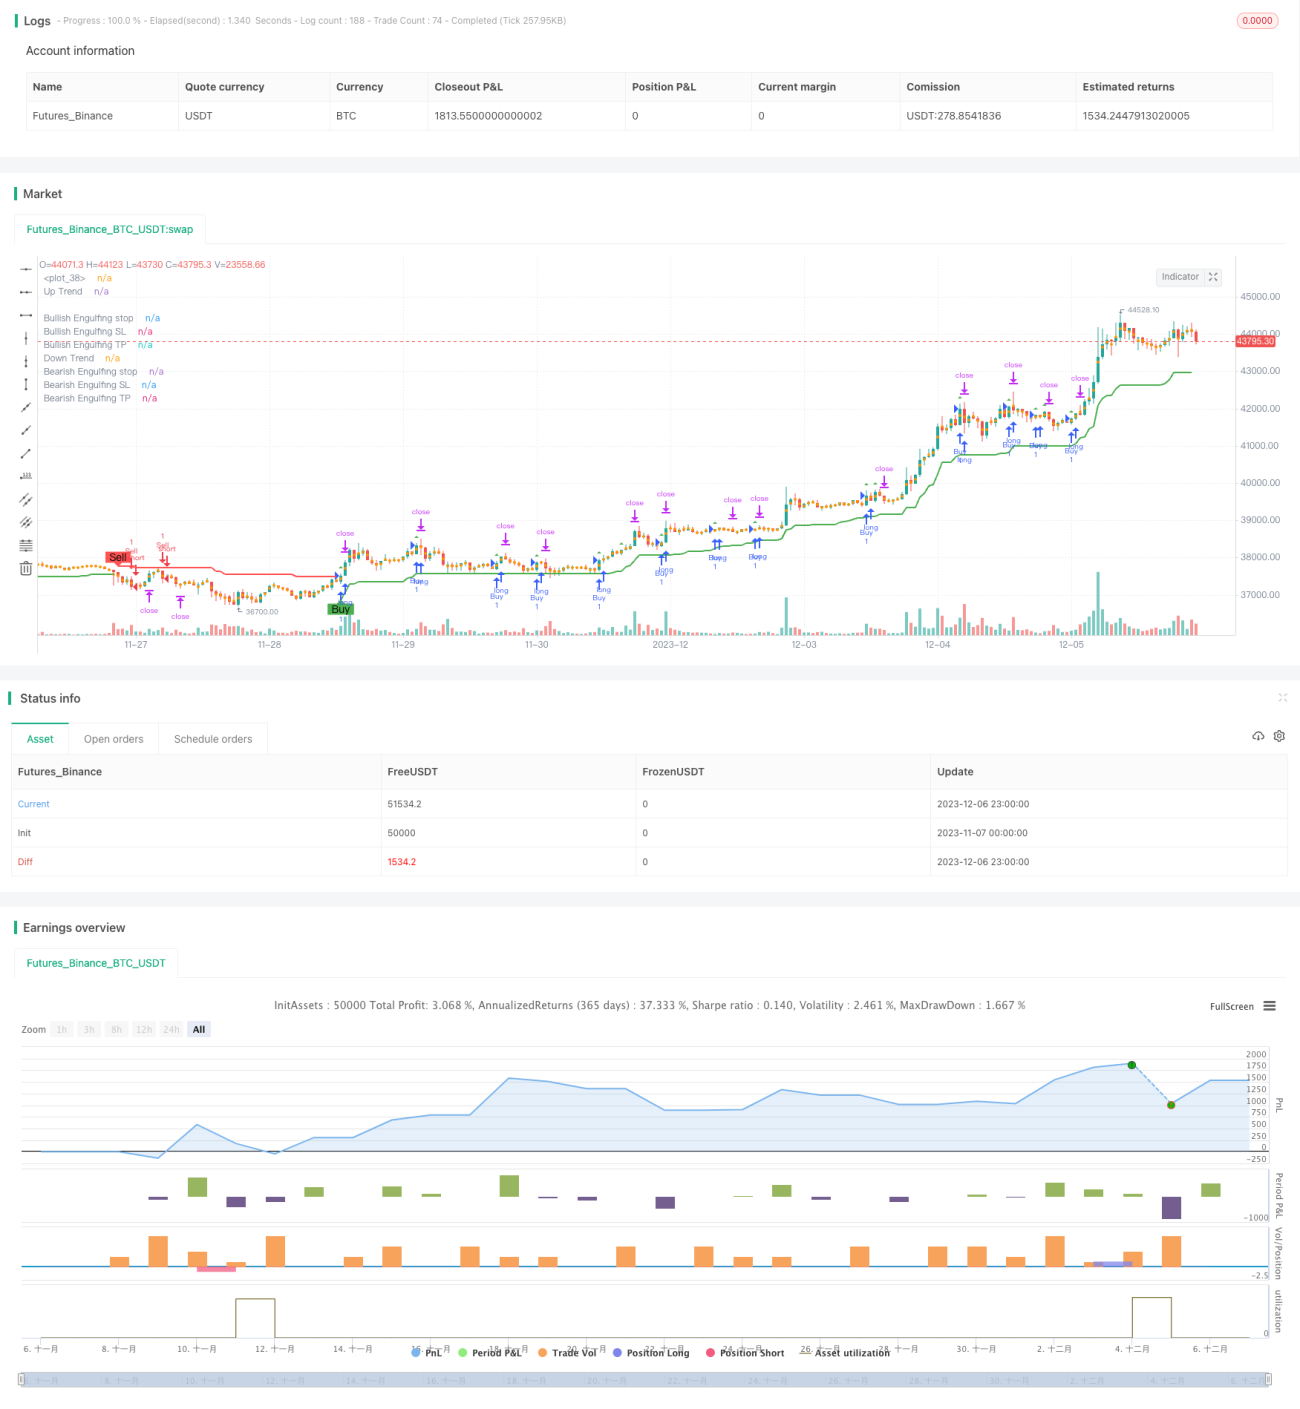
Стратегия поглощения сверхтрендов является стратегией отслеживания трендов, которая сочетает в себе среднюю реальную волновую величину (ATR), индикатор сверхтрендов и поглощающую форму, чтобы идентифицировать направление тренда и искать входные возможности с выгодным коэффициентом, подтверждая тенденцию поглощающей формы.
Стратегический принцип
В первую очередь, стратегия использует ATR и сверхтенденциальные показатели для определения направления текущей рыночной тенденции. В частности, она определяется как нисходящая тенденция, когда цена ниже верхней линии, и как восходящая тенденция, когда цена выше нижней линии.
При подтверждении направления тренда, стратегия также будет судить о том, не формирует ли K-линии формы поглощения. Согласно логике кода, в восходящем тренде, в случае, если предыдущая K-линия закрывается выше текущей K-линии открытия цены, а текущая K-линия закрывается ниже открытия цены, будет вызван многоголовый поглощение; в нисходящем тренде, в случае, если предыдущая K-линия закрывается ниже текущей K-линии открытия цены, а текущая K-линия закрывается выше открытия цены, будет вызвано пустоголовое поглощение.
Торговый сигнал создается, когда поглощающая форма совпадает с направлением тренда. Кроме того, стратегия рассчитывает стоп-пост и стоп-стоп на основе поглощающей формы. После входа в рынок, если цена достигнет стоп-пост или стоп-стоп, то выходит из текущей позиции.
Анализ преимуществ
Эта стратегия объединяет преимущества отслеживания тенденций и распознавания форм, позволяя идентифицировать обратные сигналы в трендовых ситуациях, что позволяет поймать большую ситуацию в рыночных точках поворота. Кроме того, механизм стоп-лосса может эффективно контролировать риск потери.
Анализ рисков
Наибольший риск этой стратегии заключается в том, что формы поглощения могут быть ложными, что приводит к ошибочным сигналам. Кроме того, параметры остановок и остановок могут быть слишком произвольными, чтобы достичь равновесия прибыли и убытка. Рекомендуется оптимизировать комбинацию параметров и соответствующим образом регулировать положение остановок.
Направление оптимизации
Можно рассмотреть возможность оптимизации параметров ATR в реальном времени, чтобы лучше улавливать изменения волатильности рынка. Кроме того, можно изучить другие показатели, чтобы идентифицировать тенденции и далее повысить стабильность стратегии.
Подвести итог
Стратегия поглощения сверхтрендов, объединяющая преимущества отслеживания тенденций и идентификации форм, может быть более эффективной в рыночных точках переворота. Однако существует определенный риск ложного сигнала, который требует дальнейшего тестирования и оптимизации для контроля риска.
- 1