Стратегия «купи дорого и продай дешево», основанная на опорной линии золотого сечения
Обзор
Эта стратегия позволяет определять направление тренда, используя различные временные периоды как ключевые ценовые зоны, в сочетании с принципом золотой разделительной линии, и реализовывать стратегию торговли с высокой ценой покупки и низкой продажи.
Стратегический принцип
Расчет цены закрытия, максимумов и минимумов в различных периодах времени. Включает в себя классические цены и цены золота.
В зависимости от того, насколько цены взлетели и опустились, оценить текущую ценовую зону. Она делится на 5 покупательных и 5 продающих зон.
Сигналы о покупке в зоне покупки, сигналы о продаже в зоне продажи, стратегические стратегии покупки и продажи.
Анализ преимуществ
Используйте различные временные циклы, чтобы оценить тенденции и избежать рыночного шума.
Вместе с тем, в сочетании с классическими и золотыми разделениями, они повышают надежность.
По оценке ценовой зоны, следует определить время выхода на рынок, чтобы максимально избежать риска потерь.
Применение стратегии высокой покупки и низкой продажи, в соответствии с правилами трендового трейдинга, избегание контрастного трейдинга.
Анализ рисков
При прорыве опоры может произойти сбой.
Необходимо предотвратить неблагоприятные последствия отслеживания убытков, которые могут усугубить убытки.
Также на конечный доход влияют расходы на транзакцию.
Направление оптимизации
Можно тестировать различные параметры, такие как параметры временного цикла, параметры направления торговли и т.д., оптимизируя стратегию.
Для определения тенденции можно использовать другие показатели, чтобы избежать ложных прорывов.
Можно добавить механизм хранения убытков, чтобы контролировать одиночные убытки.
Подвести итог
Эта стратегия объединяет классические методы технического анализа и стратегию трендового трейдинга, используя базовые зоны для определения времени выхода на рынок, а также использует принцип высокой покупки и низкой продажи, чтобы эффективно контролировать торговые риски, которые заслуживают проверки и оптимизации на практике.
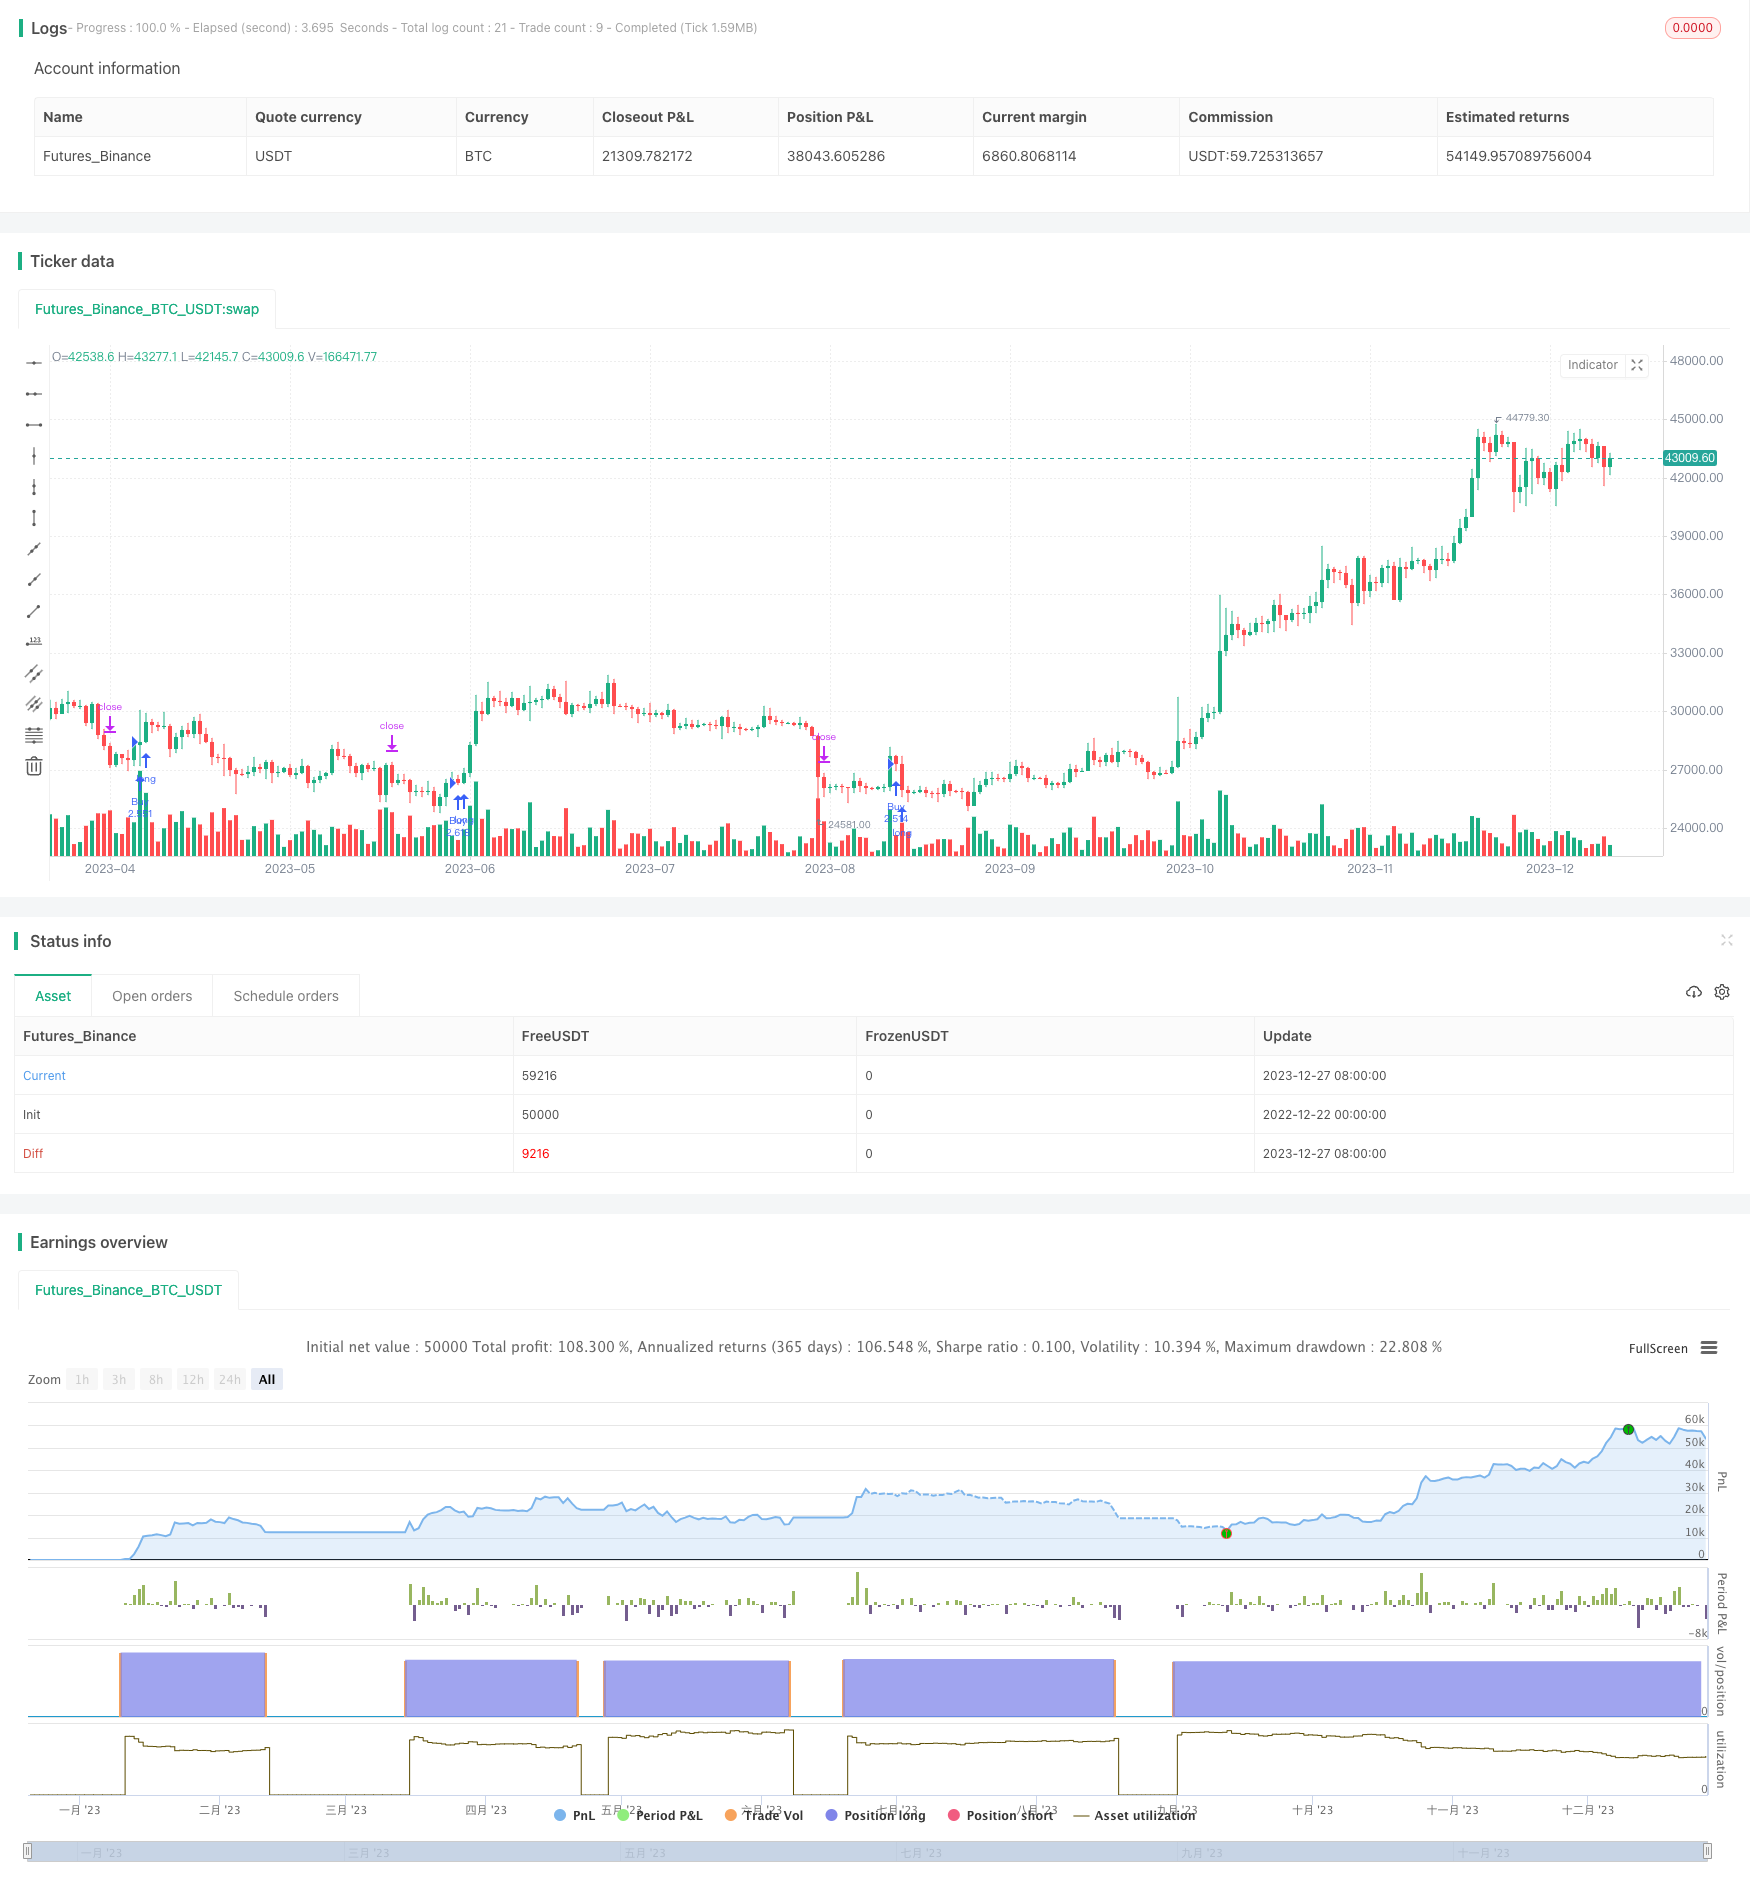
/*backtest
start: 2022-12-22 00:00:00
end: 2023-12-28 00:00:00
period: 1d
basePeriod: 1h
exchanges: [{"eid":"Futures_Binance","currency":"BTC_USDT"}]
*/

// This source code is subject to the terms of the Mozilla Public License 2.0 at https://mozilla.org/MPL/2.0/
// © HeWhoMustNotBeNamed

//@version=4
strategy("BuyHighSellLow - Pivot points", overlay=true, initial_capital = 100000, default_qty_type = strategy.percent_of_equity, default_qty_value = 100, commission_type = strategy.commission.percent, pyramiding = 1, commission_value = 0.01, calc_on_order_fills = true)
Source = input(close)
resolution = input("4D", type=input.resolution)
HTFMultiplier = input(4, title="Higher Timeframe multiplier (Used when resolution is set to Same as Symbol)", minval=2, step=1)
//ppType = input(title="Pivot points type", defval="classic", options=["classic", "fib"])
ppType = "fib"
tradeDirection = input(title="Trade Direction", defval=strategy.direction.long, options=[strategy.direction.all, strategy.direction.long, strategy.direction.short])
backtestBars = input(title="Backtest from ", defval=10, minval=1, maxval=30)
backtestFrom = input(title="Timeframe", defval="years", options=["days", "months", "years"])
hideBands = input(true)
f_multiple_resolution(HTFMultiplier) =>
    target_Res_In_Min = timeframe.multiplier * HTFMultiplier * (
      timeframe.isseconds   ? 1. / 60. :
      timeframe.isminutes   ? 1. :
      timeframe.isdaily     ? 1440. :
      timeframe.isweekly    ? 7. * 24. * 60. :
      timeframe.ismonthly   ? 30.417 * 24. * 60. : na)

    target_Res_In_Min     <= 0.0417       ? "1S"  :
      target_Res_In_Min   <= 0.167        ? "5S"  :
      target_Res_In_Min   <= 0.376        ? "15S" :
      target_Res_In_Min   <= 0.751        ? "30S" :
      target_Res_In_Min   <= 1440         ? tostring(round(target_Res_In_Min)) :
      tostring(round(min(target_Res_In_Min / 1440, 365))) + "D"

f_getBackTestTimeFrom(backtestFrom, backtestBars)=>
    byDate = backtestFrom == "days"
    byMonth = backtestFrom == "months"
    byYear = backtestFrom == "years"

    date = dayofmonth(timenow)
    mth = month(timenow)
    yr = year(timenow)

    leapYearDaysInMonth = array.new_int(12,0)
    array.set(leapYearDaysInMonth,0,31)
    array.set(leapYearDaysInMonth,1,29)
    nonleapYearDaysInMonth = array.new_int(12,0)
    array.set(leapYearDaysInMonth,0,31)
    array.set(leapYearDaysInMonth,1,28)

    restMonths = array.new_int(10,0)
    array.set(leapYearDaysInMonth,0,31)
    array.set(leapYearDaysInMonth,1,30)
    array.set(leapYearDaysInMonth,2,31)
    array.set(leapYearDaysInMonth,3,30)
    array.set(leapYearDaysInMonth,4,31)
    array.set(leapYearDaysInMonth,5,31)
    array.set(leapYearDaysInMonth,6,30)
    array.set(leapYearDaysInMonth,7,31)
    array.set(leapYearDaysInMonth,8,30)
    array.set(leapYearDaysInMonth,9,31)

    array.concat(leapYearDaysInMonth,restMonths)
    array.concat(nonleapYearDaysInMonth,restMonths)
    isLeapYear = yr % 4 == 0 and (year%100 != 0 or year%400 == 0)
    numberOfDaysInCurrentMonth = isLeapYear ? array.get(leapYearDaysInMonth, mth-2) : array.get(nonleapYearDaysInMonth, mth-2)
    if(byDate)
        mth := (date - backtestBars) < 0 ? mth - 1 : mth
        yr := mth < 1 ? yr - 1 : yr
        mth := mth < 1 ? 1 : mth
        date := (date - backtestBars) < 0 ? numberOfDaysInCurrentMonth - backtestBars + date + 1 : date - backtestBars + 1
    if(byMonth)
        date := 1
        yr := (mth - (backtestBars%12)) < 0 ? yr - int(backtestBars/12) - 1 : yr - int(backtestBars/12)
        mth := mth - (backtestBars%12) + 1
    if(byYear)
        date := 1
        mth := 1
        yr := yr - backtestBars
    [date, mth, yr]

f_secureSecurity(_symbol, _res, _src) => security(_symbol, _res, _src[1], lookahead = barmerge.lookahead_on)

f_getClassicPivots(HIGHprev, LOWprev, CLOSEprev)=>
    PP = (HIGHprev + LOWprev + CLOSEprev) / 3
    R1 = PP * 2 - LOWprev
    S1 = PP * 2 - HIGHprev
    R2 = PP + (HIGHprev - LOWprev)
    S2 = PP - (HIGHprev - LOWprev)
    R3 = PP * 2 + (HIGHprev - 2 * LOWprev)
    S3 = PP * 2 - (2 * HIGHprev - LOWprev)
    R4 = PP * 3 + (HIGHprev - 3 * LOWprev)
    S4 = PP * 3 - (3 * HIGHprev - LOWprev)
    R5 = PP * 4 + (HIGHprev - 4 * LOWprev)
    S5 = PP * 4 - (4 * HIGHprev - LOWprev)
    [R5, R4, R3, R2, R1, PP, S1, S2, S3, S4, S5]

f_getFibPivots(HIGHprev, LOWprev, CLOSEprev)=>
    PP = (HIGHprev + LOWprev + CLOSEprev) / 3
    R1 = PP + 0.382 * (HIGHprev - LOWprev)
    S1 = PP - 0.382 * (HIGHprev - LOWprev)
    R2 = PP + 0.618 * (HIGHprev - LOWprev)
    S2 = PP - 0.618 * (HIGHprev - LOWprev)
    R3 = PP + (HIGHprev - LOWprev)
    S3 = PP - (HIGHprev - LOWprev)
    R4 = PP + 1.41 * (HIGHprev - LOWprev)
    S4 = PP - 1.41 * (HIGHprev - LOWprev)
    R5 = PP + 1.65 * (HIGHprev - LOWprev)
    S5 = PP - 1.65 * (HIGHprev - LOWprev)
    [R5, R4, R3, R2, R1, PP, S1, S2, S3, S4, S5]

f_getPivotPoints(HTFMultiplier, resolution, ppType)=>
    derivedResolution = resolution == ""? f_multiple_resolution(HTFMultiplier) : resolution
    HIGHprev = f_secureSecurity(syminfo.tickerid, derivedResolution, high)
    LOWprev = f_secureSecurity(syminfo.tickerid, derivedResolution, low)
    CLOSEprev = f_secureSecurity(syminfo.tickerid, derivedResolution, close)
    [R5, R4, R3, R2, R1, PP, S1, S2, S3, S4, S5] = f_getClassicPivots(HIGHprev, LOWprev, CLOSEprev)
    [Rf5, Rf4, Rf3, Rf2, Rf1, PPf, Sf1, Sf2, Sf3, Sf4, Sf5] = f_getFibPivots(HIGHprev, LOWprev, CLOSEprev)
    [R5, R4, R3, R2, R1, PP, S1, S2, S3, S4, S5]

f_getState(Source, R5, R4, R3, R2, R1, PP, S1, S2, S3, S4, S5)=>
    state =
     Source > R5 ? 5 :
     Source > R4 ? 4 :
     Source > R3 ? 3 :
     Source > R2 ? 2 :
     Source > R1 ? 1 :
     Source > PP ? 0 :
     Source > S1 ? -1 :
     Source > S2 ? -2 :
     Source > S3 ? -3 :
     Source > S4 ? -4 :
     Source > S5 ? -5 : -6
    state

[R5, R4, R3, R2, R1, PP, S1, S2, S3, S4, S5] = f_getPivotPoints(HTFMultiplier, resolution, ppType)

[date, mth, yr] = f_getBackTestTimeFrom(backtestFrom, backtestBars)
inDateRange = time >= timestamp(syminfo.timezone, yr, mth, date, 0, 0)

BBU5 = plot(not hideBands ? R5: na, title="R5", color=color.orange, linewidth=1, transp=50, style=plot.style_linebr)
BBU4 = plot(not hideBands ? R4: na, title="R4", color=color.yellow, linewidth=1, transp=50, style=plot.style_linebr)
BBU3 = plot(not hideBands ? R3: na, title="R3", color=color.navy, linewidth=1, transp=50, style=plot.style_linebr)
BBU2 = plot(not hideBands ? R2: na, title="R2", color=color.olive, linewidth=1, transp=50, style=plot.style_linebr)
BBU1 = plot(not hideBands ? R1: na, title="R1", color=color.lime, linewidth=1, transp=50, style=plot.style_linebr)
BBM4 = plot(not hideBands ? PP:na, title="PP", color=color.black, linewidth=2, style=plot.style_linebr)
BBL1 = plot(not hideBands ? S1: na, title="S1", color=color.lime, linewidth=1, transp=50, style=plot.style_linebr)
BBL2 = plot(not hideBands ? S2: na, title="S2", color=color.olive, linewidth=1, transp=50, style=plot.style_linebr)
BBL3 = plot(not hideBands ? S3: na, title="S3", color=color.navy, linewidth=1, transp=50, style=plot.style_linebr)
BBL4 = plot(not hideBands ? S4: na, title="S4", color=color.yellow, linewidth=1, transp=50, style=plot.style_linebr)
BBL5 = plot(not hideBands ? S5: na, title="S5", color=color.orange, linewidth=1, transp=50, style=plot.style_linebr)


fill(BBU5, BBU4, title="RZ5", color=color.green, transp=90)
fill(BBU4, BBU3, title="RZ4", color=color.lime, transp=90)
fill(BBU3, BBU2, title="RZ3", color=color.olive, transp=90)
fill(BBU2, BBU1, title="RZ2", color=color.navy, transp=90)
fill(BBU1, BBM4, title="RZ1", color=color.yellow, transp=90)
fill(BBM4, BBL1, title="SZ1", color=color.orange, transp=90)
fill(BBL1, BBL2, title="SZ2", color=color.red, transp=90)
fill(BBL2, BBL3, title="SZ3", color=color.maroon, transp=90)
fill(BBL3, BBL4, title="SZ4", color=color.maroon, transp=90)
fill(BBL4, BBL5, title="SZ5", color=color.maroon, transp=90)

strategy.risk.allow_entry_in(tradeDirection)
longCondition = crossover(Source[1],R1) and inDateRange
shortCondition = crossunder(Source[1], S2) and inDateRange

strategy.entry("Buy", strategy.long, when=longCondition, oca_name="oca")
strategy.entry("Sell", strategy.short, when=shortCondition, oca_name="oca")