Стратегия оптимизации двойной фильтрации трендов

Обзор
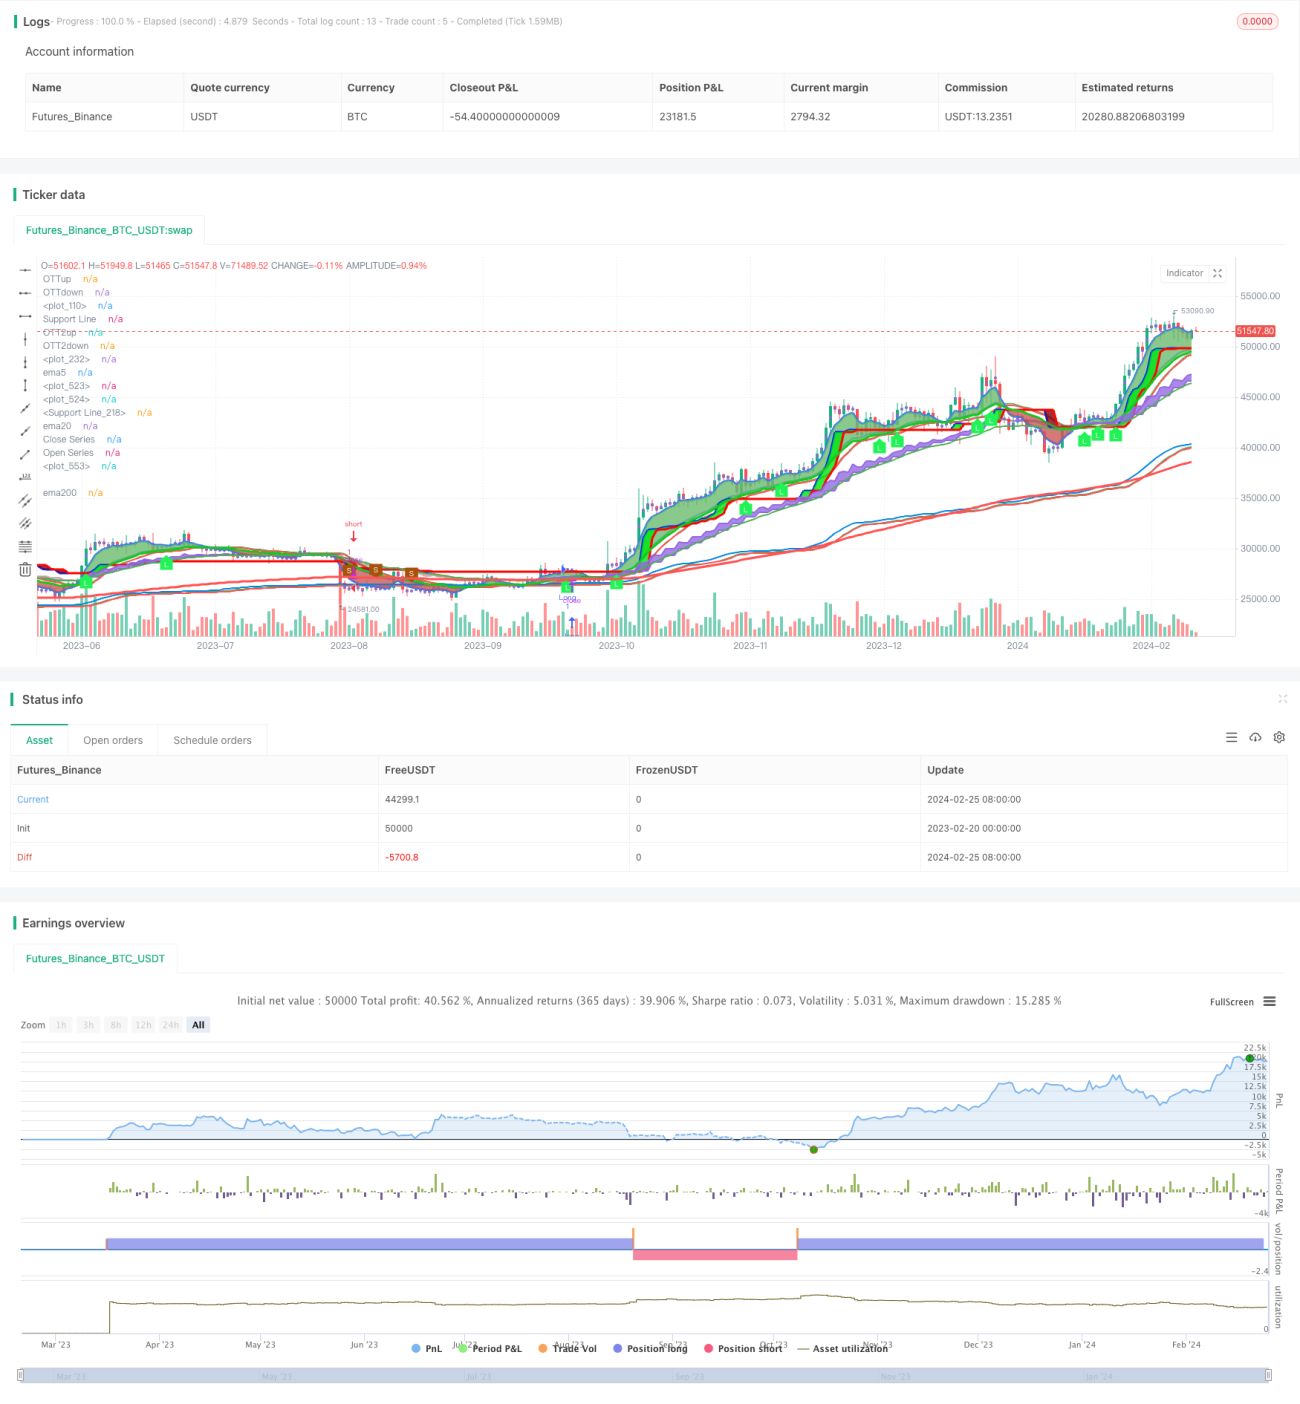
Эта стратегия использует двойную среднюю фильтрацию и многократное подтверждение направления движения, чтобы создать более устойчивую систему отслеживания. Она состоит из трех частей:
-
Оптимизированная система отслеживания тенденций на основе улучшенного двойного пикового трекера для определения направления основных тенденций.
-
Система фильтрации субтенденции, основанная на комбинации многоциклических средних линий, дополнительно отфильтровывает часть шума.
-
Альфа-индекс обеспечивает окончательное подтверждение и гарантирует надежность торговых сигналов.
С помощью вышеуказанной тройной защиты стратегия может более точно судить о больших тенденциях, а также обладает сильной способностью фильтровать шум рынка в краткосрочной перспективе.
Принципы
Отслеживание основных тенденций
Используя улучшенную систему двойного пикового отслеживания колебаний, TOTT и Close Series используют двойные фильтры тенденций для вычисления основных направлений тенденций. TOTT сам по себе обладает очень сильной способностью фильтрации шума.
Фильтрация по субтенденции
В дополнение к системе определения основных тенденций, в стратегии также установлена система фильтрации многоциклических суб-тенденций, основанная на комбинации линий EMA. Многочисленные подтверждающие уровни Golden Cross и Dead Cross, основанные на соотношении равномерных линий EMA, дополнительно повышают надежность определения основных тенденций, фильтруя больше шума.
Альфа подтверждена.
При входе в мирную позицию стратегия также проверяет значение индекса Альфа, чтобы убедиться в надежности окончательного торгового сигнала. Альфа может отражать рыночную силу покупки и продажи, и является хорошим подтверждающим показателем.
Преимущества
- Многозащитный дизайн, более точный в определении тенденций
- Мощная способность фильтрации шума
- Торговые сигналы стабильны и надежны
- Оптимизация параметров
Риск
- Сигнал может генерироваться с низкой частотой.
- Использование равномерной линии в системе отслеживания, которая может быть пробита при резких изменениях рынка
Чтобы снизить вышеупомянутый риск, можно скорректировать параметры, оптимизировать чувствительность системы отслеживания или использовать больше показателей обратного отсчета в качестве конечных фильтров.
Направление оптимизации
- Настройка параметров системы отслеживания двойного пика для поиска наилучшей комбинации параметров
- Попробуйте оптимизировать параметры для разных типов средних линий
- Оптимизация среднелинейного цикла комбинации линий EMA
- Обновление фильтрации Alpha
- Увеличение убыточности
Подвести итог
Общая концепция стратегии была надежной, адекватные меры, множественная защита и мощная шумовая фильтрация обеспечили стабильную производительность. Благодаря постоянной оптимизации параметров и улучшению механизмов, есть возможность улучшить эффективность стратегии.
- 1