
4
Follow
1
Followers
سوال:
-
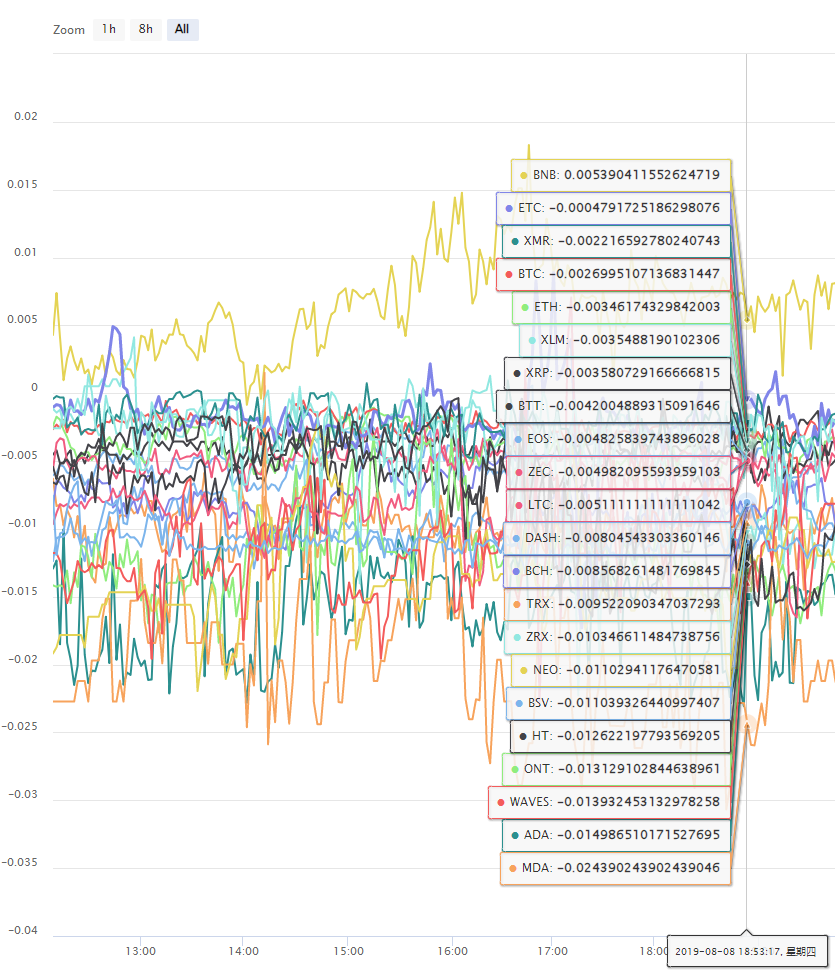
کیا ایک حکمت عملی میں دو شبیہیں دکھائی جا سکتی ہیں؟ میں نے دو چارٹ آبجیکٹ بنانے کی کوشش کی، ایک میں ڈیٹا شامل کیا گیا اور دوسرے میں ڈیٹا شامل کیا گیا، اور پھر میں نے چارٹ آبجیکٹ کو چارٹ کیا، اور پھر میں نے چارٹ آبجیکٹ کو چارٹ کیا، اور پھر میں نے چارٹ آبجیکٹ کو چارٹ کیا، اور پھر میں نے چارٹ آبجیکٹ کو چارٹ کیا، اور پھر میں نے چارٹ آبجیکٹ کو چارٹ کیا۔
یہ کام نہیں کر رہا ہے، یا یہ ایک چارٹ میں دکھایا گیا ہے. -
اگر ایک ٹیبل میں بہت سارے منحنی خطوط دکھائے جائیں تو کیا یہ ممکن ہے کہ ہر منحنی خطوط کے لئے ایک اختیاری سوئچ کو دیکھا جا سکے؟
شکریہ
Related Recommendations
Get Started with FMZ Quant PlatformSECURITY BUGI keep getting error: Exchange_GetAccount: Invalid ContractTypeWe have an incredibly profitable market making algorithm for sideways markets on Bitmex - but need expert to help eliminate wait times during downward volatility in the marketError with deribitLimitations of the backtesting engineHow to install ta-lib on linux docker?5.5 Trading strategy optimization5.4 Why do we need an off-sample test5.3 How to read the strategy backtest performance report
Comment
All comments (3)

可以显示两个图表,在策略广场有范例:
https://www.fmz.com/strategy/136056
https://www.fmz.com/strategy/38203
7 years ago
- 1