ٹرپل موڈ سوئنگ ٹریڈنگ حکمت عملی

جائزہ
ٹرپل موڈ شاک ٹریڈنگ حکمت عملی ایک مختصر لائن ٹریڈنگ حکمت عملی ہے جو متعدد تکنیکی اشارے کے مجموعے پر مبنی ہے۔ یہ حکمت عملی سپر ٹرینڈ اشارے ، ایس ایس ایل ہائبرڈ میڈین لائن اور بہتر QQE اشارے کے ساتھ مل کر ایک مستحکم تجارتی سگنل تشکیل دیتی ہے۔ یہ ڈیجیٹل کرنسی اور اسٹاک جیسی اعلی اتار چڑھاؤ والی تجارتی اقسام کے لئے موزوں ہے ، خاص طور پر اس کے بعد اچھی کارکردگی کا مظاہرہ کیا گیا ہے۔
اصول
داخلہ سگنل
اس کے بعد ، اس نے کہا:
- سپر ٹرینڈ کی واپسی
- ایس ایس ایل مخلوط بیس لائن کو بند کرنے کی قیمت پر ٹریک کریں
- QQE بہتر ورژن نیلے رنگ ((کثیر سر))
خالی گوداموں میں داخلے:
- سپر ٹرینڈ کی طرف سے زیادہ سے زیادہ ہوا
- ایس ایس ایل مخلوط بیس لائن کو بند کرنے کی قیمت کے نیچے ٹریک کریں
- QQE بہتر ورژن سرخ (خالی)
باہر نکلنے کا اشارہ
لانگ پوزیشن کا آغاز: سپر ٹرینڈ کی وجہ سے زیادہ تبدیلی
خالی پوزیشن کا آغاز: سپر ٹرینڈ نے صفر سے زیادہ کی واپسی کی
نقصان کو روکنے
فی صد سٹاپ، اے ٹی آر سٹاپ یا حالیہ کم سے کم قیمت سٹاپ کا انتخاب کریں
تھکاوٹ
سیٹ اپ سٹاپ واپسی تناسب، خود کار طریقے سے سٹاپ قیمت کا حساب
فنڈز کا انتظام
پیسے کے انتظام کی منطق کا استعمال کریں یا نہ کریں
نقشہ جات
- سپر ٹرینڈ لائن ، ایس ایس ایل ہائبرڈ اوسط لائن چینل
- EMA مساوی لائن کو منتخب کریں یا نہیں
- کثیر خالی سر کھولنے ، روکنے اور روکنے کی لائنیں
- ایک سے زیادہ خالی جگہ لیبلنگ
فوائد
- متعدد اشارے کا مجموعہ ، مستحکم تجارتی سگنل بناتا ہے
سپر ٹرینڈ ، ایس ایس ایل ہائبرڈ اوسط اور کیو کیو ای ایڈیشن اشارے کے ساتھ مل کر ، مختلف اشارے ایک دوسرے کی توثیق کرتے ہیں ، جعلی توڑ کو فلٹر کرتے ہیں ، اور اعلی معیار کے تجارتی سگنل تیار کرتے ہیں۔
- اتار چڑھاؤ والی اقسام کے لئے مناسب ہلچل کا کاروبار
حکمت عملی مختصر لائن ٹریڈنگ کا استعمال کرتی ہے ، جس میں مختصر لائن کی قیمت میں اتار چڑھاو کو پکڑنے پر توجہ دی جاتی ہے۔ سپر ٹرینڈ قیمت کے رجحانات کو مؤثر طریقے سے ٹریک کرتا ہے ، اور ایس ایس ایل ہائبرڈ میڈین لائن سپورٹ پریشر کی سطح کو واضح طور پر پہچان سکتی ہے ، جو دونوں کے ساتھ مل کر استعمال کیا جاسکتا ہے۔
- آپشن کے لئے مختلف سٹاپ نقصانات
اسٹاپ نقصان کا انتخاب فی صد ، اے ٹی آر یا حالیہ چوٹی ہے۔ اسٹاپ ریٹرن کا تناسب طے کیا جاسکتا ہے۔ فنڈ مینجمنٹ پوزیشن پر قابو رکھ سکتی ہے۔ صارفین کو مختلف قسم کی خصوصیات اور خطرے کی ترجیحات کے مطابق آزادانہ طور پر جوڑنے کی اجازت ہے۔
- واضح نقشہ
حکمت عملی کا نقشہ واضح اور بصری طور پر روکنے ، روکنے اور روکنے کی لائن کی سطح کو ظاہر کرتا ہے۔ کھلی پوزیشن لائن کی نشاندہی ٹریڈنگ سگنل کو آسانی سے پہچان سکتی ہے۔
خطرہ اور اصلاح
- چھوٹے نقصانات کا امکان
شارٹ لائن ٹریڈنگ کے استعمال کی وجہ سے ، عام جھٹکے والے چھوٹے نقصانات سے مکمل طور پر گریز نہیں کیا جاسکتا ہے۔ آپ کو روکنے کی حد کو مناسب طریقے سے نرمی دی جاسکتی ہے ، فنڈ مینجمنٹ کی منطق کو بہتر بنایا جاسکتا ہے۔
- جعلی دراندازی کا خطرہ
جب قیمت میں جھوٹی توڑ ہوتی ہے تو ، غلط سگنل بن سکتے ہیں۔ مختلف ادوار کے EMAs کو جعلی توڑنے کے لئے فلٹر کرنے کے لئے ٹیسٹ کیا جاسکتا ہے ، یا رجحان کی شناخت کے اشارے کے پیرامیٹرز کو بہتر بنایا جاسکتا ہے۔
- نگرانی کے اشارے کے ناکامی کا خطرہ
اگر بنیادی اشارے غیر فعال ہوجاتے ہیں تو ، متعدد غلط سگنل ظاہر ہوتے ہیں۔ اشارے کی تاثیر کو باقاعدگی سے تصدیق کریں ، مسائل کو وقت پر ایڈجسٹ کریں۔
- ریٹرننگ سائیکل کو بہتر بنائیں
فی الحال ریٹرننگ کا دورانیہ ایک مقررہ وقت کی مدت ہے ، جو مختلف اقسام کے مختلف بازاروں کے دورانیے کو پورا نہیں کرسکتا ہے۔ یہ تجویز کی گئی ہے کہ معاہدہ کرنے والے کے تجارتی وقت کی مدت کے مطابق اصلاح کی جائے۔
- نسلوں کی موافقت کو بہتر بنانا
حکمت عملی کے پیرامیٹرز کو مختلف اقسام کے اعداد و شمار کی خصوصیات کے مطابق ٹھیک کیا جاسکتا ہے ، جس سے طویل اور مختصر پوزیشنوں کی جیت کی شرح میں اضافہ ہوتا ہے۔ حکمت عملی پر مختلف پیرامیٹرز کے اثرات کا موازنہ کرنے کے لئے قدم بہ قدم اصلاح کے طریقہ کار کو اپنانے کی تجویز ہے۔
خلاصہ کریں۔
یہ حکمت عملی متعدد اشارے کا استعمال کرکے تجارتی سگنل تشکیل دیتی ہے ، جو غیر مستحکم ڈیجیٹل کرنسیوں اور انفرادی حصص کے لئے موزوں ہے۔ اس کے علاوہ ، اس میں متعدد اسٹاپ لاس اسٹاپ کے اختیارات دستیاب ہیں ، استعمال کرنے میں لچکدار ہے۔ مجموعی طور پر ، یہ حکمت عملی مستحکم تجارتی سگنل تشکیل دیتی ہے ، جو وسط اور مختصر لائن کے اتار چڑھاؤ کے حالات میں بہتر منافع حاصل کرسکتی ہے۔ مزید اصلاح کے ذریعہ ، حکمت عملی کے منافع بخش عنصر کو مختلف قسم کے تجارت کے ل optim بہتر بنانے کے پیرامیٹرز کو بہتر بنایا جاسکتا ہے۔ یہ حکمت عملی ایک اعلی کارکردگی کا تجارتی نظام ہے جس کا گہرائی سے مطالعہ کرنے کے قابل ہے۔
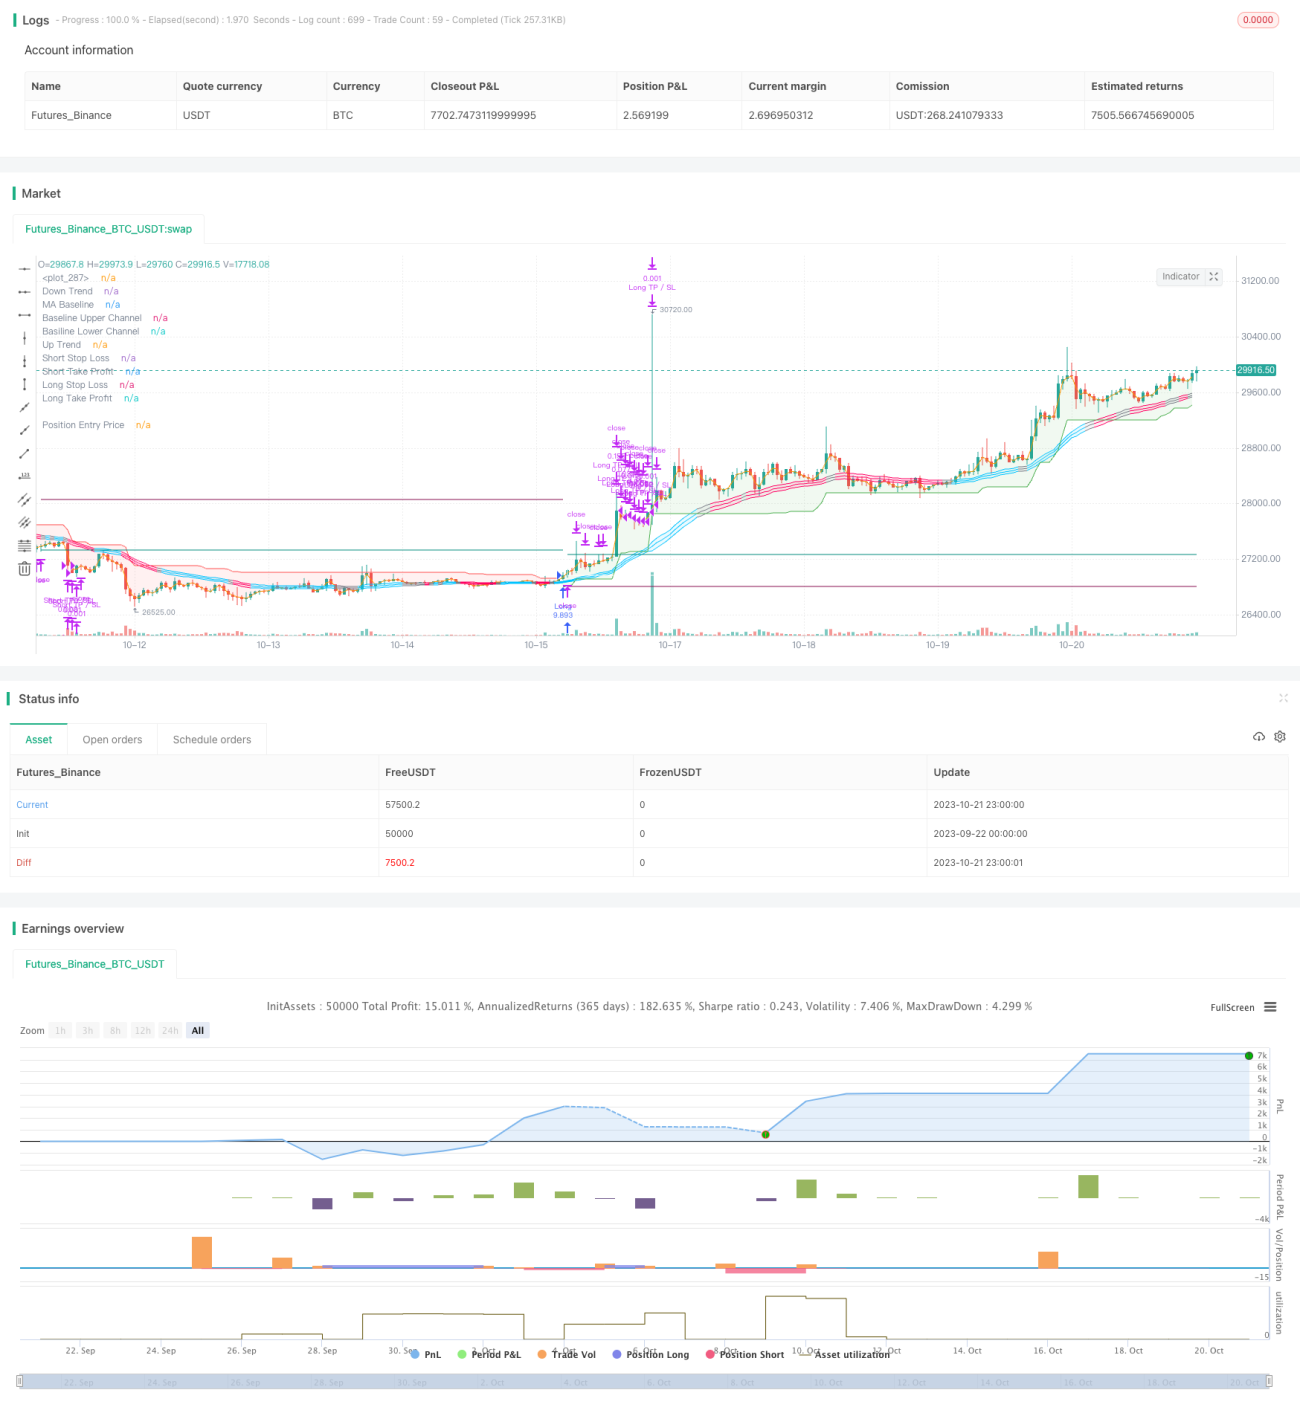
/*backtest
start: 2023-09-22 00:00:00
end: 2023-10-22 00:00:00
period: 1h
basePeriod: 15m
exchanges: [{"eid":"Futures_Binance","currency":"BTC_USDT"}]
*/

// This source code is subject to the terms of the Mozilla Public License 2.0 at https://mozilla.org/MPL/2.0/
// © fpemehd
// Thanks to myncrypto, jason5480, kevinmck100
// @version=5- 1