موونگ اوسط پیش رفت بولنگر بینڈ کی حکمت عملی

1
Follow
1779
Followers
جائزہ
یہ حکمت عملی ایک سادہ توڑنے کی حکمت عملی کو حاصل کرنے کے لئے ایک متحرک اوسط اشارے ، بلین بینڈ اشارے اور یو ٹی بوٹ الرٹس اشارے کو جوڑتی ہے۔ جب قیمت بلین بینڈ کو ٹریک کرتی ہے تو ، زیادہ کام کریں اور جب قیمت بلین بینڈ کو ٹریک کرتی ہے تو ، اس سے زیادہ کام کریں۔
حکمت عملی کا اصول
- رجحانات کا فیصلہ کرنے کے لئے 200 ادوار کے ای ایم اے کا استعمال کرتے ہوئے مرکزی محور۔ ای ایم اے کے اوپر قیمت تیزی سے بڑھتی ہے ، ای ایم اے کے نیچے قیمت گرتی ہے۔
- یو ٹی بوٹ الرٹس اشارے اے ٹی آر کے ساتھ مل کر خرید و فروخت کے سگنل پیدا کرتے ہیں۔ جب قیمت اور تیز ای ایم اے کراس بلینڈ ٹریک ہوجاتا ہے تو ایک سے زیادہ سگنل پیدا ہوتا ہے۔ جب قیمت اور تیز ای ایم اے کراس بلینڈ ٹریک ہوجاتا ہے تو ایک سے کم سگنل پیدا ہوتا ہے۔
- اے ٹی آر اسٹاپ نقصان کا اشارے اسٹاپ نقصان کی پوزیشن کو طے کرنے کے لئے استعمال کیا جاتا ہے۔ اسٹاپ نقصان کا فاصلہ اے ٹی آر کی قیمت سے 1.5 گنا ہے۔
- اسٹاپ نقصان ، اسٹاپ اسٹاپ اور اسٹاپ نقصان کو داخلے کی قیمت پر منتقل کرنے کے مقابلے میں خطرے سے واپسی کے ذریعے داخلے کے بعد۔
طاقت کا تجزیہ
- برن بینڈ کے اشارے کا استعمال کرتے ہوئے ، آپ کو منافع کے امکانات کو بڑھانے کے لئے مناسب وقت کا تعین کرنے میں مدد مل سکتی ہے۔
- یو ٹی بوٹ الرٹس اشارے زیادہ درست سگنل پیدا کرسکتے ہیں۔
- خطرے کی واپسی کے تناسب کو روکنے اور روکنے کے لئے استعمال کیا جاتا ہے ، جو خطرے کو مؤثر طریقے سے کنٹرول کرسکتا ہے۔
خطرے کا تجزیہ
- برن بیلٹ کے زلزلے سے شہر میں غلط سگنل پیدا ہونے کا خطرہ ہے۔
- اے ٹی آر میں تاخیر ہوتی ہے اور رجحان کے آغاز میں اسٹاپ نقصان کا فاصلہ بہت بڑا ہوسکتا ہے۔
- اس کے نتیجے میں، آپ کو اپنے آپ کو بہت زیادہ متحرک یا بہت زیادہ محافظ بنانا پڑتا ہے.
اصلاح کی سمت
- یو ٹی بوٹ الرٹس کے بجائے دوسرے اشارے استعمال کرنے کی کوشش کریں۔
- ATR کے دورانیہ اور ضرب کو بہتر بنایا جاسکتا ہے ، تاکہ اسٹاپ نقصان کا فاصلہ زیادہ موزوں ہو۔
- یہ مختلف قسم کے خطرے کے منافع کے تناسب کی جانچ پڑتال کرنے کے لئے بہترین پیرامیٹرز تلاش کرنے کے لئے استعمال کیا جا سکتا ہے.
خلاصہ کریں۔
اس حکمت عملی میں متعدد اشارے کی خوبیوں کو مربوط کیا گیا ہے ، جس میں ایک مضبوط افادیت ہے۔ پیرامیٹرز کو بہتر بنانے کے ذریعے ، یہ ایک مستحکم اور قابل اعتماد توڑنے والا نظام بن سکتا ہے۔ تاہم ، اشارے کی ناکامی اور پیرامیٹرز کے غلط استعمال سے ہونے والے خطرات سے بچنے کے لئے بھی محتاط رہنا چاہئے۔
Source
Pine
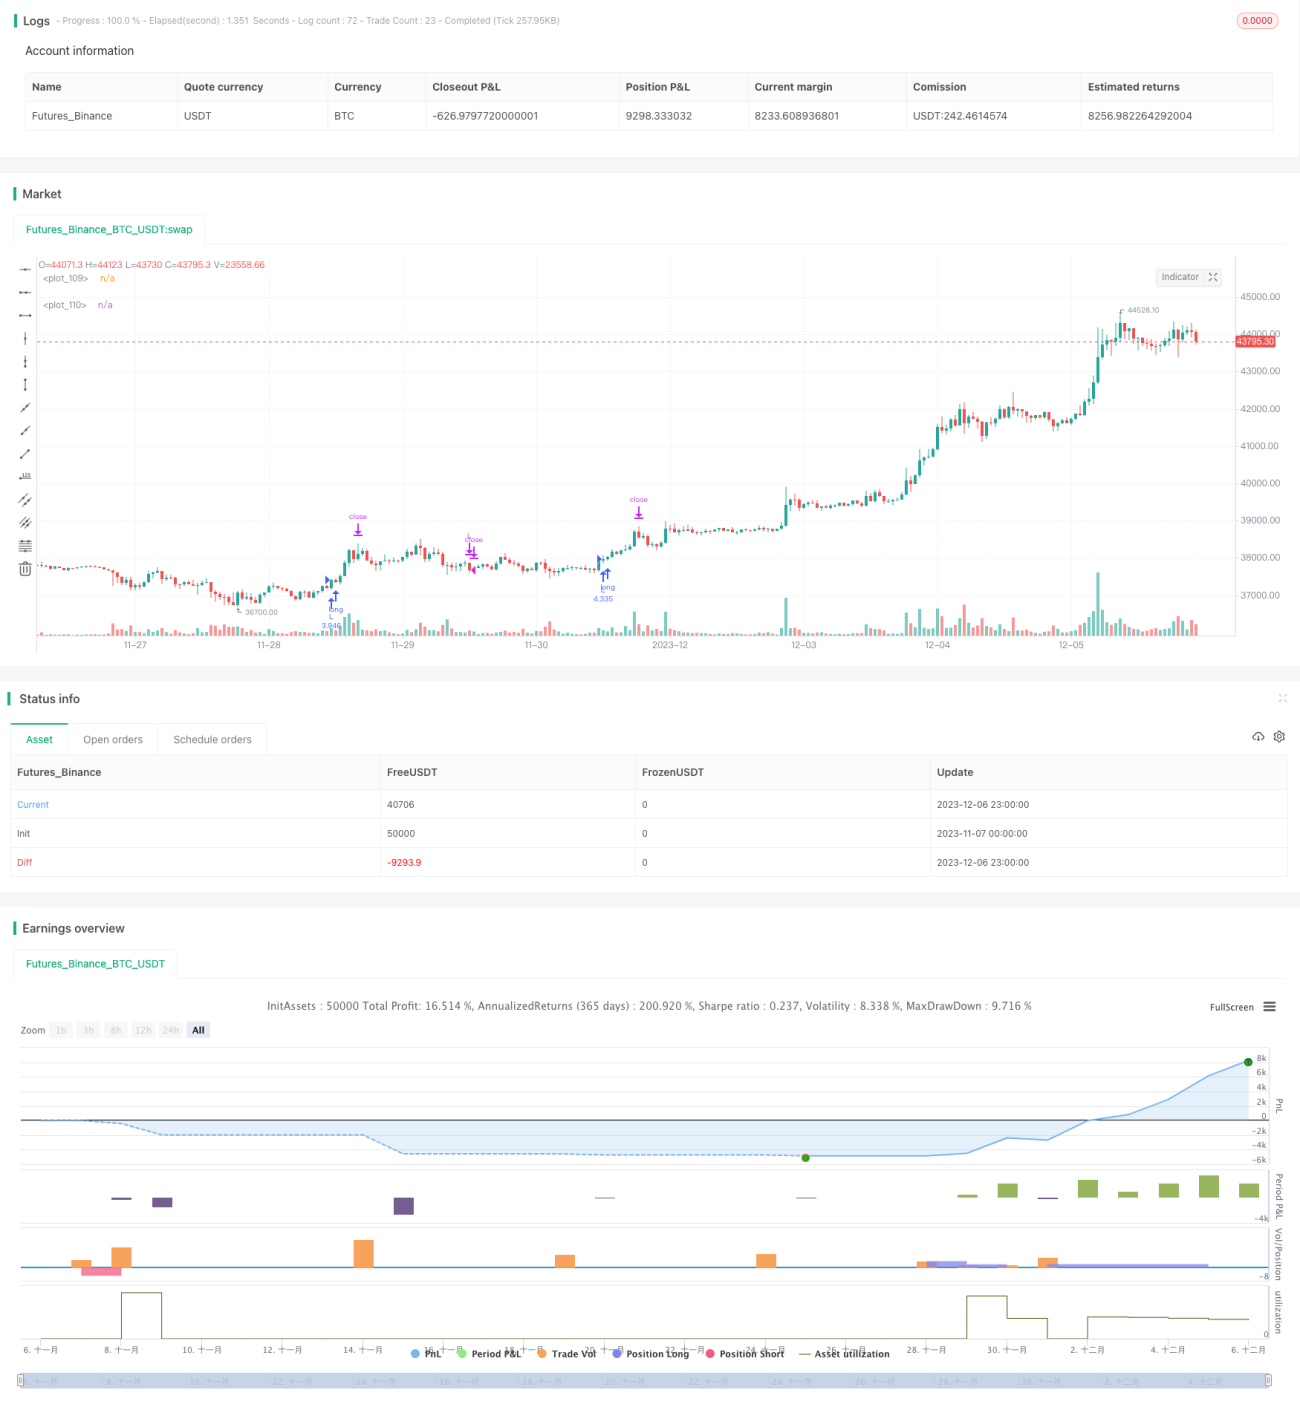
/*backtest
start: 2023-11-07 00:00:00
end: 2023-12-07 00:00:00
period: 1h
basePeriod: 15m
exchanges: [{"eid":"Futures_Binance","currency":"BTC_USDT"}]
*/

// This source code is subject to the terms of the Mozilla Public License 2.0 at https://mozilla.org/MPL/2.0/
//@version=5
//Developed by StrategiesForEveryone
Strategy parameters
Related strategies
Comment
All comments (0)
No data
- 1