ڈائنامک ٹریڈرز انڈیکس اشارے کی حکمت عملی
جائزہ
یہ حکمت عملی متحرک تاجر اشارے ((TDI) اشارے اور قیمت ایکشن چینل ((PAC) اشارے پر مبنی ہے ، جو بلین بینڈ چینل ، نسبتا strong مضبوط اشارے ((RSI) اور MACD اشارے کے ساتھ مل کر ایک رجحان سے باخبر رہنے کا نظام ہے۔
یہ حکمت عملی بنیادی طور پر رجحانات کو تلاش کرنے اور رجحانات کی سمت میں اہم تبدیلیوں پر ٹریڈنگ سگنل پیدا کرنے کے لئے استعمال کیا جاتا ہے۔ یہ متعدد اشارے کو جوڑتا ہے جس کا مقصد سگنل کی تکرار کی شرح اور سگنل کے معیار کو بہتر بنانا ہے۔
حکمت عملی کا اصول
اس حکمت عملی کا بنیادی حصہ ٹی ڈی آئی اشارے ہیں۔ ٹی ڈی آئی متعدد ذیلی اشارے پر مشتمل ہے ، جس میں بنیادی طور پر شامل ہیں:
- رشتہ دار مضبوط اشاریہ ((RSI): ردعمل کی قیمت کی طاقت
- برن بیلٹ چینل: ردعمل کی قیمتوں میں اتار چڑھاؤ کی حد
- RSI قیمت لائن: RSI کی سادہ منتقل اوسط ، RSI کی قیمتوں کے رجحانات پر رد عمل
- آر ایس آئی ٹریڈنگ سگنل لائن: آر ایس آئی کی ایک اور سادہ منتقل اوسط جو ٹریڈنگ سگنل پیدا کرنے کے لئے استعمال ہوتی ہے
جب RSI قیمت لائن اور RSI ٹریڈنگ سگنل لائن میں سنترالی گولڈ کراس لائن ہوتی ہے تو خریدنے کا اشارہ ہوتا ہے۔ جب دونوں لائنوں میں سنترالی موت کراس لائن ہوتی ہے تو فروخت کرنے کا اشارہ ہوتا ہے۔ درمیانی لائن کو عبور کرنے والی ٹریڈنگ سگنل لائن بھی ایک کمزور سگنل پیدا کرتی ہے۔
اس کے علاوہ ، حکمت عملی میں قیمت کی کارروائی کے چینل کا اشارے بھی شامل ہے۔ یہ اشارے قیمت کے چینل کو وقت کی مدت کے دوران اعلی ترین اور کم ترین قیمتوں پر مبنی قیمتوں کا حساب لگاتا ہے۔ جب قیمت چینل کے اوپری حصے یا نیچے کی طرف قریب آتی ہے تو ، اس کا مطلب یہ ہے کہ اس میں الٹ جانے کا موقع مل سکتا ہے۔
غلط اطلاعات کو فلٹر کرنے کے لئے ، حکمت عملی میں MACD اشارے بھی متعارف کروائے گئے ہیں۔ MACD کالم کا رنگ صرف تب ہی ٹریڈ سگنل کی سمت کے مطابق ہوتا ہے جب انٹری سگنل کو متحرک کیا جاتا ہے۔
اسٹریٹجک فوائد
اس حکمت عملی میں ایک ہی اشارے کے مقابلے میں متعدد اشارے شامل ہیں:
- TDI اشارے رجحانات کی تبدیلیوں کے لئے زیادہ حساس ہیں
- سپورٹ اور دباؤ کی عکاسی کرنے والی قیمتوں کی کارروائی کا واضح راستہ
- MACD غلط رپورٹس کو مؤثر طریقے سے فلٹر کر سکتا ہے
اس کے علاوہ، ٹی ڈی آئی رجحانات کے پیچھے چلنے والے اشارے جیسے حرکت پذیر اوسط کے مقابلے میں رجحانات کے الٹ جانے کے لئے زیادہ حساس ہے، جس سے غیر ضروری نقصانات کو کم کیا جاسکتا ہے۔
اس حکمت عملی کو مختلف مارکیٹ کے حالات کے مطابق پیرامیٹرز کے ذریعہ ایڈجسٹ کیا جاسکتا ہے۔
اسٹریٹجک رسک
- کثیر اشاریہ اوورلیپنگ، پیچیدہ پیرامیٹرز ایڈجسٹمنٹ
- ٹرانزیکشن کی کثرت سے ٹرانزیکشن کی لاگت اور سلائڈ پوائنٹ کے خطرے میں اضافہ ہوسکتا ہے
- ریورس ٹرانسمیشن 100٪ درست نہیں ہے اور قیمتوں میں ایک سمت میں جاری رہنے کے رجحان کو یاد کر سکتا ہے
- ریئل ٹائم ٹریڈنگ میں قیمتوں میں تبدیلی کی پیمائش سے کہیں زیادہ پیچیدہ ہے ، سگنل کے اثرات کو نقل کرنا مشکل ہے
اسٹاپ نقصان کی حد کو بڑھا کر انفرادی نقصان کو کم کیا جاسکتا ہے۔ پیرامیٹرز کے مجموعے کو بہتر بنانا سگنل کی کوالٹی کو بہتر بناتا ہے۔ مناسب طریقے سے داخلہ کی شرائط کو کم کرنے کے لئے تجارتی تعدد کو کم کرنا۔
اصلاح کی سمت
- TDI پیرامیٹرز کو ایڈجسٹ کریں اور بہترین مجموعہ تلاش کریں
- قیمت کی کارروائی کے چینل کی لمبائی کو ایڈجسٹ کریں ، معاون مزاحمت کی شناخت کو بہتر بنائیں
- MACD پیرامیٹرز کو ایڈجسٹ کریں اور انٹری فلٹرنگ کو بہتر بنائیں
- پوزیشن مینجمنٹ اور موزوں سٹاپ حکمت عملی شامل کریں
خلاصہ کریں۔
یہ حکمت عملی رجحانات اور الٹ کے مواقع کا فیصلہ کرنے کے لئے متعدد اشارے کا جامع استعمال کرتی ہے۔ مختلف اقسام کے مطابق پیرامیٹرز کو ایڈجسٹ کیا جاسکتا ہے۔ اس کی کچھ عملی جنگ کی قیمت ہے ، لیکن سگنل کے اثر کو کمال کے قریب لانا ابھی بھی مشکل ہے۔ پیچیدہ متغیر ریئل اسٹیٹس میں محتاط استعمال کی سفارش کی گئی ہے۔
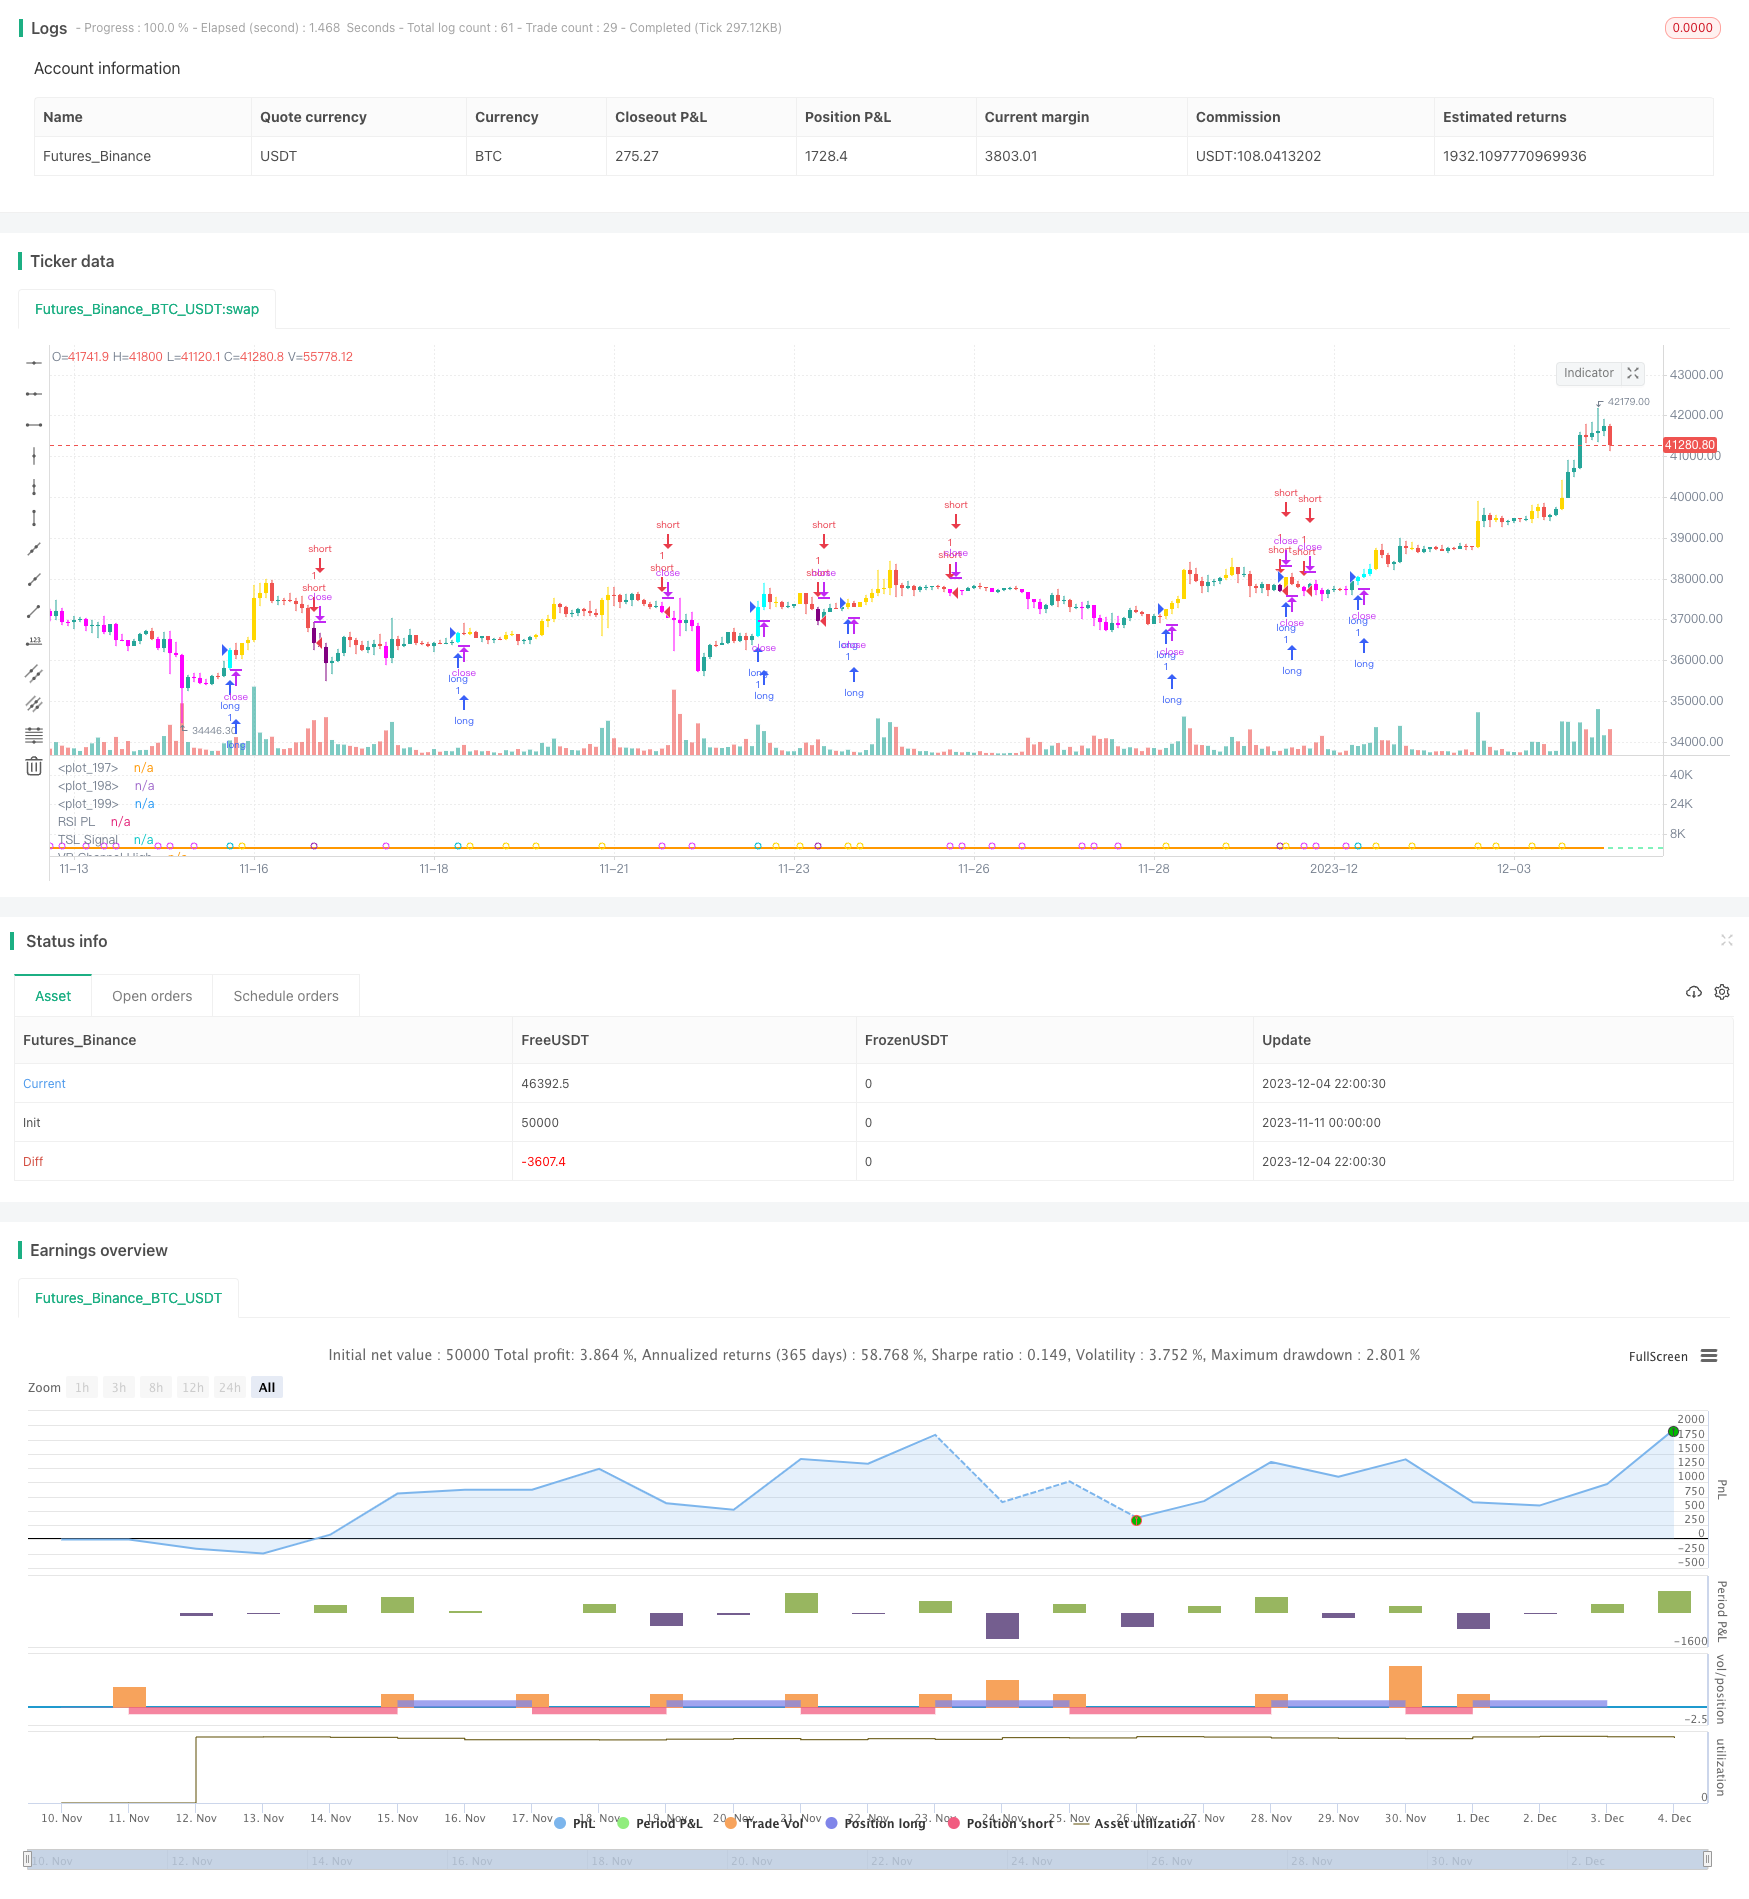
/*backtest
start: 2023-11-11 00:00:00
end: 2023-12-05 00:00:00
period: 2h
basePeriod: 15m
exchanges: [{"eid":"Futures_Binance","currency":"BTC_USDT"}]
*/

//@version=4
//

strategy("[BACKTEST]Traders Dynamic Index Indicator Alert by JustUncleL", shorttitle="[BACKTEST]TDIALT")

//
// author: JustUncleL
// date: 10-Oct-2019
//
// Description:
//   This script is a "strategy" version of the "Traders Dynamic Index Indicator Alert v0.1 by JustUncleL"
//   made available for backtesting to help optimize settings.
//
//   This is a Trend following system utilising the Traders Dynamic Index (TDI),
//   Price Action Channel (PAC) and Heikin Ashi candles.
//   About while ago I came across the use of TDI in "E.A.S.Y. Method" that I found in
//   forexfactory forums: http://www.forexfactory.com/attachment.php?attachmentid=686629&d=1303831008
//   and I was able to set up a chart based on the specifications by using Kurbelklaus scripts.
//   However, I found that the alerts were being generated one or two bars too late,
//   so I was not successful using it with Binary Options. Later I found a variation of the
//   method in the forums which generates alerts a bit earlier, so this indicator is a
//   variation of that early detection version.
//   The indicator can optionally use Heikin  Ashi candles only for all it's calculations,
//   I would recommend viewing the chart with normal Heikin Ashi candles, these
//   smooth out the trends and makes them more visible.
//
//   I found that this metod it works OK with currency pairs or commodities.
//   It also seems to work well with 5min+ timeframe charts,
//   and for Binary Options I would suggest expiry of 2 to 6 candles.
//
//   ALERT GENERATION:
//   =================
//
//   The TDI (Traders Dynamic Index)
//   -------------------------------
//   Volatility Band VB(34), color: Blue, buffer: UpZone, DnZone
//   Relative Strength Index RSI(13)
//   RSI PRICE LINE (2), color: Green, buffer: mab
//   RSI TRADE SIGNAL LINE (7), color: Red, buffer: mbb
//   MARKET BASE LINE MID VB(34), color: Orange, buffer: mid
//
//   Indicator SignalLevels:
//   -----------------------
//   RSI_OversoldLevel : 22 (normally: 32)
//   RSI_OverboughtLevel : 78 (normally: 68)
//
//   Alert Conditions:
//   -----------------
//   Strong Buy (yellow): HIGH>PAC upper && BULL Candle && Candle High>PAC High && RSI>TRADE SIGNAL LINE && RSI>RSI_OversoldLevel &&
//                        && RSI<RSI_OverboughtLevel && TRADE SIGNAL LINE> MARKET BASE LINE
//   Medium Buy (aqua): HIGH>PAC upper && BULL Candle && Candle High>PAC High && RSI>TRADE SIGNAL LINE && RSI>RSI_OversoldLevel
//                        && RSI<RSI_OverboughtLevel && RSI> MARKET BASE LINE && TRADE SIGNAL LINE< MARKET BASE LINE
//   Weak Buy (blue):   HIGH>PAC upper && BULL Candle && Candle High>PAC High && RSI>TRADE SIGNAL LINE && RSI>RSI_OversoldLevel
//                        && RSI<RSI_OverboughtLevel && TRADE SIGNAL LINE<MARKET BASE LINE && RSI< MARKET BASE LINE
//
//   Strong Sell (fuchsia): LOW<PAC lower && BEAR Candle && Candle Low>PAC Low && RSI<TRADE SIGNAL LINE && RSI>RSI_OversoldLevel
//                        && RSI<RSI_OverboughtLevel && TRADE SIGNAL LINE< MARKET BASE LINE
//   Medium Sell (purple): LOW<PAC lower && BEAR Candle && Candle Low>PAC Low && RSI<TRADE SIGNAL LINE && RSI>RSI_OversoldLevel
//                           && RSI<RSI_OverboughtLevel && RSI< MARKET BASE LINE && TRADE SIGNAL LINE> MARKET BASE LINE
//   Weak Sell (black): LOW<PAC lower && BEAR Candle && Candle Low>PAC Low && RSI<TRADE SIGNAL LINE && RSI>RSI_OversoldLevel
//                        && RSI<RSI_OverboughtLevel && TRADE SIGNAL LINE> MARKET BASE LINE && RSI> MARKET BASE LINE
//
//   HIGH LEVEL FILTER (Overbought): RSI>=RSI_OverboughtLevel or MACD Histogram not green
//   LOW LEVEL FILTER (Oversold): RSI<=RSI_OversoldLevel or MACD Histogram not red
//
//   Hints on How to use:
//   --------------------
//   - When a Medium or Strong alert is generated and MACD histogram colour matches the direction
//     of the alert, then place trade in direction of alert candle and MACD.
//   - Use the multi-Hull MA's for trend direction confirmation.
//   - Best positions occur near the MACD(8,16,1) Histogram crossing the zero line.
//   - The optional coloured Dots along the bottom of the indicator represent the first alert
//     of this type that was generated in this sequence.
//   - It is advisable to trade in the direction of the main trend as indicated the HULL MA red cloud:
//     if red cloud underneath PAC then BULLISH trend, if red cloud above PAC then BEARISH trend.
//   - Selecting the HeiKin Ashi candles does affect the MACD and MA caculations, so if you select
//     normal candles the result chart will change. Although the TDI calculations and alerts will stay the
//     same.
//   - When using the Heikin Ashi candles, a good buy entry is indicated by long top wick and no bottom wick
//     for bull (green) candles and good sell entry is indicated by long bottom wick and no top wick for
//     bear (red) candles.
//   - When the MACD histogram is flat and close to zero line,
//     this indicates a ranging market, do NOT trade when this occurs.
//   - When the PAC channel on the main chart is spread apart widely, this is an indication
//     of extreme volitity and choppy chart, do NOT try to trade during these periods.
//     A choppy chart is also indicated by Heikin Ashi candles with long wicks on both sides
//     of the candles.
//   - You can specify what strength level Alerts are generated (default 2):
//     Level (1) means only generate Strong Alerts only.
//     Level (2) means generate Strong and Medium Alerts.
//     Level (3) means generate Strong, Medium and Weak Alerts.
//
//   Modifications:
//   --------------
//     11-Oct-2019
//          - Strategy Version for backtesting created.
//          - Converted to Pinescript V4
//
//     1.3  7-Aug-2017
//          - Modified Alertcondition code so that it only signals on the last completed alerted
//            candle. This should prevent some false alerts and multiple alerts being generated.
//            When setting alarms I suggest using Frequency "Once per bar (on condition)" to get
//            the earliest signal possible.
//          - Added optional alert long/short spikes that only occur on the first Long or Short//      Original code @author LazyBear for basic TDI indicator.

//            signals.
//     1.2  5-Aug-2017:
//          - Added new alerts for Buy and Sell (Long and Short) signals seperately.
//          - Upgraded to version 3 Pinescript.
//          - Added work around patch for opaque bar colouring issue.
//
//     1.1  - Modified code so when viewing Top chart with Heikin Ashi candles, calculations
//            are still based on standard candles, unless Heikin Ashi calculation option selected.
//
//     0.2  - Simplified MACD direction calculation to use just rising/falling.
//     0.1  - Oroginal Version
//   References:
//   -----------
//      Traders Dynamic Index [LazyBear]
//      KK_Traders Dynamic Index_Bar Highlighting by Kurbelklaus
//      KK_Price Action Channel (TDI BH) by Kurbelklaus
//      http://www.forexfactory.com/attachment.php?attachmentid=686629&d=1303831008
//      http://www.forexstrategiesresources.com/trading-system-metatrader-4-iv/504-traders-dynamic-index-how-to-use/
//      http://www.forexfactory.com/showthread.php?t=460148
//      http://www.forexstrategiesresources.com/scalping-forex-strategies-ii/205-scalping-with-tdi-real-macd-stochrainbow/
//
// -----------------------------------------------------------------------------
// Copyright 2016, 2017, 2019 JustUncleL
//
// This program is free software: you can redistribute it and/or modify
// it under the terms of the GNU General Public License as published by
// the Free Software Foundation, either version 3 of the License, or
// any later version.
//
// This program is distributed in the hope that it will be useful,
// but WITHOUT ANY WARRANTY; without even the implied warranty of
// MERCHANTABILITY or FITNESS FOR A PARTICULAR PURPOSE.  See the
// GNU General Public License for more details.
//
// The GNU General Public License can be found here
// <http://www.gnu.org/licenses/>.
//
// -----------------------------------------------------------------------------
//

//
lengthrsi = input(13)
lengthband = input(34)
lengthrsipl = input(2)
lengthtradesl = input(7)
lenH = input(5, minval=1, title="Price Action Channel Length")
lenL = lenH
rsiOSL = input(22, minval=0, maxval=49, title="RSI Oversold Level")
rsiOBL = input(78, minval=51, maxval=100, title="RSI Overbought Level")
strength = input(2, minval=1, maxval=3, step=1, title="Strength Level: (1)Strong (2)Medium (3)All")
sgb = input(false, title="Check Box To Turn Bars Gray")
sbr = input(true, title="Highlight TDI Alert Bars")
sal = input(true, title="Show Alert Condition Status")
uha = input(false, title="Use Heikin Ashi Candles for Calculations")
//

// Constants colours that include fully non-transparent option.
blue100 = #0000FFFF
aqua100 = #00FFFFFF
fuchsia100 = #FF00FFFF
purple100 = #800080FF
gray100 = #808080FF
gold100 = #FFD700FF
white100 = #FFFFFFFF
black100 = #000000FF
gold = #FFD700


// Use only Heikinashi Candles for all calculations or use Standard Candles for calculations.
security_1 = security(heikinashi(syminfo.tickerid), timeframe.period, close)
security_2 = security(syminfo.ticker, timeframe.period, close)
srcClose = uha ? security_1 : security_2
security_3 = security(heikinashi(syminfo.tickerid), timeframe.period, open)
security_4 = security(syminfo.ticker, timeframe.period, open)
srcOpen = uha ? security_3 : security_4
security_5 = security(heikinashi(syminfo.tickerid), timeframe.period, high)
security_6 = security(syminfo.ticker, timeframe.period, high)
srcHigh = uha ? security_5 : security_6
security_7 = security(heikinashi(syminfo.tickerid), timeframe.period, low)
security_8 = security(syminfo.ticker, timeframe.period, low)
srcLow = uha ? security_7 : security_8
//
r = rsi(srcClose, lengthrsi)
ma = sma(r, lengthband)
offs = 1.6185 * stdev(r, lengthband)
upZone = ma + offs
dnZone = ma - offs
mid = (upZone + dnZone) / 2
mab = sma(r, lengthrsipl)
mbb = sma(r, lengthtradesl)
//
hline(rsiOSL, color=color.red, linewidth=1)
hline(50, color=color.black, linewidth=1)
hline(rsiOBL, color=color.lime, linewidth=1)
// Plot the TDI
upl = plot(upZone, color=color.blue, title="VB Channel High", linewidth=2)
dnl = plot(dnZone, color=color.blue, title="VB Channel Low", linewidth=2)
midl = plot(mid, color=color.orange, linewidth=2, title="MBL")
mabl = plot(mab, color=color.green, linewidth=2, title="RSI PL")
mbbl = plot(mbb, color=color.red, linewidth=2, title="TSL Signal")
//
//create RSI TSL cloud to indicate trend direction.
fill(mabl, mbbl, color=mab > mbb ? color.green : color.red, transp=90)

// Calculate Price Action Channel (PAC)
smmaH = 0.0
smmaL = 0.0
sma_1 = sma(srcHigh, lenH)
smmaH := na(smmaH[1]) ? sma_1 : (smmaH[1] * (lenH - 1) + srcHigh) / lenH
sma_2 = sma(srcLow, lenL)
smmaL := na(smmaL[1]) ? sma_2 : (smmaL[1] * (lenL - 1) + srcLow) / lenL
//
umacd = input(false, title="Use MACD Filtering")
fastMA = input(title="MACD Fast MA Length", type=input.integer, defval=8, minval=2)
slowMA = input(title="MACD Slow MA Length", type=input.integer, defval=16, minval=7)
signal = input(title="MACD Signal Length", type=input.integer, defval=1, minval=1)
//
//
[currMacd, _, _] = macd(srcClose[0], fastMA, slowMA, signal)
rising_1 = rising(currMacd, 2)
falling_1 = falling(currMacd, 2)
macdH = currMacd > 0 ? rising_1 ? color.green : color.red :
   falling_1 ? color.red : color.green

//
// Bar - Highlighting  based on indication strength
long = (not umacd or macdH == color.green) and mab > mbb and mab < rsiOBL and
   mab > rsiOSL and srcHigh > smmaH and srcClose > srcOpen ?
   mbb > mid ? 1 : mab > mid and mbb < mid ? 2 : mab < mid and mbb < mid ? 3 : 0 : 0
short = (not umacd or macdH == color.red) and mab < mbb and mab < rsiOBL and
   mab > rsiOSL and srcLow < smmaL and srcClose < srcOpen ?
   mbb < mid ? 1 : mab < mid and mbb > mid ? 2 : mab > mid and mbb > mid ? 3 : 0 : 0
//
// Find the right Bar colour if enabled.
bcolor = not sbr ? na : long == 1 ? gold100 :
   long == 2 and strength > 1 ? aqua100 : long == 3 and strength > 2 ? blue100 :
   short == 1 ? fuchsia100 : short == 2 and strength > 1 ? purple100 :
   short == 3 and strength > 2 ? black100 : sgb ? gray100 : na
//
barcolor(color=bcolor, title="Bars Colours")
//
//
// === ALERT conditions
//
// create alerts only once per sequence type.
//
longCond = long > 0 and long != long[1] and long <= strength
shortCond = short > 0 and short != short[1] and short <= strength

// show dot only when alert condition is met and bar closed.
plotshape(sal and (longCond[1] or shortCond[1]), title="Alert Indicator", location=location.bottom,
          color=long[1] == 1 ? gold : long[1] == 2 ? color.aqua : long[1] == 3 ? color.blue : short[1] == 1 ? color.fuchsia : short[1] == 2 ? color.purple : short[1] == 3 ? color.black : na,
          transp=0, style=shape.circle, offset=-1)
//

// === /ALERT conditions.

// === STRATEGY ===
tradeType = input("BOTH", title="What trades should be taken : ", options=["LONG", "SHORT", "BOTH", "NONE"])

// stop loss
slPoints = input(defval=0, title="Initial Stop Loss Points (zero to disable)", minval=0)
tpPoints = input(defval=0, title="Initial Target Profit Points (zero for disable)", minval=0)

//>>>>>>>>>>>>>>>>>>>>>>>>>>>>>>>>>>>>>>>>>>>>>>>>>>>>>>>>>>>>>>>>>>>>>>>>>>>>>//

testStartYear = input(2018, "Backtest Start Year", minval=1980)
testStartMonth = input(1, "Backtest Start Month", minval=1, maxval=12)
testStartDay = input(1, "Backtest Start Day", minval=1, maxval=31)
testPeriodStart = timestamp(testStartYear, testStartMonth, testStartDay, 0, 0)

testStopYear = input(9999, "Backtest Stop Year", minval=1980)
testStopMonth = input(12, "Backtest Stop Month", minval=1, maxval=12)
testStopDay = input(31, "Backtest Stop Day", minval=1, maxval=31)
testPeriodStop = timestamp(testStopYear, testStopMonth, testStopDay, 0, 0)

testPeriod() =>
    time >= testPeriodStart and time <= testPeriodStop ? true : false

//<<<<<<<<<<<<<<<<<<<<<<<<<<<<<<<<<<<<<<<<<<<<<<<<<<<<<<<<<<<<<<<<<<<<<<<<<<<<<//

//
//set up exit parameters
TP = tpPoints > 0 ? tpPoints : na
SL = slPoints > 0 ? slPoints : na

// Make sure we are within the bar range, Set up entries and exit conditions
if testPeriod() and tradeType != "NONE"
    strategy.entry("long", strategy.long, when=longCond == true and tradeType != "SHORT")
    strategy.entry("short", strategy.short, when=shortCond == true and tradeType != "LONG")
    strategy.close("long", when=shortCond == true and tradeType == "LONG")
    strategy.close("short", when=longCond == true and tradeType == "SHORT")
    strategy.exit("XL", from_entry="long", profit=TP, loss=SL)
    strategy.exit("XS", from_entry="short", profit=TP, loss=SL)

// === /STRATEGY ===
//EOF