رجحان اور اتار چڑھاؤ کی مقداری تجارتی حکمت عملیوں کا امتزاج
جائزہ
ڈبل ٹرینڈ شاک اسٹریٹجی ایک مقدار کی تجارت کی حکمت عملی ہے جس میں رجحان اور شاک دونوں شامل ہیں۔ یہ رجحان کی سمت اور طاقت کی نشاندہی کرنے کے لئے دو اشارے کے مجموعے کا استعمال کرتا ہے اور جب رجحان شاک ہوتا ہے تو اس میں داخل ہونے کا بہترین وقت ڈھونڈتا ہے۔
حکمت عملی کا اصول
اس حکمت عملی میں بنیادی طور پر دو عوامی اشارے استعمال کیے گئے ہیں: ٹرینڈ سرفرز اور ماوریز کا ٹرینڈ آسکیلیٹر۔
ٹرینڈ سرفرز ایک ٹرینڈ ٹریکنگ اسٹاپ نقصان کا اشارے ہے۔ یہ قیمتوں کی حرکت کا اندازہ لگانے اور تجویز کردہ اسٹاپ نقصان کی پوزیشن دینے کے لئے ایک خاص دورانیے میں اعلی ترین اور کم ترین قیمتوں کا حساب لگاتا ہے۔ مثال کے طور پر ، جب قیمت حالیہ 168 K لائن کی اعلی ترین قیمت کو توڑتی ہے تو ، یہ ایک bullish سگنل ہے۔ جب قیمت حالیہ 168 K لائن کی کم ترین قیمت سے نیچے آجاتی ہے تو ، یہ ایک bearish سگنل ہے۔
Mawreez’s Trend Oscillator ایک دو لائن والا اشارے ہے۔ یہ MACD کی طرح ہے ، جو ڈی آئی کے فرق کی طرف سے رجحان کی سمت اور طاقت کا فیصلہ کرتا ہے۔ اشارے کا منحنی خطوط اوپر 0 محور پر اچھال ہے ، نیچے نیچے ہے۔
اس حکمت عملی کے لئے ٹریڈنگ کے قواعد یہ ہیں:
کثیر سر داخلہ: ٹرینڈ سرفرز نے سب سے زیادہ لائن کو توڑ دیا اور ماوریز کے ٹرینڈ اوسلیٹر نے خریدنے کے لئے خرید لیا خالی سر داخلہ: ٹرینڈ سرفرز نیچے کی لائن سے نیچے اور ماوریز کے ٹرینڈ اوسلیٹر اشارے کو نیچے کی طرف فروخت کرتے ہیں
سٹاپ نقصان کا طریقہ ٹرینڈ ٹریکنگ سٹاپ نقصان اور فکسڈ سٹاپ نقصان۔
طاقت کا تجزیہ
اس حکمت عملی میں رجحانات اور جھٹکے کے اشارے شامل ہیں ، جو رجحانات کو پکڑنے کے ساتھ ساتھ جھٹکے کے دوران بہتر قیمتوں میں داخل ہونے کی تلاش میں مدد کرتے ہیں ، اور اس کے فوائد یہ ہیں:
- ڈبل انڈیکس فلٹر ، جعلی توڑنے سے بچنے کے لئے موثر
- رجحانات اور ہلچل کے ساتھ مل کر ، قیمتوں کو آسانی سے پکڑنے کے ل the ہلکی سطح پر ہلکی سطح پر ہلکی سطح پر یا ہلکی سطح پر ہلکی سطح پر
- ایک سے زیادہ سٹاپ نقصان کے ساتھ، خطرے کو کنٹرول کیا جا سکتا ہے
خطرے کا تجزیہ
اس حکمت عملی کے کچھ خطرات بھی ہیں:
- ڈبل اشاریہ پورٹ فولیو ، آسانی سے ضائع ہونے والا
- ٹرینڈ انڈیکیٹرز اور شاک اشارے متضاد سگنل دے سکتے ہیں
- فکسڈ اسٹاپ نقصانات جو جلد ہی ختم ہوسکتے ہیں
ان خطرات سے بچنے کے لیے مندرجہ ذیل اقدامات کیے جا سکتے ہیں:
- انڈیکس پیرامیٹرز کو مناسب طریقے سے نرمی سے ، فریکوئنسی کو کم کریں
- رجحانات کا اندازہ لگانے کے لیے قواعد میں اضافہ کریں تاکہ انڈیکیٹرز میں تنازعہ نہ ہو۔
- متحرک ایڈجسٹمنٹ سٹاپ نقصان کی پوزیشن
اصلاح کی سمت
اس حکمت عملی میں مزید اصلاحات کی گنجائش موجود ہے:
- مختلف پیرامیٹرز کے امتزاج اور دورانیہ کے پیرامیٹرز کی جانچ کریں اور بہترین پیرامیٹرز تلاش کریں
- معاون فیصلے کے قواعد جیسے زیادہ اتار چڑھاؤ ، تجارت کا حجم
- مشین لرننگ ٹکنالوجی کا استعمال کرتے ہوئے متحرک اصلاح کے اشارے اور پیرامیٹرز
خلاصہ کریں۔
دو طرفہ رجحانات کی ہلچل کی حکمت عملی کا فائدہ یہ ہے کہ رجحانات کی نگرانی اور ہلچل کے اشارے کا جامع استعمال ، رجحانات کی سمت کی نشاندہی کرنے کے ساتھ ساتھ ہلچل کے مواقع سے فائدہ اٹھانے کے لئے ، پیرامیٹرز اور قواعد کو بہتر بنانے کے ذریعے حکمت عملی کی منافع بخش صلاحیت کو مزید بڑھا سکتا ہے۔ اس حکمت عملی میں ترقی کے اچھے امکانات ہیں۔
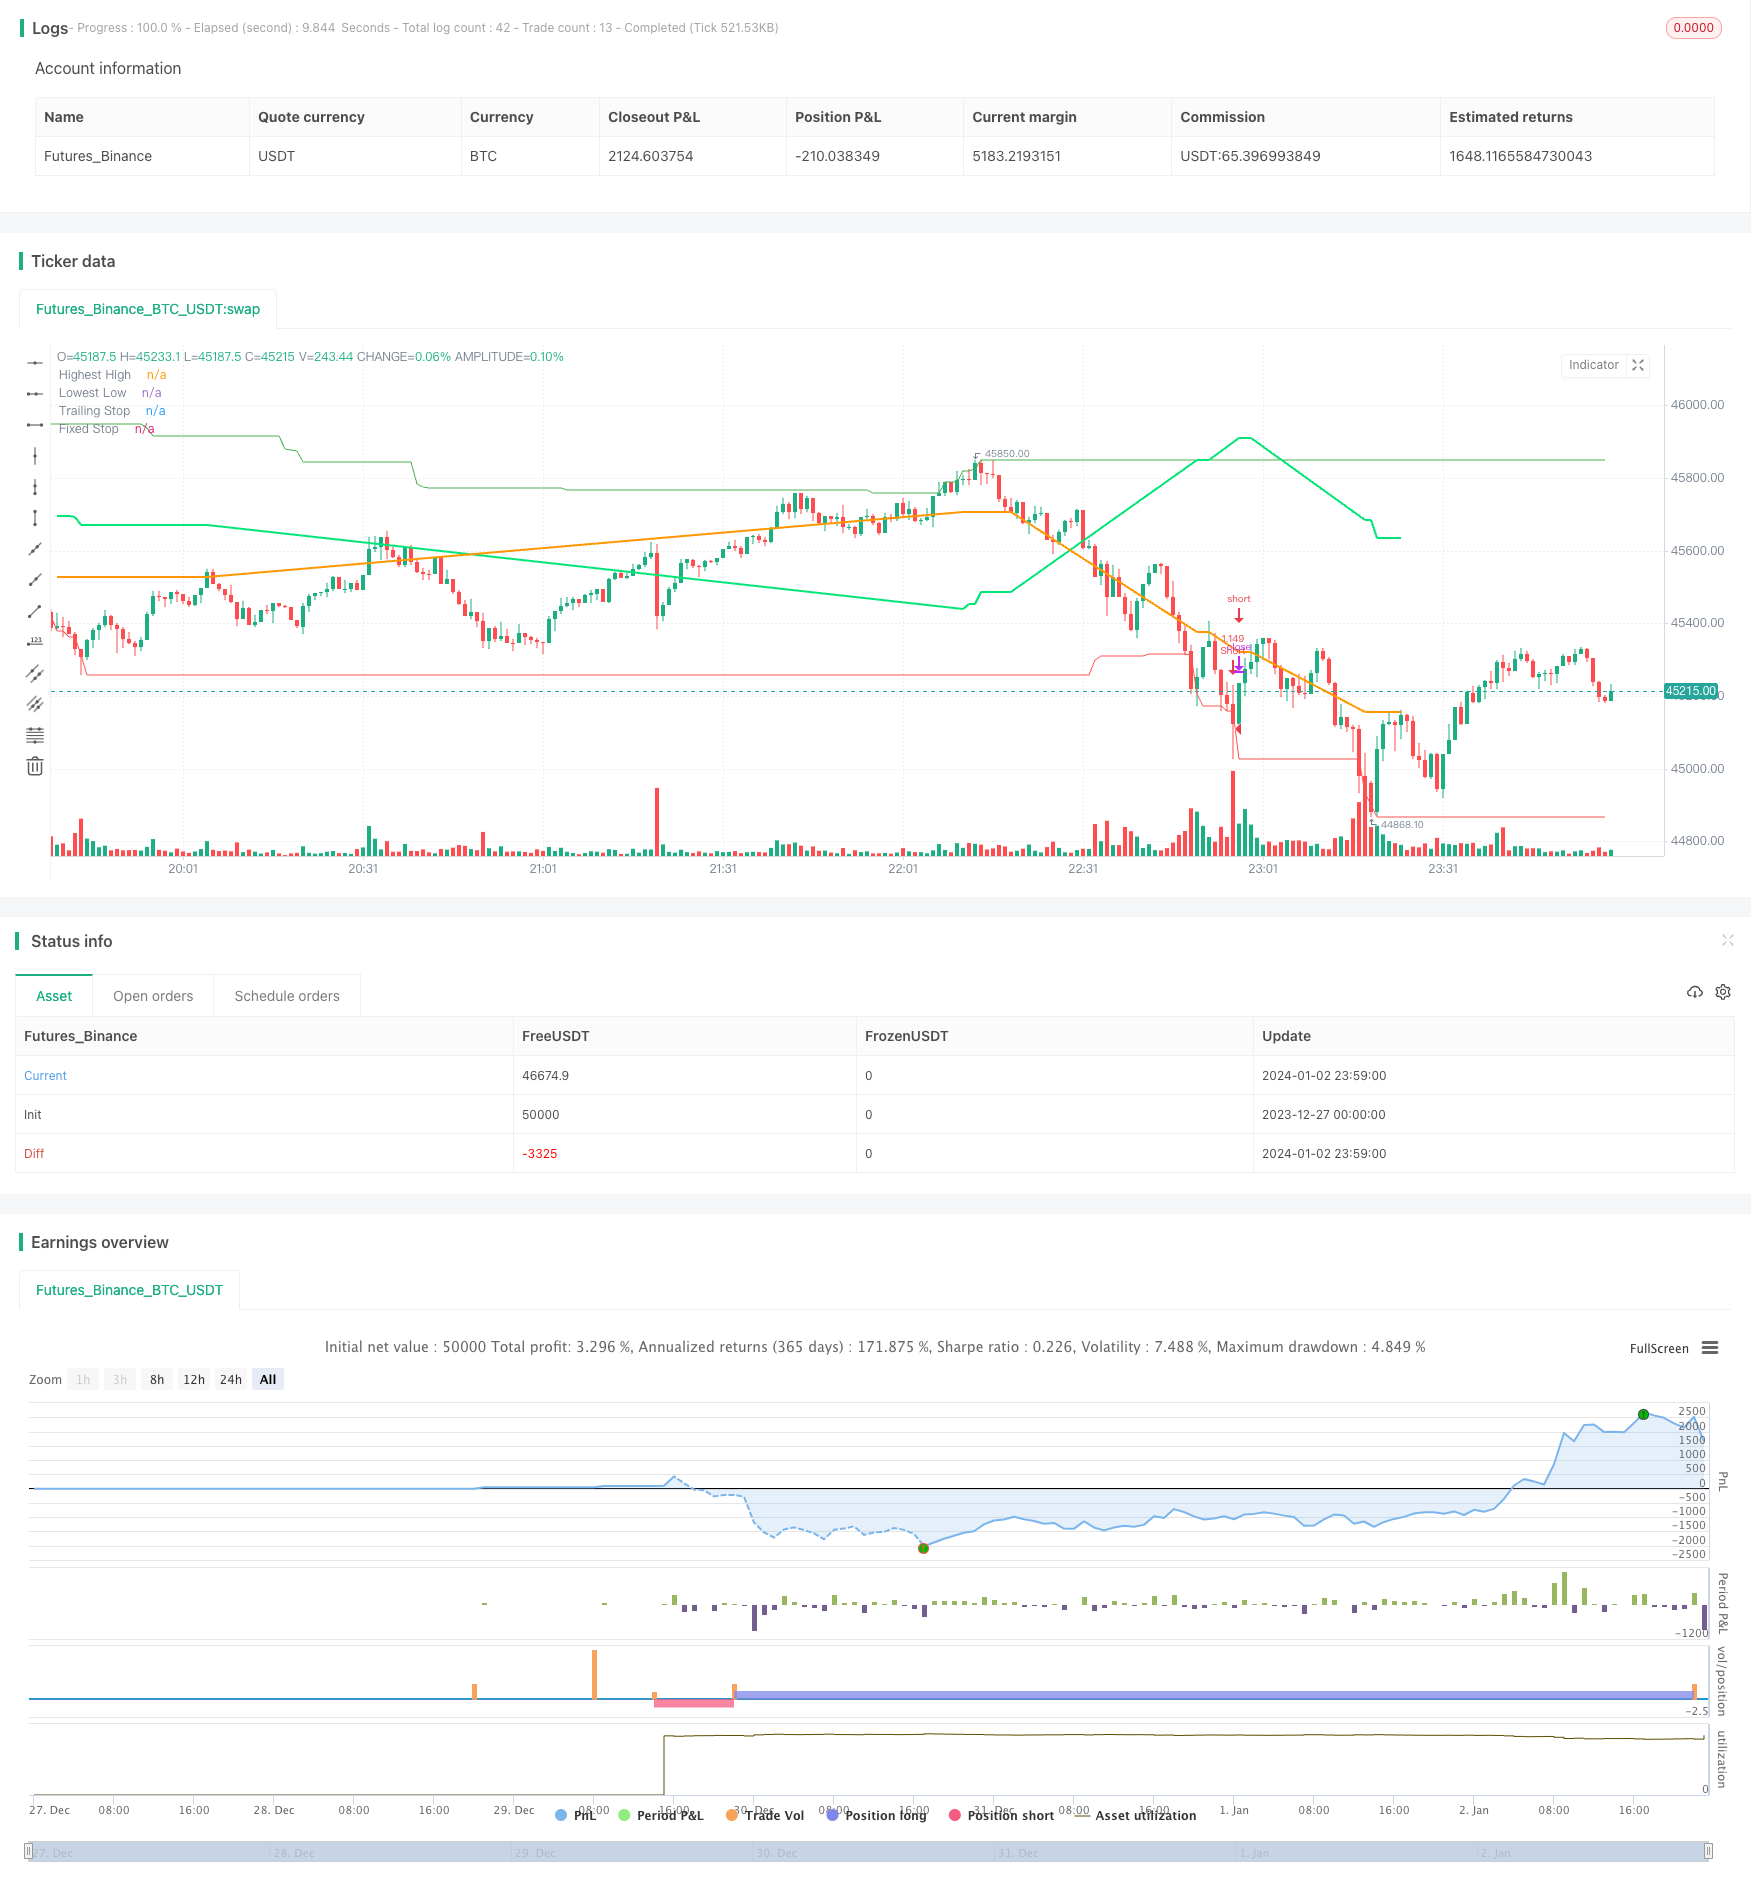
/*backtest
start: 2023-12-27 00:00:00
end: 2024-01-03 00:00:00
period: 1m
basePeriod: 1m
exchanges: [{"eid":"Futures_Binance","currency":"BTC_USDT"}]
*/

// This source code is subject to the terms of the Mozilla Public License 2.0 at https://mozilla.org/MPL/2.0/
// © myn

//@version=5
strategy('Strategy Myth-Busting #8 - TrendSurfers+TrendOsc - [MYN]', max_bars_back=5000, overlay=true, pyramiding=0, initial_capital=20000, currency='USD', default_qty_type=strategy.percent_of_equity, default_qty_value=100.0, commission_value=0.075, use_bar_magnifier = false)

/////////////////////////////////////
//* Put your strategy logic below *//
/////////////////////////////////////
//cAe9It4ynO4


// Strategies
// Trend Surfers - Premium Indicator
// Mawreez' Trend Oscillator Indicator

// Trading Setup / Rules


// Long Condition
// Trend Surfers Trailing stop line goes below (Crosses) lowest low
// Bullish Candle (red)
// Mawreeze Trend Oscilator Indicator is green


// Short Condition

// Trend Surfers Trailing stop line goes above (Crosses) highest high
// Bearish Candle (red)
// Mawreeze Trend Oscilator Indicator is red

// Stop loss middle between high and low Risk 1:2


//@version=5
//strategy(shorttitle='Trend Surfers - Breakout', title='Trend Surfers - Premium Breakout', overlay=true, calc_on_every_tick=false, initial_capital=100000, default_qty_type=strategy.percent_of_equity, default_qty_value=100, commission_type='percent', commission_value=0.04)

// Risk for position and pyramid
maxriskval = input.float(2, 'Max % risk', tooltip='Risk % over total equity / Position', group='Risk Management')
pairnumber = input.int(title='How many pairs', defval=1, tooltip='How many pairs are you trading with the strategy?', group='Risk Management')

// Emtry Exit
highPeriod = input.int(title='Highest High Period', defval=168, tooltip='Highest High of X bars - This will trigger a Long Entry when close is above. (Thin Green Line)', group='Entry Condition')
lowPeriod = input.int(title='Lowest Low Period', defval=168, tooltip='Lowest low of X bars - This will trigger a Short Entry when close is under. (Thin Red Line)', group='Entry Condition')
// Stoploss
trailingAtrPeriod = input.int(title='Trailing ATR Pediod', defval=10, tooltip='Average True Range for the Trailing Stop. (Thick Green Line) ', group='Exit Condition')
trailingAtrMultiplier = input.float(title='Trailing ATR Multiplier', defval=8, group='Exit Condition')
fixAtrPeriod = input.int(title='Fix ATR Pediod', defval=10, tooltip='Average True Range for the Fix Stoloss. (Thick Yellow Line)', group='Exit Condition')
fixAtrMultiplier = input.float(title='Fix ATR Multiplier', defval=2, group='Exit Condition')
// Pair info
pair = syminfo.basecurrency + syminfo.currency

// High Low Variable
highestHigh = ta.highest(high, highPeriod)[1]
lowestLow = ta.lowest(low, lowPeriod)[1]
trailingAtr = ta.atr(trailingAtrPeriod) * trailingAtrMultiplier

// Trade Condition
longConditionTrendSurfers = ta.crossover(close, highestHigh)
shortConditionTrendSurfers = ta.crossunder(close, lowestLow)

// Risk Variable
fixAtr = ta.atr(fixAtrPeriod) * fixAtrMultiplier
stopvaluelong = close[1] - fixAtr[1]
stopvalueshort = close[1] + fixAtr[1]

// Position size Long
maxpossize = strategy.equity / close
positionsizelong = maxriskval / 100 * strategy.equity / (close - stopvaluelong)
stopperclong = (close - stopvaluelong) / close * 100
leveragelong = math.max(1, math.ceil(positionsizelong / maxpossize)) * 2
posperclong = positionsizelong * close / strategy.equity * 100 / leveragelong / pairnumber
realposlong = posperclong / 100 * strategy.equity * leveragelong / close

// Position size Short
positionsizeshort = maxriskval / 100 * strategy.equity / (stopvalueshort - close)
stoppercshort = (close - stopvalueshort) / close * 100
leverageshort = math.max(1, math.ceil(positionsizeshort / maxpossize)) * 2
pospercshort = positionsizeshort * close / strategy.equity * 100 / leverageshort / pairnumber
realposshort = pospercshort / 100 * strategy.equity * leverageshort / close

// Alert Message
entry_long_message = '\nGo Long for ' + pair + 'NOW!' + '\nPosition Size % =' + str.tostring(posperclong) + '\nLeverage' + str.tostring(leveragelong) + '\nStoploss Price =' + str.tostring(stopvaluelong) + '\nClose any Short position that are open for ' + pair + '!' + '\n\nVisit TrendSurfersSignals.com' + '\nFor automated premium signals (FREE)'

entry_short_message = '\nGo Short for ' + pair + 'NOW!' + '\nPosition Size % =' + str.tostring(pospercshort) + '\nLeverage' + str.tostring(leverageshort) + '\nStoploss Price =' + str.tostring(stopvalueshort) + '\nClose any Long position that are open for ' + pair + '!' + '\n\nVisit TrendSurfersSignals.com' + '\nFor automated premium signals (FREE)'

exit_short_message = '\nExit Short for ' + pair + 'NOW!' + '\n\nVisit TrendSurfersSignals.com' + '\nFor automated premium signals (FREE)'

exit_long_message = '\nExit Long for ' + pair + 'NOW!' + '\n\nVisit TrendSurfersSignals.com' + '\nFor automated premium signals (FREE)'
// Order
// if longCondition
//     strategy.entry('Long', strategy.long, stop=highestHigh, comment='Long', qty=realposlong, alert_message=entry_long_message)
// if shortCondition
//     strategy.entry('Short', strategy.short, stop=lowestLow, comment='Short', qty=realposshort, alert_message=entry_short_message)

// Stoploss Trailing
longTrailing = close - trailingAtr
shortTrailing = close + trailingAtr

var longTrailingStop = 0.0
var shortTrailingStop = 999999.9

trailingStopLine = 0.0
trailingStopLine := na
fixedStopLine = 0.0
fixedStopLine := na
var inTrade = 0
if longConditionTrendSurfers or shortConditionTrendSurfers
    if 0 == inTrade
        if longConditionTrendSurfers
            inTrade := 1
            inTrade
        else
            inTrade := -1
            inTrade
if 1 == inTrade and (shortConditionTrendSurfers or low <= math.max(fixedStopLine[1], longTrailingStop))
    inTrade := 0
    inTrade
if -1 == inTrade and (longConditionTrendSurfers or high >= math.min(fixedStopLine[1], shortTrailingStop))
    inTrade := 0
    inTrade

longTrailingStop := if 1 == inTrade
    stopValue = longTrailing
    math.max(stopValue, longTrailingStop[1])
else
    0

shortTrailingStop := if -1 == inTrade
    stopValue = shortTrailing
    math.min(stopValue, shortTrailingStop[1])
else
    999999

// Fix Stoploss
firstPrice = 0.0
firstFixAtr = 0.0
firstPrice := na
firstFixAtr := na
if 0 != inTrade
    firstPrice := ta.valuewhen(inTrade != inTrade[1] and 0 != inTrade, close, 0)
    firstFixAtr := ta.valuewhen(inTrade != inTrade[1] and 0 != inTrade, fixAtr, 0)
    if 1 == inTrade
        fixedStopLine := firstPrice - firstFixAtr
        trailingStopLine := longTrailingStop
        trailingStopLine
    else
        fixedStopLine := firstPrice + firstFixAtr
        trailingStopLine := shortTrailingStop
        trailingStopLine

// if strategy.position_size > 0
//     strategy.exit(id='L Stop', stop=math.max(fixedStopLine, longTrailingStop), alert_message=exit_long_message)

// if strategy.position_size < 0
//     strategy.exit(id='S Stop', stop=math.min(fixedStopLine, shortTrailingStop), alert_message=exit_short_message)


// Plot
plot(highestHigh, color=color.new(color.green, 0), linewidth=1, title='Highest High')
plot(lowestLow, color=color.new(color.red, 0), linewidth=1, title='Lowest Low')
plot(trailingStopLine, color=color.new(color.lime, 0), linewidth=2, offset=1, title='Trailing Stop')
plot(fixedStopLine, color=color.new(color.orange, 0), linewidth=2, offset=1, title='Fixed Stop')

// Trend Surfers Trailing stop line goes above (Crossesover) highest high
// Bearish Candle (red)
// Mawreeze Trend Oscilator Indicator is red

trendSurfersShortEntry = trailingStopLine > highestHigh and close < close[1]
trendSurfersLongEntry = trailingStopLine < lowestLow and close > close[1]


//@version=5

// Taken from the TradingView house rules regarding scripts:

// "All open source scripts that do not mention a specific open source license
// in their comments are licensed under the Mozilla Public License 2.0.
// Following the Mozilla License, any script reusing open source code originally
// published by someone else must also be open source, unless specific
// permission is granted by the original author."

//indicator('Mawreez\' Trend Oscillator', precision=3)

len = input.int(title='DI Length', minval=1, defval=14)
sens = input.float(title='Sensitivity', defval=25)

// Lag-free smoothing of a given series
smooth(series, len) =>
    f28 = ta.ema(series, len)
    f30 = ta.ema(f28, len)
    vC = f28 * 1.5 - f30 * 0.5
    f38 = ta.ema(vC, len)
    f40 = ta.ema(f38, len)
    v10 = f38 * 1.5 - f40 * 0.5
    f48 = ta.ema(v10, len)
    f50 = ta.ema(f48, len)
    f48 * 1.5 - f50 * 0.5

// Constructing the +DI and -DI
up = ta.change(high)
down = -ta.change(low)
plus_dm = up > 0 and up > down ? up : 0
minus_dm = down > 0 and down > up ? down : 0
range_1 = ta.rma(ta.tr, len)
plus_di = smooth(ta.rma(plus_dm, len) / range_1, 3)
minus_di = smooth(ta.rma(minus_dm, len) / range_1, 3)

// Constructing and plotting the modified ADX
adj_adx = 100 * math.abs(plus_di - minus_di) / (plus_di + minus_di) - sens
adj_adx := (minus_di > plus_di ? -1 : 1) * (adj_adx < 0 ? 0 : adj_adx)
//plot(smooth(adj_adx, 3), color=plus_di > minus_di ? color.green : color.red, style=plot.style_columns)

trendOscShortEntry = plus_di < minus_di
trendOscLongEntry = plus_di > minus_di


//////////////////////////////////////
//* Put your strategy rules below *//
/////////////////////////////////////

longCondition = trendSurfersLongEntry and trendOscLongEntry
shortCondition = trendSurfersShortEntry and trendOscShortEntry

//define as 0 if do not want to use
closeLongCondition = 0
closeShortCondition = 0


// ADX
//░░░░░░░░░░░░░░░░░░░░░░░░░░░░░░░░░░░░░░░░░░░░░░░░░░░░░░░░░░░░░░░░░░░░░░░░░░░░░░░░░░░░░░░░░░░░░░░░░░░░░░░░░░░░░░░░░░░░░░░░░░░░░░░░░░░░░░░░░░░░░░░░░░

adxEnabled = input.bool(defval = false , title = "Average Directional Index (ADX)", tooltip = "", group ="ADX" )
adxlen = input(14, title="ADX Smoothing", group="ADX")
adxdilen = input(14, title="DI Length", group="ADX")
adxabove = input(25, title="ADX Threshold", group="ADX")

adxdirmov(len) =>
	adxup = ta.change(high)
	adxdown = -ta.change(low)
	adxplusDM = na(adxup) ? na : (adxup > adxdown and adxup > 0 ? adxup : 0)
	adxminusDM = na(adxdown) ? na : (adxdown > adxup and adxdown > 0 ? adxdown : 0)
	adxtruerange = ta.rma(ta.tr, len)
	adxplus = fixnan(100 * ta.rma(adxplusDM, len) / adxtruerange)
	adxminus = fixnan(100 * ta.rma(adxminusDM, len) / adxtruerange)
	[adxplus, adxminus]
adx(adxdilen, adxlen) =>
	[adxplus, adxminus] = adxdirmov(adxdilen)
	adxsum = adxplus + adxminus
	adx = 100 * ta.rma(math.abs(adxplus - adxminus) / (adxsum == 0 ? 1 : adxsum), adxlen)

adxsig = adxEnabled ? adx(adxdilen, adxlen) : na
isADXEnabledAndAboveThreshold = adxEnabled ? (adxsig > adxabove) : true

//Backtesting Time Period (Input.time not working as expected as of 03/30/2021.  Giving odd start/end dates
//░░░░░░░░░░░░░░░░░░░░░░░░░░░░░░░░░░░░░░░░░░░░░░░░░░░░░░░░░░░░░░░░░░░░░░░░░░░░░░░░░░░░░░░░░░░░░░░░░░░░░░░░░░░░░░░░░░░░░░░░░░░░░░░░░░░░░░░░░░░░░░░░░░
useStartPeriodTime = input.bool(true, 'Start', group='Date Range', inline='Start Period')
startPeriodTime = input(timestamp('1 Jan 2019'), '', group='Date Range', inline='Start Period')
useEndPeriodTime = input.bool(true, 'End', group='Date Range', inline='End Period')
endPeriodTime = input(timestamp('31 Dec 2030'), '', group='Date Range', inline='End Period')

start = useStartPeriodTime ? startPeriodTime >= time : false
end = useEndPeriodTime ? endPeriodTime <= time : false
calcPeriod = true

// Trade Direction
// ░░░░░░░░░░░░░░░░░░░░░░░░░░░░░░░░░░░░░░░░░░░░░░░░░░░░░░░░░░░░░░░░░░░░░░░░░░░░░░░░░░░░░░░░░░░░░░░░░░░░░░░░░░░░░░░░░░░░░░░░░░░░░░░░░░░░░░░░░░░░░░░░░░
tradeDirection = input.string('Long and Short', title='Trade Direction', options=['Long and Short', 'Long Only', 'Short Only'], group='Trade Direction')

// Percent as Points
// ░░░░░░░░░░░░░░░░░░░░░░░░░░░░░░░░░░░░░░░░░░░░░░░░░░░░░░░░░░░░░░░░░░░░░░░░░░░░░░░░░░░░░░░░░░░░░░░░░░░░░░░░░░░░░░░░░░░░░░░░░░░░░░░░░░░░░░░░░░░░░░░░░░
per(pcnt) =>
    strategy.position_size != 0 ? math.round(pcnt / 100 * strategy.position_avg_price / syminfo.mintick) : float(na)

// Take profit 1
// ░░░░░░░░░░░░░░░░░░░░░░░░░░░░░░░░░░░░░░░░░░░░░░░░░░░░░░░░░░░░░░░░░░░░░░░░░░░░░░░░░░░░░░░░░░░░░░░░░░░░░░░░░░░░░░░░░░░░░░░░░░░░░░░░░░░░░░░░░░░░░░░░░░
tp1 = input.float(title='Take Profit 1 - Target %', defval=100, minval=0.0, step=0.5, group='Take Profit', inline='Take Profit 1')
q1 = input.int(title='% Of Position', defval=100, minval=0, group='Take Profit', inline='Take Profit 1')

// Take profit 2
// ░░░░░░░░░░░░░░░░░░░░░░░░░░░░░░░░░░░░░░░░░░░░░░░░░░░░░░░░░░░░░░░░░░░░░░░░░░░░░░░░░░░░░░░░░░░░░░░░░░░░░░░░░░░░░░░░░░░░░░░░░░░░░░░░░░░░░░░░░░░░░░░░░░
tp2 = input.float(title='Take Profit 2 - Target %', defval=100, minval=0.0, step=0.5, group='Take Profit', inline='Take Profit 2')
q2 = input.int(title='% Of Position', defval=100, minval=0, group='Take Profit', inline='Take Profit 2')

// Take profit 3
// ░░░░░░░░░░░░░░░░░░░░░░░░░░░░░░░░░░░░░░░░░░░░░░░░░░░░░░░░░░░░░░░░░░░░░░░░░░░░░░░░░░░░░░░░░░░░░░░░░░░░░░░░░░░░░░░░░░░░░░░░░░░░░░░░░░░░░░░░░░░░░░░░░░
tp3 = input.float(title='Take Profit 3 - Target %', defval=100, minval=0.0, step=0.5, group='Take Profit', inline='Take Profit 3')
q3 = input.int(title='% Of Position', defval=100, minval=0, group='Take Profit', inline='Take Profit 3')

// Take profit 4
// ░░░░░░░░░░░░░░░░░░░░░░░░░░░░░░░░░░░░░░░░░░░░░░░░░░░░░░░░░░░░░░░░░░░░░░░░░░░░░░░░░░░░░░░░░░░░░░░░░░░░░░░░░░░░░░░░░░░░░░░░░░░░░░░░░░░░░░░░░░░░░░░░░░
tp4 = input.float(title='Take Profit 4 - Target %', defval=100, minval=0.0, step=0.5, group='Take Profit')

/// Stop Loss
// ░░░░░░░░░░░░░░░░░░░░░░░░░░░░░░░░░░░░░░░░░░░░░░░░░░░░░░░░░░░░░░░░░░░░░░░░░░░░░░░░░░░░░░░░░░░░░░░░░░░░░░░░░░░░░░░░░░░░░░░░░░░░░░░░░░░░░░░░░░░░░░░░░░
stoplossPercent = input.float(title='Stop Loss (%)', defval=999, minval=0.01, group='Stop Loss') * 0.01
slLongClose = close < strategy.position_avg_price * (1 - stoplossPercent)
slShortClose = close > strategy.position_avg_price * (1 + stoplossPercent)

/// Leverage
// ░░░░░░░░░░░░░░░░░░░░░░░░░░░░░░░░░░░░░░░░░░░░░░░░░░░░░░░░░░░░░░░░░░░░░░░░░░░░░░░░░░░░░░░░░░░░░░░░░░░░░░░░░░░░░░░░░░░░░░░░░░░░░░░░░░░░░░░░░░░░░░░░░░
leverage = input.float(1, 'Leverage', step=.5, group='Leverage')
contracts = math.min(math.max(.000001, strategy.equity / close * leverage), 1000000000)


/// Trade State Management
// ░░░░░░░░░░░░░░░░░░░░░░░░░░░░░░░░░░░░░░░░░░░░░░░░░░░░░░░░░░░░░░░░░░░░░░░░░░░░░░░░░░░░░░░░░░░░░░░░░░░░░░░░░░░░░░░░░░░░░░░░░░░░░░░░░░░░░░░░░░░░░░░░░░

isInLongPosition = strategy.position_size > 0
isInShortPosition = strategy.position_size < 0

/// ProfitView Alert Syntax String Generation
// ░░░░░░░░░░░░░░░░░░░░░░░░░░░░░░░░░░░░░░░░░░░░░░░░░░░░░░░░░░░░░░░░░░░░░░░░░░░░░░░░░░░░░░░░░░░░░░░░░░░░░░░░░░░░░░░░░░░░░░░░░░░░░░░░░░░░░░░░░░░░░░░░░░

alertSyntaxPrefix = input.string(defval='CRYPTANEX_99FTX_Strategy-Name-Here', title='Alert Syntax Prefix', group='ProfitView Alert Syntax')
alertSyntaxBase = alertSyntaxPrefix + '\n#' + str.tostring(open) + ',' + str.tostring(high) + ',' + str.tostring(low) + ',' + str.tostring(close) + ',' + str.tostring(volume) + ','


/// Trade Execution
// ░░░░░░░░░░░░░░░░░░░░░░░░░░░░░░░░░░░░░░░░░░░░░░░░░░░░░░░░░░░░░░░░░░░░░░░░░░░░░░░░░░░░░░░░░░░░░░░░░░░░░░░░░░░░░░░░░░░░░░░░░░░░░░░░░░░░░░░░░░░░░░░░░░

longConditionCalc = (longCondition and isADXEnabledAndAboveThreshold)
shortConditionCalc = (shortCondition and isADXEnabledAndAboveThreshold)

if calcPeriod
    if longConditionCalc and tradeDirection != 'Short Only' and isInLongPosition == false
        strategy.entry('Long', strategy.long, qty=contracts)

        alert(message=alertSyntaxBase + 'side:long', freq=alert.freq_once_per_bar_close)

    if shortConditionCalc and tradeDirection != 'Long Only' and isInShortPosition == false
        strategy.entry('Short', strategy.short, qty=contracts)

        alert(message=alertSyntaxBase + 'side:short', freq=alert.freq_once_per_bar_close)

    //Inspired from Multiple %% profit exits example by adolgo https://www.tradingview.com/script/kHhCik9f-Multiple-profit-exits-example/
    strategy.exit('TP1', qty_percent=q1, profit=per(tp1))
    strategy.exit('TP2', qty_percent=q2, profit=per(tp2))
    strategy.exit('TP3', qty_percent=q3, profit=per(tp3))
    strategy.exit('TP4', profit=per(tp4))

    strategy.close('Long', qty_percent=100, comment='SL Long', when=slLongClose)
    strategy.close('Short', qty_percent=100, comment='SL Short', when=slShortClose)

    strategy.close_all(when=closeLongCondition or closeShortCondition, comment='Close Postion')

/// Dashboard
// ░░░░░░░░░░░░░░░░░░░░░░░░░░░░░░░░░░░░░░░░░░░░░░░░░░░░░░░░░░░░░░░░░░░░░░░░░░░░░░░░░░░░░░░░░░░░░░░░░░░░░░░░░░░░░░░░░░░░░░░░░░░░░░░░░░░░░░░░░░░░░░░░░░
// Inspired by https://www.tradingview.com/script/uWqKX6A2/ - Thanks VertMT

showDashboard = input.bool(group="Dashboard", title="Show Dashboard", defval=false)

f_fillCell(_table, _column, _row, _title, _value, _bgcolor, _txtcolor) =>
    _cellText = _title + "\n" + _value
    table.cell(_table, _column, _row, _cellText, bgcolor=_bgcolor, text_color=_txtcolor, text_size=size.auto)

// Draw dashboard table
if showDashboard
    var bgcolor = color.new(color.black,0)

    // Keep track of Wins/Losses streaks
    newWin  = (strategy.wintrades  > strategy.wintrades[1]) and (strategy.losstrades == strategy.losstrades[1]) and (strategy.eventrades == strategy.eventrades[1])
    newLoss = (strategy.wintrades == strategy.wintrades[1]) and (strategy.losstrades  > strategy.losstrades[1]) and (strategy.eventrades == strategy.eventrades[1])

    varip int winRow     = 0
    varip int lossRow    = 0
    varip int maxWinRow  = 0
    varip int maxLossRow = 0

    if newWin
        lossRow := 0
        winRow := winRow + 1
    if winRow > maxWinRow
        maxWinRow := winRow

    if newLoss
        winRow := 0
        lossRow := lossRow + 1
    if lossRow > maxLossRow
        maxLossRow := lossRow


    // Prepare stats table
    var table dashTable = table.new(position.bottom_right, 1, 15, border_width=1)


    if barstate.islastconfirmedhistory
        // Update table
        dollarReturn = strategy.netprofit
        f_fillCell(dashTable, 0, 0, "Start:", str.format("{0,date,long}", strategy.closedtrades.entry_time(0)) , bgcolor, color.white) // + str.format(" {0,time,HH:mm}", strategy.closedtrades.entry_time(0))
        f_fillCell(dashTable, 0, 1, "End:", str.format("{0,date,long}", strategy.opentrades.entry_time(0)) , bgcolor, color.white) // + str.format(" {0,time,HH:mm}", strategy.opentrades.entry_time(0))
        _profit = (strategy.netprofit / strategy.initial_capital) * 100
        f_fillCell(dashTable, 0, 2, "Net Profit:", str.tostring(_profit, '##.##') + "%", _profit > 0 ? color.green : color.red, color.white)
        _numOfDaysInStrategy = (strategy.opentrades.entry_time(0) - strategy.closedtrades.entry_time(0)) / (1000 * 3600 * 24)
        f_fillCell(dashTable, 0, 3, "Percent Per Day", str.tostring(_profit / _numOfDaysInStrategy, '#########################.#####')+"%", _profit > 0 ? color.green : color.red, color.white)
        _winRate = ( strategy.wintrades / strategy.closedtrades ) * 100
        f_fillCell(dashTable, 0, 4, "Percent Profitable:", str.tostring(_winRate, '##.##') + "%", _winRate < 50 ? color.red : _winRate < 75 ? #999900 : color.green, color.white)
        f_fillCell(dashTable, 0, 5, "Profit Factor:", str.tostring(strategy.grossprofit / strategy.grossloss,  '##.###'), strategy.grossprofit > strategy.grossloss ? color.green : color.red, color.white)
        f_fillCell(dashTable, 0, 6, "Total Trades:", str.tostring(strategy.closedtrades), bgcolor, color.white)
        f_fillCell(dashTable, 0, 8, "Max Wins In A Row:", str.tostring(maxWinRow, '######') , bgcolor, color.white)
        f_fillCell(dashTable, 0, 9, "Max Losses In A Row:", str.tostring(maxLossRow, '######') , bgcolor, color.white)