SSL پر مبنی حکمت عملی کے بعد اوسط رجحان کو منتقل کرنا
جائزہ
یہ حکمت عملی ایک ایسی حکمت عملی ہے جس میں ایس ایس ایل چینل کے اشارے کا استعمال کرکے مارکیٹ کے رجحانات کا اندازہ لگایا جاتا ہے اور اس کی بنیاد پر مساوی لائن پر رجحانات کی پیروی کی جاتی ہے۔ یہ درمیانی لمبی لائن پر 4 گھنٹے کی لائن اور دن کی لائن پر لاگو ہوتا ہے۔
حکمت عملی کا اصول
ایس ایس ایل چینل کرٹ اوسط لائن اور حقیقی طول و عرض سے بنا ہے۔ یہ مارکیٹ کے رجحان کی سمت کا فیصلہ کرسکتا ہے۔ جب قیمت ٹریک کو توڑتی ہے تو یہ ایک bullish سگنل ہوتا ہے ، اور جب قیمت ٹریک کو توڑتی ہے تو یہ ایک bearish سگنل ہوتا ہے۔
حکمت عملی ای ایم اے جیسے اوسط لائن کے اشارے کا استعمال کرتے ہوئے ایک بیس لائن اوسط لائن کا حساب لگاتی ہے۔ اس اوسط لائن سے کچھ جھوٹے ٹوٹ پھوٹ کو فلٹر کیا جاسکتا ہے۔
حکمت عملی اس وقت زیادہ کام کرتی ہے جب قیمت ایس ایس ایل کے اوپری ٹریک لائن کو توڑ دیتی ہے ، اور جب قیمت ایس ایس ایل کے نچلے ٹریک لائن کو توڑ دیتی ہے تو اس میں کمی کردی جاتی ہے۔
اسٹاپ نقصان کا طریقہ فیصد اسٹاپ ، اے ٹی آر اسٹاپ اور کم سے کم قیمت / زیادہ سے زیادہ قیمت اسٹاپ کو دوبارہ دیکھنا ہے۔ اسٹاپ اسٹاپ N گنا ہے۔ صارف کے ذریعہ مخصوص پیرامیٹرز طے کیے گئے ہیں۔
طاقت کا تجزیہ
ایس ایس ایل چینل رجحان کی سمت کا تعین کرنے کے لئے درست ہے ، جعلی سگنل کو کم کرتا ہے۔ مارکیٹ میں داخلے کی بنیاد پر یکساں لائن کے ساتھ تعاون ، اور نیچے کی طرف سے ٹکرانے سے بچنے کے لئے۔
مختلف قسم کی اوسط لائنوں کے لچکدار انتخاب ، جو مارکیٹ کے وسیع تر حالات کے مطابق ہیں۔
اسٹاپ نقصان کے لچکدار اور کنٹرول کرنے کے قابل خطرات ہیں۔ اسٹاپ ضرب کو بھی مختلف ترجیحات کے مطابق لچکدار طریقے سے ترتیب دیا جاسکتا ہے۔
اس کے علاوہ، آپ کو ایک ہی وقت میں زیادہ سے زیادہ کام کرنے کی اجازت دی جاسکتی ہے تاکہ مارکیٹ میں دو طرفہ مواقع کا فائدہ اٹھایا جاسکے۔
خطرے کا تجزیہ
اوسط لائن کے اشارے میں تاخیر ہے ، جس سے نقصانات میں اضافے کا خطرہ ہے۔
زلزلے کی صورت حال میں ٹریک کو توڑنے کے بعد ہی اس میں ردوبدل ہوتا ہے اور اسے آسانی سے پکڑ لیا جاسکتا ہے۔
اے ٹی آر اور ریورس اسٹاپ نقصان غیر معمولی توڑ کے دوران بہت زیادہ نرمی کا شکار ہوسکتا ہے ، جس سے نقصان میں اضافہ ہوتا ہے۔
خطرے سے نمٹنے کے اقدامات:
- مناسب طریقے سے میڈین لائن پیرامیٹرز کو ایڈجسٹ کریں ، یا دوسری قسم کی میڈین لائن کا انتخاب کریں۔
- اسٹاپ نقصان کو بڑھانا اور اسے وقت پر روکنا۔
- اے ٹی آر میں ضرب عنصر شامل کریں ، یا نظر ثانی کے دورانیے کو ایڈجسٹ کریں۔
اصلاح کی سمت
- زیادہ اقسام کی اوسط لکیری کی جانچ پڑتال کریں اور بہترین پیرامیٹرز تلاش کریں۔
- اے ٹی آر سائیکل پیرامیٹرز کو روکنے کے لئے بہتر بنائیں۔
- مختلف سٹاپ نقصان ضارب پیرامیٹرز کی جانچ پڑتال کریں.
- مختلف روک تھام کے خطرے کے عوامل کی جانچ پڑتال کریں.
خلاصہ کریں۔
اس حکمت عملی میں ایس ایس ایل کا استعمال کرتے ہوئے رجحانات کا اندازہ لگانے اور مساوی اشارے کی تصدیق کی جاتی ہے ، جس سے رجحانات کو مؤثر طریقے سے پیروی کی جاسکتی ہے۔ یہ لچکدار رکاوٹ اور روک تھام کا طریقہ مہیا کرتا ہے ، جو خطرے کو کنٹرول کرتے ہوئے زیادہ منافع حاصل کرتا ہے۔ پیرامیٹرز کی مسلسل جانچ اور اصلاح کے ذریعہ ، بہتر تجارتی کارکردگی حاصل کی جاسکتی ہے۔ یہ ایک مؤثر حکمت عملی ہے جو طویل مدتی ٹریکنگ اور استعمال میں آنے کے قابل ہے۔
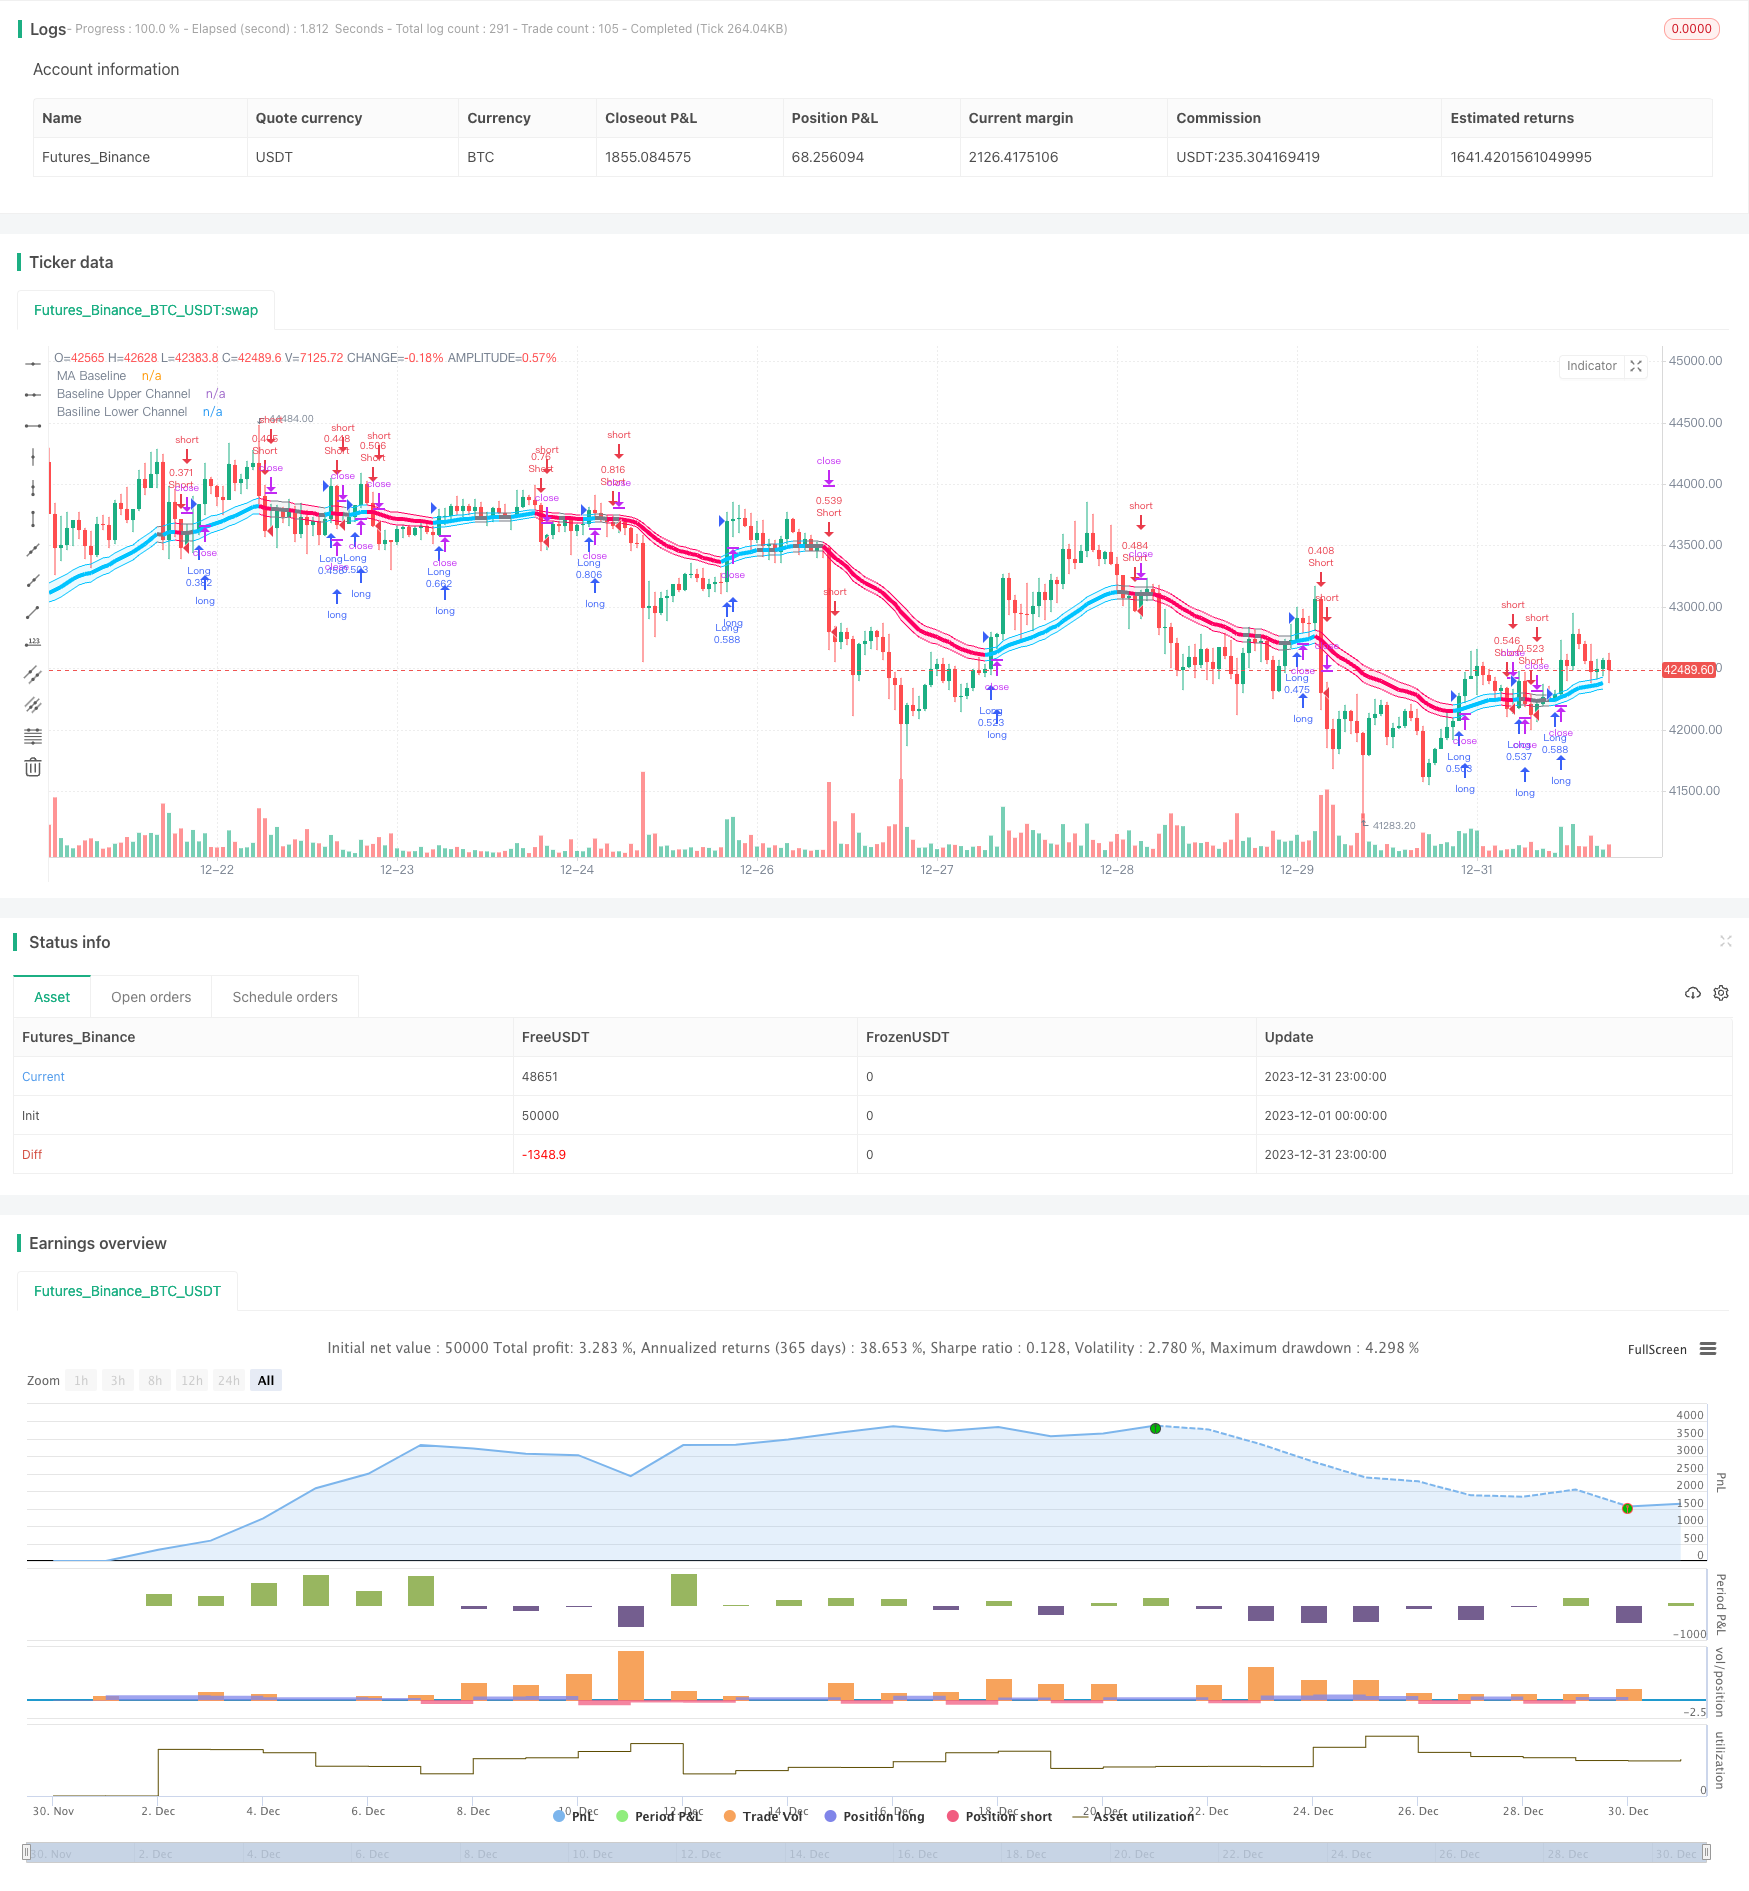
/*backtest
start: 2023-12-01 00:00:00
end: 2023-12-31 23:59:59
period: 1h
basePeriod: 15m
exchanges: [{"eid":"Futures_Binance","currency":"BTC_USDT"}]
*/

// This source code is subject to the terms of the Mozilla Public License 2.0 at https://mozilla.org/MPL/2.0/
// Thanks to @kevinmck100 for opensource strategy template and @Mihkel00 for SSL Hybrid
// @fpemehd
// @version=5
strategy(title = '[fpemehd] SSL Baseline Strategy',
      shorttitle = '[f] SSL',
      overlay = true)

// # ========================================================================= #
// #                                Inputs
// # ========================================================================= #

// 1. Time
i_start                 = input (defval = timestamp("20 Jan 1990 00:00 +0900"), title = "Start Date", tooltip = "Choose Backtest Start Date", inline = "Start Date", group = "Time" )
i_end                   = input (defval = timestamp("20 Dec 2030 00:00 +0900"), title = "End Date", tooltip = "Choose Backtest End Date", inline = "End Date", group = "Time" )
inDateRange             = true


// 2. Inputs for direction: Long? Short? Both?
// i_longEnabled           = input.bool(defval = true , title = "Long?", tooltip = "Enable Long Position Trade?", inline = "1", group = "Long / Short" )
// i_shortEnabled          = input.bool(defval = true , title = "Short?", tooltip = "Enable Short Position Trade?", inline = "1", group = "Long / Short" )

// 3. Shared inputs for Long and Short
//// 3-1. Inputs for Stop Loss Type: ATR or Percent?
i_slType                = input.string (defval = "ATR", title = "SL Type ", group = "Strategy: Stop Loss Conditions", options = ["Percent", "ATR", "Previous LL / HH"], tooltip = "Stop Loss based on %? ATR?", inline = "1")
i_slPercent             = input.float (defval = 3, title = "SL % ",             group = "Strategy: Stop Loss Conditions", inline = "2")
i_slAtrLength           = input.int (14, "SL ATR Length ",                      group = "Strategy: Stop Loss Conditions", inline = "3", minval = 0, maxval = 10000)
i_slAtrMultiplier       = input.float (4,    "SL ATR Multiplier",               group = "Strategy: Stop Loss Conditions",    inline = "3", minval = 0, step = 0.1,     tooltip = "Length of ATR used to calculate Stop Loss. \nSize of StopLoss is determined by multiplication of ATR value. Take Profit is derived from this also by multiplying the StopLoss value by the Risk:Reward multiplier.")
i_slLookBack            = input.int(30,   "Lowest Price Before Entry",          group = "Strategy: Stop Loss Conditions",    inline = "4", minval = 30, step = 1,     tooltip = "Lookback to find the Lowest Price. \nStopLoss is determined by the Lowest price of the look back period. Take Profit is derived from this also by multiplying the StopLoss value by the Risk:Reward multiplier.")

//// 3-2. Inputs for Quantity & Risk Manangement: Take Profit
i_riskReward            = input.float(2,    "Risk : Reward  Ratio ",            group = "Strategy: Risk Management",    inline = "1", minval = 0, step = 0.1,     tooltip = "Previous high or low (long/short dependant) is used to determine TP level. 'Risk : Reward' ratio is then used to calculate SL based of previous high/low level.\n\nIn short, the higher the R:R ratio, the smaller the SL since TP target is fixed by previous high/low price data.")
i_accountRiskPercent    = input.float(1,    "Portfolio Risk %",                 group = "Strategy: Risk Management",    inline = "1", minval = 0, step = 0.1,     tooltip = "Percentage of portfolio you lose if trade hits SL.\n\nYou then stand to gain\n  Portfolio Risk % * Risk : Reward\nif trade hits TP.")


// 4. Inputs for Drawings
i_showTpSlBoxes       = input.bool(false,  "Show TP / SL Boxes",               group = "Strategy: Drawings",           inline = "1",  tooltip = "Show or hide TP and SL position boxes.\n\nNote: TradingView limits the maximum number of boxes that can be displayed to 500 so they may not appear for all price data under test.")
i_showLabels          = input.bool(false, "Show Trade Exit Labels",            group = "Strategy: Drawings",           inline = "1",  tooltip = "Useful labels to identify Profit/Loss and cumulative portfolio capital after each trade closes.\n\nAlso note that TradingView limits the max number of 'boxes' that can be displayed on a chart (max 500). This means when you lookback far enough on the chart you will not see the TP/SL boxes. However you can check this option to identify where trades exited.")
i_showDashboard       = input.bool(false, "Show Dashboard",                    group = "Strategy: Drawings",           inline = "1",  tooltip = "Show Backtest Results")
i_show_color_bar      = input.bool(false , "Color Bars",                       group = "Strategy: Drawings",           inline = "1")
// 5. Inputs for Indicators
//// 5-1. Inputs for Indicator - 1: SSL Hybrid
i_useTrueRange = input.bool(defval = true , title = "use true range for Keltner Channel?", tooltip = "", inline = " ", group = "1: SSL Hybrid")
i_maType = input.string(defval='EMA', title='Baseline Type', options=['SMA', 'EMA', 'DEMA', 'TEMA', 'LSMA', 'WMA', 'MF', 'VAMA', 'TMA', 'HMA', 'JMA', 'Kijun v2', 'EDSMA', 'McGinley'],group = "1: SSL Hybrid")
i_len = input.int(defval=30,title='Baseline Length', group = "1: SSL Hybrid")
i_multy = input.float(0.2, step=0.05, title='Base Channel Multiplier', group = "1: SSL Hybrid")

// Input for Baseline
i_kidiv = input.int(defval=1, maxval=4, minval=0, title='Kijun MOD Divider',inline="Kijun v2", group="1: SSL Hybrid")
i_jurik_phase = input.int(defval=3, title='Baseline Type = JMA -> Jurik Phase', inline='JMA',group="1: SSL Hybrid")
i_jurik_power = input.int(defval=1, title='Baseline Type = JMA -> Jurik Power', inline='JMA',group="1: SSL Hybrid")
i_volatility_lookback = input.int(defval=10, title='Baseline Type = VAMA -> Volatility lookback length', inline='VAMA',group="1: SSL Hybrid")
// MF
i_beta = input.float(0.8, minval=0, maxval=1, step=0.1, title='Baseline Type = MF (Modular Filter, General Filter) ->Beta', inline='MF',group="1: SSL Hybrid")
i_feedback = input.bool(defval=false, title='Baseline Type = MF (Modular Filter) -> Use Feedback?', inline='MF',group="1: SSL Hybrid")
i_z = input.float(0.5, title='Baseline Type = MF (Modular Filter) ->  Feedback Weighting', step=0.1, minval=0, maxval=1, inline='MF',group="1: SSL Hybrid")
// EDSMA
i_ssfLength = input.int(title='EDSMA - Super Smoother Filter Length', minval=1, defval=20, inline='EDSMA',group="1: SSL Hybrid")
i_ssfPoles = input.int(title='EDSMA - Super Smoother Filter Poles', defval=2, options=[2, 3], inline='EDSMA',group="1: SSL Hybrid")

// # ========================================================================= #
// #               Functions for Stop Loss & Take Profit & Plots
// # ========================================================================= #

percentAsPoints(pcnt) =>
    math.round(pcnt / 100 * close / syminfo.mintick)

calcStopLossPrice(pointsOffset, isLong) =>
    priceOffset = pointsOffset * syminfo.mintick
    if isLong
        close - priceOffset
    else
        close + priceOffset

calcProfitTrgtPrice(pointsOffset, isLong) =>
    calcStopLossPrice(-pointsOffset, isLong)


printLabel(barIndex, msg) => label.new(barIndex, close, msg)

printTpSlHitBox(left, right, slHit, tpHit, entryPrice, slPrice, tpPrice) =>
    if i_showTpSlBoxes
        box.new (left = left,   top = entryPrice,   right = right,  bottom = slPrice,   bgcolor = slHit ? color.new(color.red, 60)   : color.new(color.gray, 90), border_width = 0)
        box.new (left = left,   top = entryPrice,   right = right,  bottom = tpPrice,   bgcolor = tpHit ? color.new(color.green, 60) : color.new(color.gray, 90), border_width = 0)
        line.new(x1 = left,     y1 = entryPrice,    x2 = right,     y2 = entryPrice,    color = color.new(color.yellow, 20))
        line.new(x1 = left,     y1 = slPrice,       x2 = right,     y2 = slPrice,       color = color.new(color.red, 20))
        line.new(x1 = left,     y1 = tpPrice,       x2 = right,     y2 = tpPrice,       color = color.new(color.green, 20))

printTpSlNotHitBox(left, right, entryPrice, slPrice, tpPrice) =>
    if i_showTpSlBoxes
        box.new (left = left,   top = entryPrice,   right = right,  bottom = slPrice,   bgcolor = color.new(color.gray, 90), border_width = 0)
        box.new (left = left,   top = entryPrice,   right = right,  bottom = tpPrice,   bgcolor = color.new(color.gray, 90), border_width = 0)
        line.new(x1 = left,     y1 = entryPrice,    x2 = right,     y2 = entryPrice,    color = color.new(color.yellow, 20))
        line.new(x1 = left,     y1 = slPrice,       x2 = right,     y2 = slPrice,       color = color.new(color.red, 20))
        line.new(x1 = left,     y1 = tpPrice,       x2 = right,     y2 = tpPrice,       color = color.new(color.green, 20))

printTradeExitLabel(x, y, posSize, entryPrice, pnl) =>
    if i_showLabels
        labelStr = "Position Size: " + str.tostring(math.abs(posSize), "#.##") + "\nPNL: " + str.tostring(pnl, "#.##") + "\nCapital: " + str.tostring(strategy.equity, "#.##") + "\nEntry Price: " + str.tostring(entryPrice, "#.##") + "\nExit Price: " + str.tostring(close,"#.##")
        label.new(x = x, y = y, text = labelStr, color = pnl > 0 ? color.new(color.green, 60) : color.new(color.red, 60), textcolor = color.white, style = label.style_label_down)

f_fillCell(_table, _column, _row, _title, _value, _bgcolor, _txtcolor) =>
    _cellText = _title + " " + _value
    table.cell(_table, _column, _row, _cellText, bgcolor=_bgcolor, text_color=_txtcolor, text_size=size.auto)

// # ========================================================================= #
// #                          Entry, Close Logic
// # ========================================================================= #
// 1. Calculate Indicators
//// 1-1. Calculate Indicators for SSL Hybrid Baseline
////// TEMA
tema(src, len) =>
    ema1 = ta.ema(src, len)
    ema2 = ta.ema(ema1, len)
    ema3 = ta.ema(ema2, len)
    3 * ema1 - 3 * ema2 + ema3
////// EDSMA
get2PoleSSF(src, length) =>
    PI = 2 * math.asin(1)
    arg = math.sqrt(2) * PI / length
    a1 = math.exp(-arg)
    b1 = 2 * a1 * math.cos(arg)
    c2 = b1
    c3 = -math.pow(a1, 2)
    c1 = 1 - c2 - c3

    ssf = 0.0
    ssf := c1 * src + c2 * nz(ssf[1]) + c3 * nz(ssf[2])
    ssf

get3PoleSSF(src, length) =>
    PI = 2 * math.asin(1)

    arg = PI / length
    a1 = math.exp(-arg)
    b1 = 2 * a1 * math.cos(1.738 * arg)
    c1 = math.pow(a1, 2)

    coef2 = b1 + c1
    coef3 = -(c1 + b1 * c1)
    coef4 = math.pow(c1, 2)
    coef1 = 1 - coef2 - coef3 - coef4

    ssf = 0.0
    ssf := coef1 * src + coef2 * nz(ssf[1]) + coef3 * nz(ssf[2]) + coef4 * nz(ssf[3])
    ssf

ma(type, src, len) =>
    float result = 0
    if type == 'TMA'
        result := ta.sma(ta.sma(src, math.ceil(len / 2)), math.floor(len / 2) + 1)
        result
    if type == 'MF'
        ts = 0.
        b = 0.
        c = 0.
        os = 0.
        //----
        alpha = 2 / (len + 1)
        a = i_feedback ? i_z * src + (1 - i_z) * nz(ts[1], src) : src
        //----
        b := a > alpha * a + (1 - alpha) * nz(b[1], a) ? a : alpha * a + (1 - alpha) * nz(b[1], a)
        c := a < alpha * a + (1 - alpha) * nz(c[1], a) ? a : alpha * a + (1 - alpha) * nz(c[1], a)
        os := a == b ? 1 : a == c ? 0 : os[1]
        //----
        upper = i_beta * b + (1 - i_beta) * c
        lower = i_beta * c + (1 - i_beta) * b
        ts := os * upper + (1 - os) * lower
        result := ts
        result
    if type == 'LSMA'
        result := ta.linreg(src, len, 0)
        result
    if type == 'SMA'  // Simple
        result := ta.sma(src, len)
        result
    if type == 'EMA'  // Exponential
        result := ta.ema(src, len)
        result
    if type == 'DEMA'  // Double Exponential
        e = ta.ema(src, len)
        result := 2 * e - ta.ema(e, len)
        result
    if type == 'TEMA'  // Triple Exponential
        e = ta.ema(src, len)
        result := 3 * (e - ta.ema(e, len)) + ta.ema(ta.ema(e, len), len)
        result
    if type == 'WMA'  // Weighted
        result := ta.wma(src, len)
        result
    if type == 'VAMA'  // Volatility Adjusted
        /// Copyright © 2019 to present, Joris Duyck (JD)
        mid = ta.ema(src, len)
        dev = src - mid
        vol_up = ta.highest(dev, i_volatility_lookback)
        vol_down = ta.lowest(dev, i_volatility_lookback)
        result := mid + math.avg(vol_up, vol_down)
        result
    if type == 'HMA'  // Hull
        result := ta.wma(2 * ta.wma(src, len / 2) - ta.wma(src, len), math.round(math.sqrt(len)))
        result
    if type == 'JMA'  // Jurik
        /// Copyright © 2018 Alex Orekhov (everget)
        /// Copyright © 2017 Jurik Research and Consulting.
        phaseRatio = i_jurik_phase < -100 ? 0.5 : i_jurik_phase > 100 ? 2.5 : i_jurik_phase / 100 + 1.5
        beta = 0.45 * (len - 1) / (0.45 * (len - 1) + 2)
        alpha = math.pow(beta, i_jurik_power)
        jma = 0.0
        e0 = 0.0
        e0 := (1 - alpha) * src + alpha * nz(e0[1])
        e1 = 0.0
        e1 := (src - e0) * (1 - beta) + beta * nz(e1[1])
        e2 = 0.0
        e2 := (e0 + phaseRatio * e1 - nz(jma[1])) * math.pow(1 - alpha, 2) + math.pow(alpha, 2) * nz(e2[1])
        jma := e2 + nz(jma[1])
        result := jma
        result
    if type == 'Kijun v2'
        kijun = math.avg(ta.lowest(len), ta.highest(len))  //, (open + close)/2)
        conversionLine = math.avg(ta.lowest(len / i_kidiv), ta.highest(len / i_kidiv))
        delta = (kijun + conversionLine) / 2
        result := delta
        result
    if type == 'McGinley'
        mg = 0.0
        mg := na(mg[1]) ? ta.ema(src, len) : mg[1] + (src - mg[1]) / (len * math.pow(src / mg[1], 4))
        result := mg
        result
    if type == 'EDSMA'
        zeros = src - nz(src[2])
        avgZeros = (zeros + zeros[1]) / 2

        // Ehlers Super Smoother Filter
        ssf = i_ssfPoles == 2 ? get2PoleSSF(avgZeros, i_ssfLength) : get3PoleSSF(avgZeros, i_ssfLength)

        // Rescale filter in terms of Standard Deviations
        stdev = ta.stdev(ssf, len)
        scaledFilter = stdev != 0 ? ssf / stdev : 0

        alpha = 5 * math.abs(scaledFilter) / len

        edsma = 0.0
        edsma := alpha * src + (1 - alpha) * nz(edsma[1])
        result := edsma
        result
    result

////// Keltner Baseline Channel (Baseline)
BBMC = ma(i_maType, close, i_len)
Keltma = ma(i_maType, close, i_len)
range_1 = i_useTrueRange ? ta.tr : high - low
rangema = ta.ema(range_1, i_len)
upperk = Keltma + rangema * i_multy
lowerk = Keltma - rangema * i_multy

// 2. Entry Condition for Long and Short
// Condition 1
bullSSL             = close > upperk
bearSSL             = close < lowerk
// Enter Position based on Condition 1
goLong              = inDateRange and bullSSL
goShort             = inDateRange and bearSSL
// # ========================================================================= #
// #                   Position Control Logic (Entry & Exit)
// # ========================================================================= #
// 1. Trade entry and exit variables
var tradeEntryBar   = bar_index
var profitPoints    = 0.
var lossPoints      = 0.
var slPrice         = 0.
var tpPrice         = 0.
var inLong          = false
var inShort         = false
// 2. Entry decisions
openLong            = (goLong and not inLong)                           // Long entry condition & not in long position
openShort           = (goShort and not inShort)                         // Short entry condition & not in short position
flippingSides       = (goLong and inShort) or (goShort and inLong)      // (Long entry condition & in short position) and the opposite
enteringTrade       = openLong or openShort                             // Entering Long or Short Condition
inTrade             = inLong or inShort
// 3. Stop Loss & Take Profit Percent
lowestLow           = ta.lowest(source = low, length = i_slLookBack)
highestHigh         = ta.highest(source = high, length = i_slLookBack)
llhhSLPercent       = openLong ? math.abs((close - lowestLow) / close) * 100 : openShort ? math.abs((highestHigh - close) / close) * 100 : na
atr                 = ta.atr(i_slAtrLength)
slAmount            = atr * i_slAtrMultiplier
slPercent           = i_slType == 'ATR' ? math.abs((1 - (close - slAmount) / close) * 100) : i_slType == 'Percent' ? i_slPercent : llhhSLPercent
tpPercent           = slPercent * i_riskReward
// 4. Risk calculations & Quantity Management
riskAmt             = strategy.equity * i_accountRiskPercent / 100
entryQty            = math.abs(riskAmt / slPercent * 100)  / close

// 5. Open Position
if openLong
    if strategy.position_size < 0
        printTpSlNotHitBox(tradeEntryBar + 1, bar_index + 1, strategy.position_avg_price, slPrice, tpPrice)
        printTradeExitLabel(bar_index + 1, math.max(tpPrice, slPrice), strategy.position_size, strategy.position_avg_price, strategy.openprofit)
    strategy.entry("Long", strategy.long, qty = entryQty, alert_message = "Long Entry")
    enteringTrade   := true
    inLong          := true
    inShort         := false

if openShort
    if strategy.position_size > 0
        printTpSlNotHitBox(tradeEntryBar + 1, bar_index + 1, strategy.position_avg_price, slPrice, tpPrice)
        printTradeExitLabel(bar_index + 1, math.max(tpPrice, slPrice), strategy.position_size, strategy.position_avg_price, strategy.openprofit)
    strategy.entry("Short", strategy.short, qty = entryQty, alert_message = "Short Entry")
    enteringTrade   := true
    inShort         := true
    inLong          := false

if enteringTrade
    profitPoints    := percentAsPoints(tpPercent)
    lossPoints      := percentAsPoints(slPercent)
    slPrice         := calcStopLossPrice(lossPoints, openLong)
    tpPrice         := calcProfitTrgtPrice(profitPoints, openLong)
    tradeEntryBar   := bar_index

// Can add more take profit Actions
strategy.exit("TP/SL", profit = profitPoints, loss = lossPoints, comment_profit = "TP Hit", comment_loss = "SL Hit", alert_profit = "TP Hit Alert", alert_loss = "SL Hit Alert")

// # ========================================================================= #
// #                    Plots (Bar Color, Plot, Label, Boxes)
// # ========================================================================= #

// 1. SSL Hybrid Baseline
longColor = #00c3ff
shortColor = #ff0062
color_bar = close > upperk ? longColor : close < lowerk ? shortColor : color.gray
p1 = plot(BBMC, color=color.new(color=color_bar, transp=0), linewidth=4, title='MA Baseline')

// 2. Bar color Based On SSL Hybrid Baseline
barcolor(i_show_color_bar ? color_bar : na)
up_channel = plot(upperk, color=color_bar, title='Baseline Upper Channel')
low_channel = plot(lowerk, color=color_bar, title='Basiline Lower Channel')
fill(up_channel, low_channel, color.new(color=color_bar, transp=90))


// 3. Stoploss Boxes
slHit           = (inShort and high >= slPrice) or (inLong  and low <= slPrice)
tpHit           = (inLong  and high >= tpPrice) or (inShort and low <= tpPrice)
exitTriggered   = slHit or tpHit
entryPrice      = strategy.closedtrades.entry_price (strategy.closedtrades - 1)
pnl             = strategy.closedtrades.profit      (strategy.closedtrades - 1)
posSize         = strategy.closedtrades.size        (strategy.closedtrades - 1)

if (inTrade and exitTriggered)
    inShort    := false
    inLong     := false
    printTpSlHitBox(tradeEntryBar + 1, bar_index, slHit, tpHit, entryPrice, slPrice, tpPrice)
    printTradeExitLabel(bar_index, math.max(tpPrice, slPrice), posSize, entryPrice, pnl)

if barstate.islastconfirmedhistory and strategy.position_size != 0
    printTpSlNotHitBox(tradeEntryBar + 1, bar_index + 1, strategy.position_avg_price, slPrice, tpPrice)


// 4. Data Windows
plotchar(slPrice,    "Stop Loss Price",     "")
plotchar(tpPrice,    "Take Profit Price",   "")

// 5. Showing Labels
plotDebugLabels = false
if plotDebugLabels
    if bar_index == tradeEntryBar
        printLabel(bar_index, "Position size: " + str.tostring(entryQty * close, "#.##"))

// 6. Showing Dashboard
if i_showDashboard
    var bgcolor = color.new(color.black,0)

    // Keep track of Wins/Losses streaks
    newWin  = (strategy.wintrades  > strategy.wintrades[1]) and (strategy.losstrades == strategy.losstrades[1]) and (strategy.eventrades == strategy.eventrades[1])
    newLoss = (strategy.wintrades == strategy.wintrades[1]) and (strategy.losstrades  > strategy.losstrades[1]) and (strategy.eventrades == strategy.eventrades[1])

    varip int winRow     = 0
    varip int lossRow    = 0
    varip int maxWinRow  = 0
    varip int maxLossRow = 0

    if newWin
        lossRow := 0
        winRow := winRow + 1
    if winRow > maxWinRow
        maxWinRow := winRow

    if newLoss
        winRow := 0
        lossRow := lossRow + 1
    if lossRow > maxLossRow
        maxLossRow := lossRow


    // Prepare stats table
    var table dashTable = table.new(position.bottom_right, 1, 15, border_width=1)


    if barstate.islastconfirmedhistory
        // Update table
        dollarReturn = strategy.netprofit
        f_fillCell(dashTable, 0, 0, "Start:", str.format("{0,date,long}", strategy.closedtrades.entry_time(0)) , bgcolor, color.white) // + str.format(" {0,time,HH:mm}", strategy.closedtrades.entry_time(0))
        f_fillCell(dashTable, 0, 1, "End:", str.format("{0,date,long}", strategy.opentrades.entry_time(0)) , bgcolor, color.white) // + str.format(" {0,time,HH:mm}", strategy.opentrades.entry_time(0))
        _profit = (strategy.netprofit / strategy.initial_capital) * 100
        f_fillCell(dashTable, 0, 2, "Net Profit:", str.tostring(_profit, '##.##') + "%", _profit > 0 ? color.green : color.red, color.white)
        _numOfDaysInStrategy = (strategy.opentrades.entry_time(0) - strategy.closedtrades.entry_time(0)) / (1000 * 3600 * 24)
        f_fillCell(dashTable, 0, 3, "Percent Per Day", str.tostring(_profit / _numOfDaysInStrategy, '#########################.#####')+"%", _profit > 0 ? color.green : color.red, color.white)
        _winRate = ( strategy.wintrades / strategy.closedtrades ) * 100
        f_fillCell(dashTable, 0, 4, "Percent Profitable:", str.tostring(_winRate, '##.##') + "%", _winRate < 50 ? color.red : _winRate < 75 ? #999900 : color.green, color.white)
        f_fillCell(dashTable, 0, 5, "Profit Factor:", str.tostring(strategy.grossprofit / strategy.grossloss,  '##.###'), strategy.grossprofit > strategy.grossloss ? color.green : color.red, color.white)
        f_fillCell(dashTable, 0, 6, "Total Trades:", str.tostring(strategy.closedtrades), bgcolor, color.white)
        f_fillCell(dashTable, 0, 8, "Max Wins In A Row:", str.tostring(maxWinRow, '######') , bgcolor, color.white)
        f_fillCell(dashTable, 0, 9, "Max Losses In A Row:", str.tostring(maxLossRow, '######') , bgcolor, color.white)