ٹرپل موونگ ایوریج اور MACD مشترکہ مقداری حکمت عملی
جائزہ
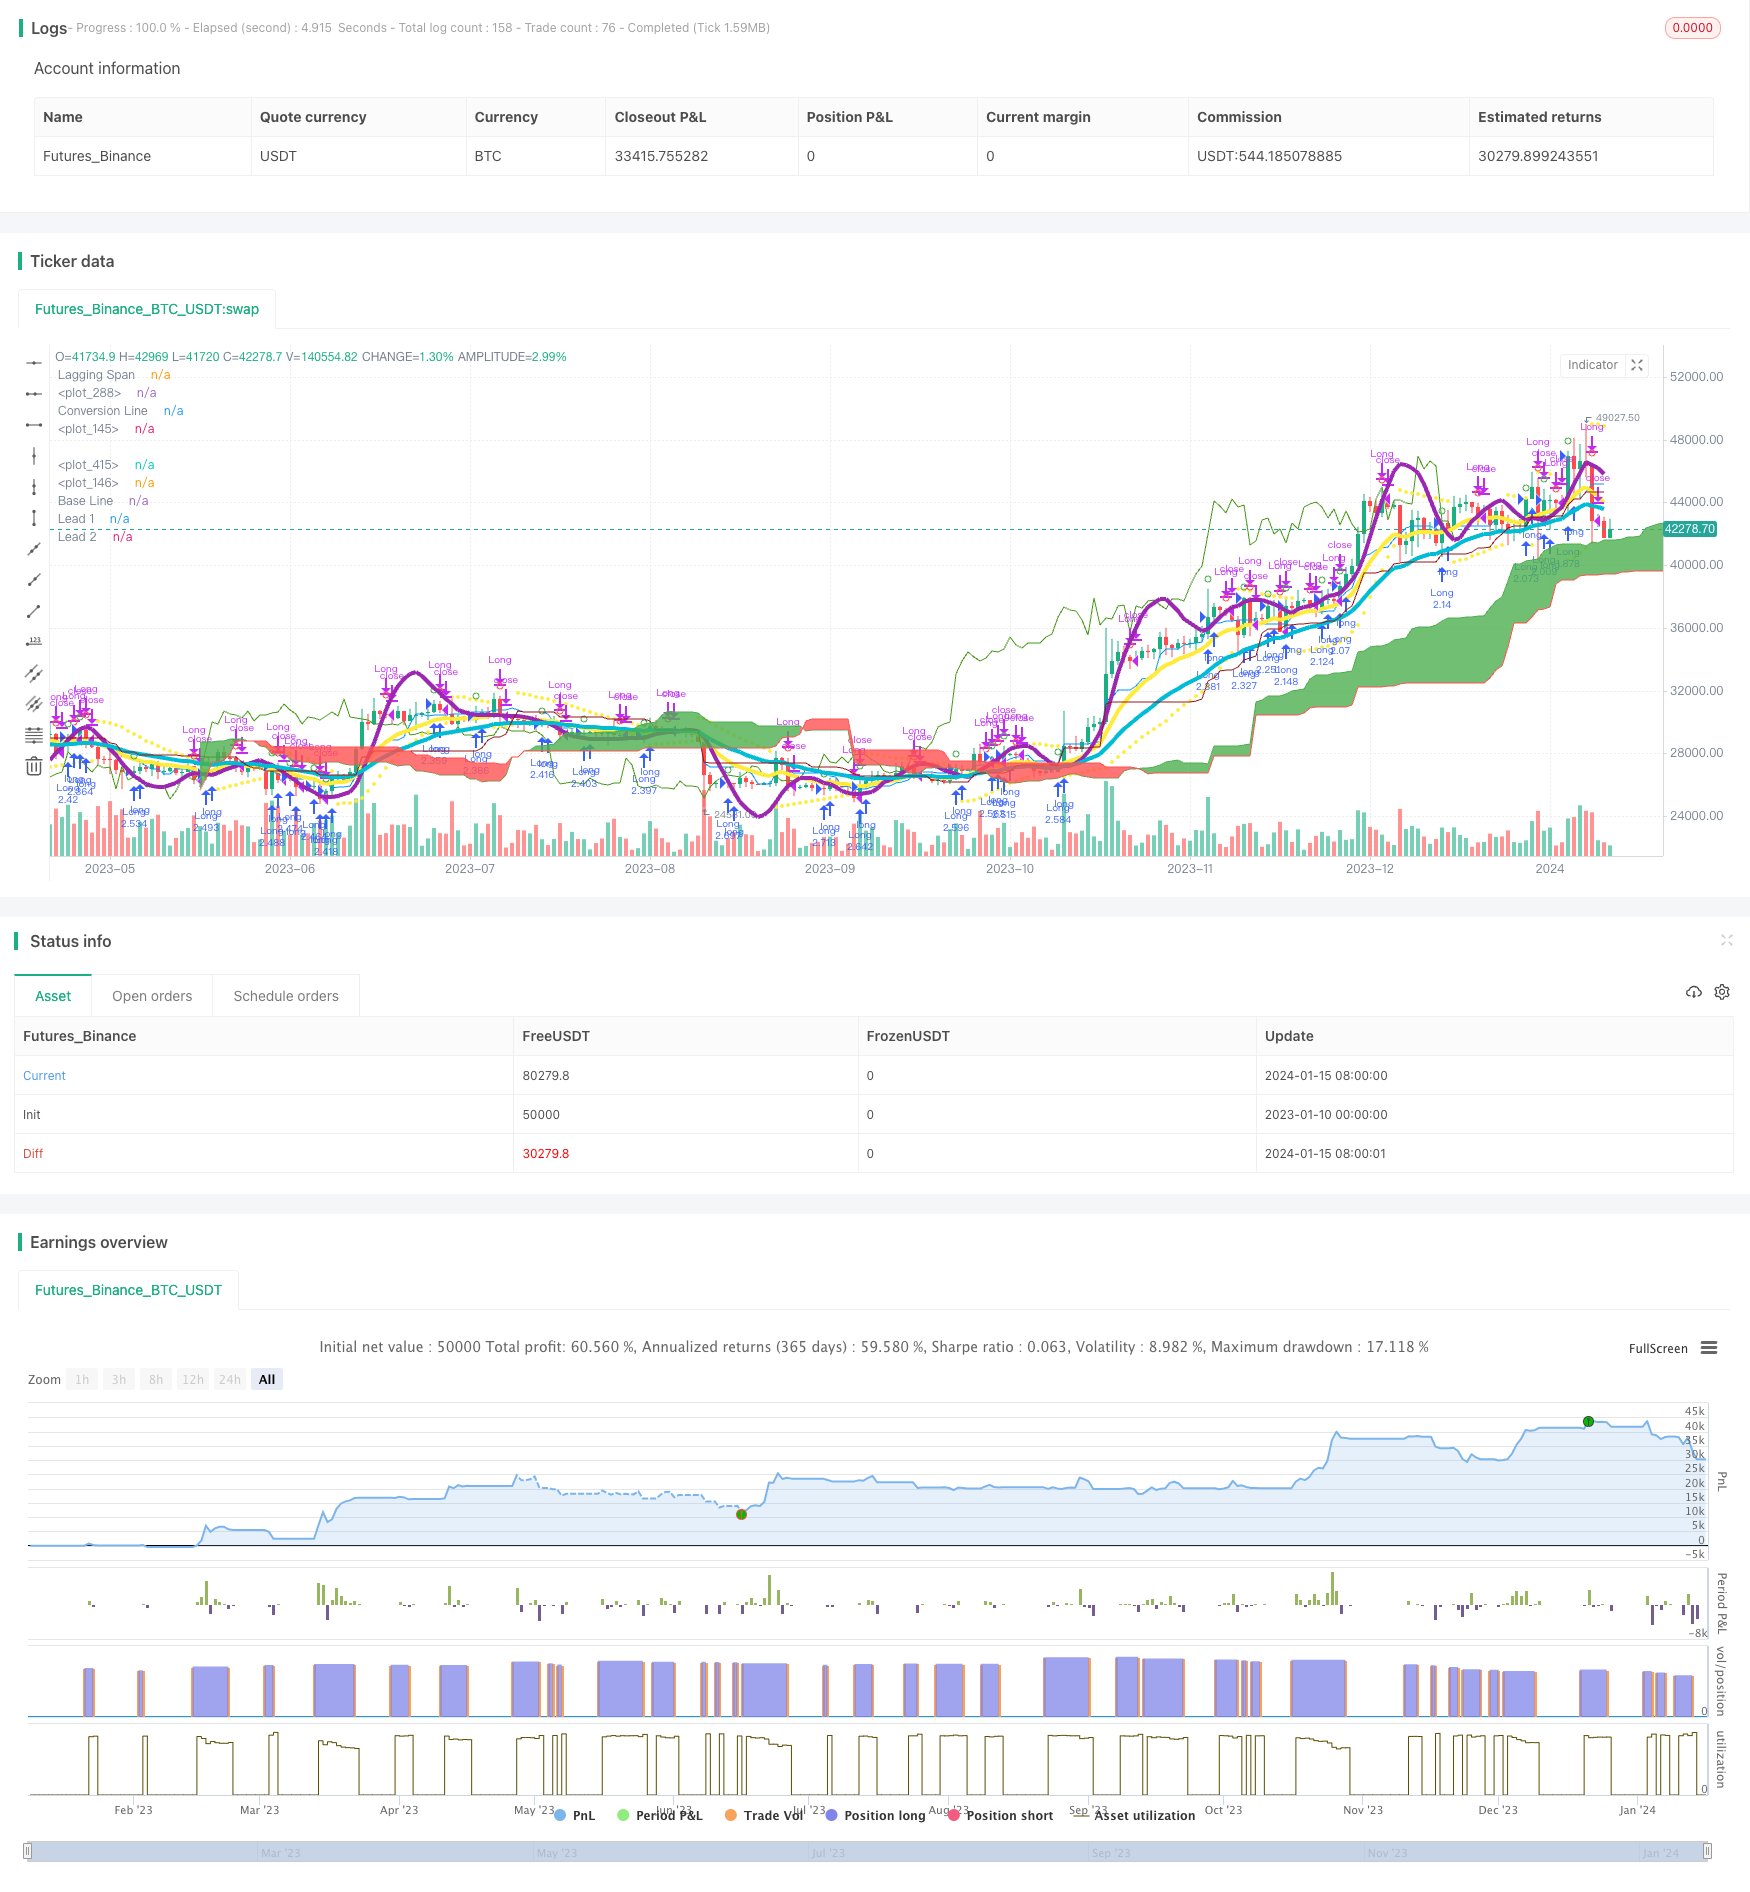
اس حکمت عملی نے ٹرپل منتقل اوسط اشارے اور MACD اشارے کا استعمال کرتے ہوئے ایک زیادہ مستحکم اور قابل اعتماد مقداری تجارت کی حکمت عملی تیار کی ہے۔ اس حکمت عملی کا مقصد مستقبل میں ممکنہ رجحانات پر قبضہ کرنا ہے ، خاص طور پر درمیانی اور لمبی لائن کی پوزیشنوں کے لئے موزوں ہے۔
حکمت عملی کا اصول
یہ حکمت عملی بنیادی طور پر ٹرپل منتقل اوسط اور MACD اشارے کے مجموعی استعمال پر مبنی ہے۔
سب سے پہلے ، حکمت عملی نے تین گنا پوینشل منتقل اوسط کا استعمال کیا ، جس کی لمبائی 3 ، 7 اور 2 ہے۔ یہ تینوں منتقل اوسط ایک تیز اور آہستہ چلنے والی اوسط کا نظام بناتے ہیں ، جس کا استعمال مستقبل کے رجحانات کی سمت کا تعین کرنے کے لئے کیا جاتا ہے۔ جب قلیل مدتی حرکت پذیری اوسط پر طویل مدتی حرکت پذیری اوسط سے تجاوز کیا جاتا ہے تو ، ایک سے زیادہ سگنل دیا جاتا ہے۔ جب قلیل مدتی حرکت پذیری اوسط کے نیچے طویل مدتی حرکت پذیری اوسط سے تجاوز کیا جاتا ہے تو ، ایک خالی سگنل دیا جاتا ہے۔
دوسرا ، حکمت عملی ایک ہی وقت میں MACD اشارے کا استعمال کرتی ہے جس کی پیرامیٹرز 3 اور 7 ہیں۔ جب MACD مین لائن پر سگنل لائن کو کثیر سگنل کے طور پر اور نیچے کو خالی سگنل کے طور پر استعمال کرتا ہے۔
ڈبل اشارے کا استعمال کرتے ہوئے ، آپ کو ایک ہی اشارے کی وجہ سے متعدد غلط سگنلوں سے بچنے کی اجازت ملتی ہے ، جس سے حکمت عملی کی استحکام میں اضافہ ہوتا ہے۔
اسٹریٹجک فوائد
- ڈبل اشارے فلٹرنگ کا استعمال کرتے ہوئے سگنل کے معیار کو بہتر بنانا
- پیرامیٹرز کئی بار جانچ کے بعد بہتر ، مستحکم اور قابل اعتماد ہیں
- ٹرپل موبائل اوسط نظام کا استعمال کرتے ہوئے ، مارکیٹ کے شور کو مؤثر طریقے سے فلٹر کریں اور مستقبل کے رجحانات کا اندازہ لگائیں
- MACD اشارے کی پیرامیٹرز کی ترتیب تیز ہے ، جو قلیل مدتی مواقع کو تیزی سے پکڑ سکتی ہے
اسٹریٹجک رسک
- کچھ واپسی اور مسلسل نقصان کا خطرہ
- مارکیٹ میں واضح رجحانات نہ ہونے پر اس حکمت عملی کے نتیجے میں زیادہ سے زیادہ غلط تجارت ہوتی ہے۔
- MACD اشارے غلط سگنل پیدا کرنے کے لئے آسان ہے اور اوسط لائن اشارے کے ساتھ مل کر استعمال کرنے کی ضرورت ہے
حل:
- زیادہ سے زیادہ واپسی پر قابو پانے کے لئے مناسب اسٹاپ نقصان کی حکمت عملی کا استعمال کرنا
- جب مارکیٹ کی حالت واضح طور پر غیر رجحان ہے تو ، تجارت کی تعدد کو کم کریں
- MACD پیرامیٹرز کو بہتر بنائیں اور دوسرے اشارے کے ساتھ مل کر استعمال کریں
حکمت عملی کی اصلاح کی سمت
- بہترین مجموعہ تلاش کرنے کے لئے منتقل اوسط اور MACD پیرامیٹرز کی جانچ اور اصلاح کریں
- اضافی معاون اشارے جیسے کے ڈی جے ، وی آر ایس آئی غلط سگنل سے بچنے کے لئے
- مارکیٹ کی حالت کا اندازہ لگانے کے لئے مشین لرننگ ماڈل شامل کریں اور متحرک ایڈجسٹمنٹ کو نافذ کریں
- سٹاپ نقصان کی حکمت عملی کے ساتھ بہترین سٹاپ نقصان کا تعین کریں
خلاصہ کریں۔
یہ حکمت عملی ایک متحرک اوسط اور MACD کے امتزاج کے ذریعہ مستحکم رجحانات کو پکڑنے میں کامیاب ہے۔ اس کی حکمت عملی کا فائدہ یہ ہے کہ اشارے کا مجموعہ استعمال کیا جاتا ہے ، جس سے غلط سگنل کو مؤثر طریقے سے کم کیا جاسکتا ہے ، تاکہ حکمت عملی کا بہتر اثر حاصل کیا جاسکے۔ اگلا ، اس حکمت عملی کو پیرامیٹرز کی اصلاح ، اسٹاپ نقصان کی حکمت عملی کے تعارف ، متحرک ایڈجسٹمنٹ وغیرہ کے ذریعہ مزید بہتر بنایا جائے ، تاکہ یہ درمیانی لمبی لائن کے مواقع تلاش کرنے کا ایک موثر ذریعہ بن سکے۔
/*backtest
start: 2023-01-10 00:00:00
end: 2024-01-16 00:00:00
period: 1d
basePeriod: 1h
exchanges: [{"eid":"Futures_Binance","currency":"BTC_USDT"}]
*/

//@version=3
strategy("Matt's MACD Algo v1", shorttitle="Matt's MACD Algo v1", overlay=true, pyramiding = 0, default_qty_type = strategy.percent_of_equity, default_qty_value = 100, initial_capital=7000, calc_on_order_fills = true, commission_type=strategy.commission.percent, commission_value=0, currency = currency.USD)
//study("MFI Fresh", shorttitle="MFI Fresh", overlay=true)

//Risk Management Settings
//trategy.risk.max_drawdown(20, strategy.percent_of_equity)
//strategy.risk.max_intraday_loss(10, strategy.percent_of_equity)
//strategy.risk.max_cons_loss_days(3)

/////////////////
ts = input(title="Trailing Stop in cents", defval=50)/100

//Time Inputs
FromMonth = input(defval = 6, title = "From Month", minval = 1)
FromDay   = input(defval = 1, title = "From Day", minval = 1)
FromYear  = input(defval = 2017, title = "From Year", minval = 1)
ToMonth   = input(defval = 1, title = "To Month", minval = 1)
ToDay     = input(defval = 1, title = "To Day", minval = 1)
ToYear    = input(defval = 9999, title = "To Year", minval = 1)

//Time Variable
testPeriod() =>
    (time > timestamp(FromYear, FromMonth, FromDay, 09, 30)) and (time < timestamp(ToYear, ToMonth, ToDay, 09, 29))

//MA On and MA Colors On? Inputs
switch1=input(false, title="Enable Bar Color?")
switch2=input(true, title="Enable Moving Averages?")
switch3=input(false, title="Enable Background Color?")
switch4=input(false, title="Enable Bolinger Bands?")
switch5=input(false, title="Enable Keltner Channel?")

////////////////////////////////Williams %R
R_length = input(14, minval=1)
R_overBought = input(title="%R Overbought", defval=80)
R_overSold = input(title="%R Oversold", defval=20)
R_upper = highest(R_length)
R_lower = lowest(R_length)
R_out = 100 * (close - R_upper) / (R_upper - R_lower)

WilliamsR_longEntry = crossover(R_out, R_overSold)
WilliamsR_shortEntry = crossunder(R_out, R_overBought)

//plot(R_out)
//R_band1 = hline(R_overSold)
//R_band0 = hline(R_overBought)
//fill(R_band1, R_band0)

////////////////////////////////RSI Variables
rsi_source = close
RSI_Length = input(title="RSI Length", defval=3)
RSI_overBought = input(title="RSI Overbought", defval=80)
RSI_overSold = input(title="RSI Oversold", defval=20)

up = rma(max(change(rsi_source), 0), RSI_Length)
down = rma(-min(change(rsi_source), 0), RSI_Length)
rsi = down == 0 ? 100 : up == 0 ? 0 : 100 - (100 / (1 + up / down))

RSI_longEntry = rsi > 50
//crossover(rsi, RSI_overSold)
RSI_shortEntry = rsi < 50
//crossunder(rsi, RSI_overBought)

//plot(rsi, color=purple)
//band1 = hline(RSI_overBought)
//band0 = hline(RSI_overSold)
//fill(band1, band0, color=purple, transp=90)


//////////////////////Commodity Channel Index
cci_length = input(20, minval=1)
cci_src = input(close, title="Source")
cci_ma = sma(cci_src, cci_length)
cci = (cci_src - cci_ma) / (0.015 * dev(cci_src, cci_length))


cci_longEntry = crossover(cci, -100)
cci_shortEntry = crossunder(cci, 100)

//plot(cci, color=olive)
//cci_band1 = hline(100, color=gray, linestyle=dashed)
//cci_band0 = hline(-100, color=gray, linestyle=dashed)
//fill(cci_band1, cci_band0, color=olive)


//MFI Inputs
MFI_length = input(title="MFI Length", defval=3)
MFI_overBought = input(title="MFI Overbought", defval=80)
MFI_overSold = input(title="MFI Oversold", defval=20)

//MFI Variables
rawMoneyFlow = hlc3 * volume
positiveMoneyFlow = 0.0
positiveMoneyFlow := hlc3 > hlc3[1] ? positiveMoneyFlow + rawMoneyFlow : positiveMoneyFlow
negativeMoneyFlow = 0.0
negativeMoneyFlow :=  hlc3 < hlc3[1] ? negativeMoneyFlow + rawMoneyFlow : negativeMoneyFlow
moneyFlowRatio = sma(positiveMoneyFlow, MFI_length) / sma(negativeMoneyFlow, MFI_length)
moneyFlowIndex = 100 - 100 / (1 + moneyFlowRatio)

MFI_longEntry = (crossover(moneyFlowIndex, MFI_overSold))
MFI_shortEntry = (crossunder(moneyFlowIndex, MFI_overBought))


///// MFI Plot for STUDY
//plot(moneyFlowIndex, color=#459915)
//MFI_OB=hline(MFI_overBought, title="Overbought", color=#c0c0c0)
//MFI_OS=hline(MFI_overSold, title="Oversold", color=#c0c0c0)
//fill(MFI_overBought, MFI_overSold, color=#9915ff, transp=90)


////VERY SLOW SMA
veryslowLength=input(50,minval=1, title="Very slow SMA")
veryslowSMA = sma(close, veryslowLength)


//MACD Inputs
source = input(close, title="MACD source")
fastLength = input(title="MACD Fast Length", defval=12)
fastLength2 = input(title="MACD Fast Length #2", defval=3)
slowLength = input(title="MACD Slow Length", defval=26)
slowLength2 = input(title="MACD Slow Length #2", defval=7)
MACD_fastsignalSmoothing = input(title="Signal Smoothing", defval=7)
MACD_slowsignalSmoothing = input(title="Signal Smoothing", defval=12)
MACD_fastsignalSmoothing2 = input(title="Signal Smoothing #2", defval=5)
MACD_slowsignalSmoothing2 = input(title="Signal Smoothing #2", defval=9)
MACD_percentthreshold = input(title="MACD % Threshold", defval=-0.0030, step=0.0001)

//MACD variables
fastEMA = ema(source, fastLength)
fastEMA2 = ema(source, fastLength2)
slowEMA = ema(source, slowLength)
slowEMA2 = ema(source, slowLength2)
MACD_Line = fastEMA - slowEMA
MACD_Line2 = fastEMA2 - slowEMA2
MACD_fastsignalLine = ema(MACD_Line, MACD_fastsignalSmoothing)
MACD_slowsignalLine = ema(MACD_Line, MACD_slowsignalSmoothing)
MACD_fastsignalLine2 = ema(MACD_Line2, MACD_fastsignalSmoothing2)
MACD_slowsignalLine2 = ema(MACD_Line2, MACD_slowsignalSmoothing2)
fasthist = MACD_Line - MACD_slowsignalLine
MACD_Histogram2 = MACD_Line2 - MACD_fastsignalLine2
minimum = close * MACD_percentthreshold
SMA = sma(MACD_Line, 10)

// MACD and veryslowSMA Plot for STRATEGY
Fast=plot(switch2?fastEMA:na,color=yellow, linewidth=4)
Slow=plot(switch2?slowEMA:na,color=aqua, linewidth=4)
//VerySlow=plot(switch2?veryslowSMA:na,color=purple,linewidth=4)
//fill(Fast,VerySlow,color=gray)

/////// MACD Plots for STUDY
//plot(fasthist, color=fasthist>0 and fasthist[0]>fasthist[1]?#00ff00:fasthist<=0 and fasthist[0]<fasthist[1]?#f72e2e:fasthist>0 and fasthist[0]<fasthist[1]?#008000:fasthist<0 and fasthist[0]>fasthist[1]?#7f0000:white, style=histogram)
//plot(slowhist, color=slowhist>0 and slowhist[0]>slowhist[1]?#00ff00:slowhist<=0 and slowhist[0]<slowhist[1]?#f72e2e:slowhist>0 and slowhist[0]<slowhist[1]?#008000:slowhist<0 and slowhist[0]>slowhist[1]?#7f0000:white, style=histogram)
//plot(MACD_Line, color=yellow, title="MACD Line")
//plot(MACD_fastsignalSmoothing, color=green, title="Fast Signal Line")
//plot(MACD_slowsignalSmoothing, color=red, title="Slow Signal Line")
//plot(MACD_Line2, color=aqua, title="MACD Line 2")
//plot(MACD_fastsignalSmoothing2, color=orange, title="Fast Signal Line 2")
//plot(MACD_slowsignalSmoothing2, color=white, title="Slow Signal Line 2")
//plot(minimum, color=white, title="% Threshold")
//plot(fasthist, color=fasthist>0 and fasthist[0]>fasthist[1]?#00ff00:fasthist<=0 and fasthist[0]<fasthist[1]?#f72e2e:fasthist>0 and fasthist[0]<fasthist[1]?#008000:fasthist<0 and fasthist[0]>fasthist[1]?#7f0000:white, style=histogram)
//plot(MACD_Histogram2, color=MACD_Histogram2>0?blue:MACD_Histogram2<0?orange:white, style=histogram)
//plot(SMA, color=white, title="SMA")

//MACD Entry Conditions
MACD_longEntry2 = (crossover(MACD_Histogram2, 0))
MACD_shortEntry2 = (crossunder(MACD_Histogram2, 0))
MACD_longEntry = (crossover(fasthist, 0))
MACD_shortEntry = (crossunder(fasthist, 0))


// Colors
//MAtrendcolor = change(veryslowSMA) > 0 ? green : red
//trendcolor = fastEMA > slowEMA and change(veryslowSMA) > 0 and close > slowEMA ? green : fastEMA < slowEMA and change(veryslowSMA) < 0 and close < slowEMA ? red : yellow
//bartrendcolor = close > fastEMA and close > slowEMA and close > veryslowSMA and change(slowEMA) > 0 ? green : close < fastEMA and close < slowEMA and close < veryslowSMA and change(slowEMA) < 0 ? red : yellow
//backgroundcolor = slowEMA > veryslowSMA and MACD_longEntry and MACD_Line > 0 and fastEMA > slowEMA and close[slowLength] > veryslowSMA ? green : slowEMA < veryslowSMA and MACD_shortEntry and MACD_Line < 0 and fastEMA < slowEMA and close[slowLength] < veryslowSMA ? red : na
//barcolor(switch1?bartrendcolor:na)

// Conditional Bar Colors
//backgroundcolor = (MACD_longEntry ? green : MACD_shortEntry ? red : na)
//bgcolor(switch3?backgroundcolor:na,transp=80)


////BOLLINGER BAND Conditions
bb_source = close
bb_length = input(20, minval=1)
bb_mult = input(1.86, minval=0.001, maxval=50)

bb_basis = ema(bb_source, bb_length)
bb_dev = bb_mult * stdev(bb_source, bb_length)

bb_upper = bb_basis + bb_dev
bb_lower = bb_basis - bb_dev

bb_longEntry = crossover(bb_source, bb_lower)
bb_shortEntry = crossunder(bb_source, bb_upper)

plot(switch4?bb_basis:na, color=red, linewidth=4)
p1=plot(switch4?bb_upper:na)
p2=plot(switch4?bb_lower:na)
fill(p1,p2, color=aqua, transp=95)

////KELTNER CHANNEL Inputs/Variables/Plots
KC_useTrueRange = input(true)
KC_length = input(20, minval=1)
KC_mult = input(3.0)
KC_source = input(close, title="Source")

KC_ma = ema(KC_source, KC_length)
KC_range = KC_useTrueRange ? tr : high - low
KC_rangema = ema(KC_range, KC_length)
KC_upper = KC_ma + KC_rangema * KC_mult
KC_lower = KC_ma - KC_rangema * KC_mult

KC_longEntry = crossover(KC_source, KC_lower)
KC_shortEntry = crossunder(KC_source, KC_upper)

plot(switch5?KC_ma:na, color=red, title="Basis")
KC_u = plot(switch5?KC_upper:na, color=red, title="Upper")
KC_l = plot(switch5?KC_lower:na, color=red, title="Lower")
fill(KC_u, KC_l, color=red)

///////////////////ADX
//len = input(title="ADX Length", type=integer, defval=14)
//th = input(title="ADX threshold", type=integer, defval=20)

//TrueRange = max(max(high-low, abs(high-nz(close[1]))), abs(low-nz(close[1])))
//DirectionalMovementPlus = high-nz(high[1]) > nz(low[1])-low ? max(high-nz(high[1]), 0): 0
//DirectionalMovementMinus = nz(low[1])-low > high-nz(high[1]) ? max(nz(low[1])-low, 0): 0


//SmoothedTrueRange = nz(SmoothedTrueRange[1]) - (nz(SmoothedTrueRange[1])/len) + TrueRange
//SmoothedDirectionalMovementPlus = nz(SmoothedDirectionalMovementPlus[1]) - (nz(SmoothedDirectionalMovementPlus[1])/len) + DirectionalMovementPlus
//SmoothedDirectionalMovementMinus = nz(SmoothedDirectionalMovementMinus[1]) - (nz(SmoothedDirectionalMovementMinus[1])/len) + DirectionalMovementMinus

//DIPlus = sma(SmoothedDirectionalMovementPlus / SmoothedTrueRange * 100, len)
//DIMinus = sma(SmoothedDirectionalMovementMinus / SmoothedTrueRange * 100, len)
//DX = abs(DIPlus-DIMinus) / (DIPlus+DIMinus)*100
//ADX = sma(DX, len)


///
//ADX_longEntry = crossover(DIPlus, DIMinus) //or (DIPlus > DIMinus and DIPlus > th and ADX > th)
//ADX_shortEntry = crossover(DIMinus, DIPlus) //or (DIMinus > DIPlus and DIMinus > th and ADX > th)


//DI_long = if DIPlus > DIMinus and ADX > 20 and DIPlus > 20


//plot(DIPlus, color=green, title="DI+")
//plot(DIMinus, color=red, title="DI-")
//plot(ADX, color=black, title="ADX")
//hline(th, color=black, linestyle=dashed)


//////////////////////////////////Playing with RES


r1 = input("5", "Resolution")
r2 = input("15", "Resolution")
r3 = input("30", "Resolution")
r4 = input("60", "Resolution")

o1 = request.security(heikinashi(syminfo.tickerid), r1, MACD_Line[1])
c1 = request.security(heikinashi(syminfo.tickerid), r1, MACD_slowsignalLine[1])
o2 = request.security(heikinashi(syminfo.tickerid), r2, MACD_Line[1])
c2 = request.security(heikinashi(syminfo.tickerid), r2, MACD_slowsignalLine[1])
o3 = request.security(heikinashi(syminfo.tickerid), r3, MACD_Line[1])
c3 = request.security(heikinashi(syminfo.tickerid), r3, MACD_slowsignalLine[1])
o4 = request.security(heikinashi(syminfo.tickerid), r4, MACD_Line[1])
c4 = request.security(heikinashi(syminfo.tickerid), r4, MACD_slowsignalLine[1])

res_long = (o4 > c4 and o3 > c3 and o2 > c2 and o1 > c1)
res_short = (o4 < c4 and o3 < c3 and o2 < c2 and o1 < c1)

///////////////////// Parabolic SAR (stop and reverse)
start = input(0.02)
increment = input(0.02)
maximum = input(0.2)

psar = sar(start, increment, maximum)
plot(psar, style=circles, color=yellow)

psar_longEntry = close > psar
psar_longExit = crossunder(close, psar)
psar_shortEntry = close < psar//crossunder(close, psar)
psar_shortExit = crossover(close, psar)

mix = (moneyFlowIndex + rsi)/2
RSI_MFI = ema(mix, input(3))
//color = RSI_MFI > 80 ? red :RSI_MFI < 20  ? green : silver
vrsi = RSI_MFI

rsiBuySell = vrsi[1] < 95 and crossover(vrsi, 95) or vrsi[1] < 90 and crossover(vrsi, 90) or vrsi[1] < 85 and crossover(vrsi, 85) or vrsi[1] < 80 and crossover(vrsi, 80)  or vrsi[1] < 75 and crossover(vrsi, 75) or vrsi[1] < 70 and  crossover(vrsi, 70)  or vrsi[1] < 65 and crossover(vrsi, 65) or vrsi[1] < 60 and  crossover(vrsi, 60)  or vrsi[1] < 55 and crossover(vrsi, 55) or vrsi[1] < 50 and crossover(vrsi, 50) or vrsi[1] < 45 and crossover(vrsi, 45) or vrsi[1] < 40 and  crossover(vrsi, 40) or vrsi[1] < 35 and crossover(vrsi, 35) or vrsi[1] < 30 and crossover(vrsi, 30) or vrsi[1] < 25 and crossover(vrsi, 25) or vrsi[1] < 20 and  crossover(vrsi, 20) or vrsi[1] < 15 and crossover(vrsi, 15) or  vrsi[1] < 10 and crossover(vrsi, 10) or  vrsi[1] < 5 and crossover(vrsi, 5)  ? 1 :  vrsi[1] > 95 and  crossunder(vrsi, 95) or vrsi[1] > 90 and  crossunder(vrsi, 90) or  vrsi[1] > 85 and  crossunder(vrsi, 85) or vrsi[1] > 80 and crossunder(vrsi, 80) or  vrsi[1] > 75 and  crossunder(vrsi, 75) or vrsi[1] > 70 and  crossunder(vrsi, 70) or  vrsi[1] > 65 and  crossunder(vrsi, 65) or vrsi[1] > 60 and crossunder(vrsi, 60) or  vrsi[1] > 55 and  crossunder(vrsi, 55) or vrsi[1] > 50 and crossunder(vrsi, 50) or  vrsi[1] > 45 and  crossunder(vrsi, 45) or vrsi[1] > 40 and crossunder(vrsi, 40) or  vrsi[1] > 35 and  crossunder(vrsi, 35) or vrsi[1] > 30 and crossunder(vrsi, 30) or  vrsi[1] > 25 and  crossunder(vrsi, 25) or vrsi[1] > 20 and  crossunder(vrsi, 20) or vrsi[1] > 15 and crossunder(vrsi, 15) or vrsi[1] > 10 and crossunder(vrsi, 10) or  vrsi[1] > 5 and  crossunder(vrsi, 5) ?-1:na

//////////////////////////////////Entry Conditions
//
MA1 = ema(hlc3, input(3))
MA2 = wma(MA1, input(7))
MA3 = ema(MA2, input(2))
MA4 = wma(MA3, input(1))

buy =  close > MA4 or hlc3[1] < MA4 and hlc3 > MA4 and rsiBuySell == 1
sell = close < MA4 or hlc3[1] > MA4 and hlc3 < MA4 and rsiBuySell == -1

p=14

CO=close-open
HL=high-low

value1 = (CO + 2*CO[1] + 2*CO[2] + CO[3])/6
value2 = (HL + 2*HL[1] + 2*HL[2] + HL[3])/6

num=sum(value1,p)
denom=sum(value2,p)

RVI=denom!=0?num/denom:0

RVIsig=(RVI+ 2*RVI[1] + 2*RVI[2] + RVI[3])/6

//plot(RVI,color=white,style=line,linewidth=1)
//plot(RVIsig,color=orange,style=line,linewidth=1)

Tenkan_periods = input(9, minval=1, title="Conversion Line Periods"),
Kijun_periods = input(26, minval=1, title="Base Line Periods")
Senkou_Span_B_Length = input(50, minval=1, title="Lagging Span 2 Periods"),
Chikou_Span_Length = input(25, minval=1, title="Displacement")

donchian(len) => avg(lowest(len), highest(len))

Tenkan_sen = donchian(Tenkan_periods)
Kijun_sen = donchian(Kijun_periods)
Senkou_Span_A = avg(Tenkan_sen, Kijun_sen)
Senkou_Span_B = donchian(Senkou_Span_B_Length)

plot(Tenkan_sen, color=#0496ff, title="Conversion Line")
plot(Kijun_sen, color=#991515, title="Base Line")
plot(close, offset = -Chikou_Span_Length, color=#459915, title="Lagging Span")

p3 = plot(Senkou_Span_A, offset = Chikou_Span_Length, color=green,
 title="Lead 1")
p4 = plot(Senkou_Span_B, offset = Chikou_Span_Length, color=red,
 title="Lead 2")
fill(p3, p4, color = Senkou_Span_A > Senkou_Span_B ? green : red, transp=50)

Ichimoku_longEntry = Senkou_Span_B < Senkou_Span_A
Ichimoku_shortEntry = Senkou_Span_A < Senkou_Span_B

len9 = input(9, minval=1, title="Length")
srce = input(hlc3, title="Source")
ema9 = ema(srce, len9)
sma50 = sma(ema9, 80)
sma30 = vwma(sma50, 26)
ema930 = ema(sma30, 9)
//plot(ema930, color=blue, title="MA", linewidth=5, transp=0)

SMA100 = sma(input(ohlc4), input(10))
Lookback = SMA100[input(7)]
sma300 = SMA100 + (SMA100 - Lookback)


//if Ichimoku_longEntry
longEntry = (MACD_longEntry2) //or Stoch_longEntry// or buy //or cci_longEntry  or bb_longEntry or psar_shortExit //or  //// // KC_longEntry// or WilliamsR_longEntry//  // // or RSI_longEntry// // or  or MFI_longEntry// or crossover(close,psar) //(o4 < c4 and o3 < c3 and o2 < c2 and o1 < c1)

//if Ichimoku_shortEntry
shortEntry = (MACD_shortEntry2) //or Stoch_shortEntry// or sell//or cci_shortEntry or bb_shortEntry or psar_longExit//   // //or KC_shortEntry// or WilliamsR_shortEntry//  //or cci_shortEntry //  // or  or MFI_shortEntry// or crossunder(close,psar)// (o4 < c4 and o3 < c3 and o2 < c2 and o1 < c1)


//longExit = shortEntry or psar_longExit // if not (ADX > th and )
//shortExit = longEntry or psar_shortExit // if not (ADX > th and )

////psar for trailing stops or some other measure? we must have a good trailing stop.

///////////////////////////////Strategy Execution

if testPeriod()
    strategy.entry("Long", strategy.long, when=longEntry)
    strategy.close("Long", when=shortEntry)

//if testPeriod()
//    strategy.entry("Long", strategy.long, when=longEntry)
//    strategy.exit("Exit Long", "Long", when=shortEntry)
//else
//    strategy.cancel("Long")
//if testPeriod()
//    strategy.entry("Short", strategy.short, when=shortEntry)
//    strategy.exit("Exit Short", "Short", when=longEntry)
//else
//    strategy.cancel("Long")

//Other Plots and Alerts
plotshape(MACD_longEntry2,  title= "3,7 Long Open", color=green, style=shape.circle)
plotshape(MACD_shortEntry2,  title= "3,7 Short Open", color=red, style=shape.circle)
//plotshape(Stoch_longEntry,  title= "Stoch Long Open", color=aqua, style=shape.circle)
//plotshape(Stoch_shortEntry,  title= "Stoch Short Open", color=orange, style=shape.circle)
//plotshape(buy,  title= "RES Long Open", color=green, location=location.belowbar, style=shape.circle)
///plotshape(sell,  title= "RES Short Open", color=red, location=location.belowbar, style=shape.circle)
//plotshape(MACD_longEntry, title= "12,26 Long Open", color=green, style=shape.arrowup, size=size.normal, location=location.belowbar)
//plotshape(MACD_shortEntry, title= "12,26 Short Open", color=red, style=shape.arrowdown, size=size.normal, location=location.abovebar)
//plotshape(MACD_longEntry, title= "12,26 Long Open", color=green, style=shape.diamond, size=size.tiny, location=location.belowbar)
//plotshape(MACD_shortEntry, title= "12,26 Short Open", color=red, style=shape.diamond, size=size.tiny, location=location.abovebar)

//plotchar(longCondition, location=bottom char="L", color=green)
//plotchar(shortCondition, char="S", color=red)
//alertcondition(longCondition, title="MFI+MACD Long", message="(MFI crossOver 30) or MACD+")
//alertcondition(shortCondition, title="MFI+MACD Short", message="(MFI crossUnder 70) or MACD-")
plot(sma300, color=purple, linewidth=4)