ڈائنامک گرڈ ٹریڈنگ کی حکمت عملی

جائزہ
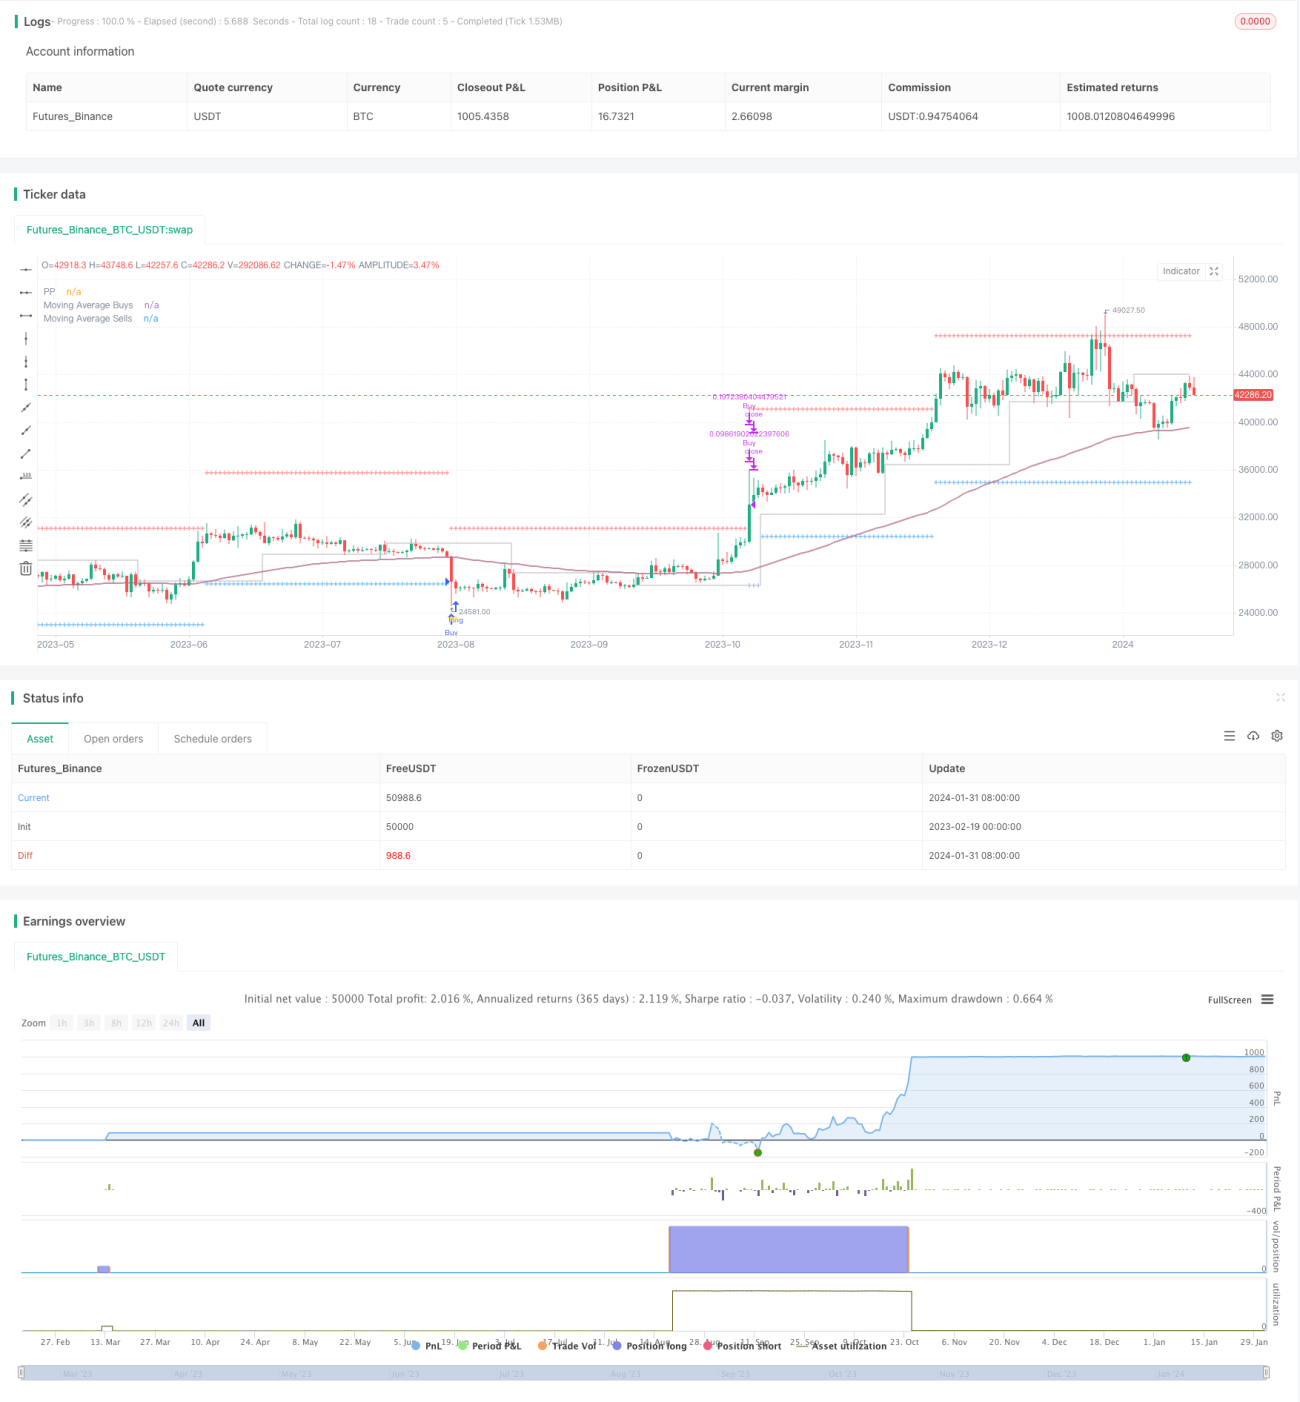
یہ پائن اسکرپٹ ایک طاقتور فریم ورک فراہم کرتا ہے جس کا استعمال ٹریڈنگ ویو میں گرڈ ٹریڈنگ حکمت عملی کی جانچ اور اصلاح کے لئے کیا جاتا ہے۔ یہ حکمت عملی.آرڈرز () فنکشن کا استعمال کرتا ہے تاکہ گرڈ ٹریڈنگ کو خودکار بنایا جاسکے اور اس کی جانچ کی جاسکے۔
حکمت عملی کا اصول
اس حکمت عملی کا بنیادی اصول ایک متحرک گرڈ پر مبنی ہے۔ گرڈ قیمتوں کی ایک سیریز پر مشتمل ہے جو خرید و فروخت کی پوزیشنوں کی رہنمائی کے لئے استعمال کیا جاتا ہے۔ جب قیمت ہر سطح کو توڑ دیتی ہے تو ، متعلقہ تجارتی عمل کو متحرک کیا جاتا ہے۔
خاص طور پر ، گرنے کے دوران ، سپورٹ لیول پر زیادہ خریداری میں داخل ہوجاتا ہے۔ تیزی کے دوران ، منافع حاصل کرنے کے لئے اہم مزاحمت کی سطح پر کھل جاتا ہے۔ گرڈ کی چوڑائی اور تناسب مارکیٹ کی اتار چڑھاؤ اور تجارتی طرز کے مطابق ایڈجسٹ ہوتا ہے۔
اس خودکار گرڈ ٹریڈنگ میکانزم کے ذریعہ ، مارکیٹ میں دو طرفہ اتار چڑھاؤ کے مواقع کو مؤثر طریقے سے فائدہ اٹھانا اور مستحکم مثبت منافع حاصل کرنا ممکن ہے۔
طاقت کا تجزیہ
اس حکمت عملی کے درج ذیل فوائد ہیں:
-
متحرک گرڈ: مارکیٹ کی حرکیات کو اپنانے کے لئے ، گرڈ کی قسم ، چوڑائی پیرامیٹرز اور بیس پوائنٹ کی قرارداد کو اپنی مرضی کے مطابق کیا جاسکتا ہے۔
-
ہوشیار خریداری کی حکمت عملی: خریداری کے مختلف طریقوں کی فراہمی ، خریداری کی مقدار کو ایڈجسٹ کرنا ، خریداری کی پوزیشن کو کنٹرول کرنا۔
-
اسٹریٹجک فروختمنافع کو بہتر بنانے کے لئے: مقدار کی ترتیب، فروخت کی پوزیشن کو کنٹرول کرنے، اور روکنے کے نقصان کی شرائط کو ترتیب دینے کے ذریعے.
-
توانائی کے تمام معاملات: مختلف ٹریڈنگ کی ترجیحات کو پورا کرنے کے لئے نقد اور گارنٹی ٹریڈنگ کا انتخاب کریں۔
-
اعلی مرضی کے مطابق: ابتدائی فنڈ ، انکوائری کی شرح ، گارنٹی کی شرح اور دیگر پیرامیٹرز کو بہتر بنانے کے لئے ایڈجسٹ کیا جاسکتا ہے۔
-
انفارمیشن پینلاس کے علاوہ ، اس نے اپنے بلاگ میں لکھا ہے کہ:
خطرے کا تجزیہ
اگرچہ یہ حکمت عملی بہت طاقتور ہے، لیکن اس کے ساتھ ساتھ اس کے استعمال میں کچھ خطرات بھی ہیں:
-
ریپیٹ کی حدودان کا کہنا تھا کہ ماضی کی کارکردگی مستقبل کے نتائج کی مکمل پیش گوئی نہیں کر سکتی اور منافع کی کوئی ضمانت نہیں ہے۔
-
مارکیٹ میں اتار چڑھاؤان کا کہنا تھا کہ 'اس طرح کی قیمتوں میں غیر متوقع تبدیلیاں ہوسکتی ہیں اور اس سے حکمت عملی پر اثر پڑتا ہے۔'
-
ایکسچینج کے مسائل: ایکسچینج سسٹم کی خرابی کے نتیجے میں آرڈر کی ناکامی ، عملدرآمد میں تاخیر وغیرہ ہوسکتی ہے۔
-
نظام کی خرابی: احکامات ، مواصلات اور وصولی کے نتائج پیدا کرنے کے لئے استعمال ہونے والے سسٹم میں خرابی ہوسکتی ہے ، جس سے لین دین کا عمل رک جاتا ہے۔
-
وقت کی تاخیرٹائم لیٹ ہونے کی وجہ سے غیر معمولی نتائج سامنے آسکتے ہیں۔
ان خطرات کو اچھی طرح سے سمجھنے ، احتیاط سے کام کرنے ، اور حکمت عملی کو مناسب طریقے سے ایڈجسٹ کرنے کی ضرورت ہے تاکہ محفوظ الگورتھم ٹریڈنگ کی جاسکے۔
اصلاح کی سمت
اس حکمت عملی کو مزید بہتر بنانے کے لئے:
-
اسٹاپ نقصان کی منطق شامل کریں ، انتہائی قیمتوں میں نقصانات کو کم کریں۔
-
مشین لرننگ الگورتھم کے ساتھ مل کر ، گرڈ پیرامیٹرز کی متحرک ایڈجسٹمنٹ کو لاگو کرنا۔
3۔ فیصلہ سازی کے معیار کو بہتر بنانے کے لئے کوانٹیکٹیو اشارے متعارف کروائیں ، رجحانات اور اہم قیمتوں کی نشاندہی کریں۔
4 ۔ خطرے کے کنٹرول کے ماڈیول کو بڑھانا تاکہ ضمانتوں کے لین دین پر وصولی کے خطرے کو روکا جا سکے۔
5۔ ٹائم سائیکل تجزیہ متعارف کرانے اور ٹرانزیکشن فیصلوں کی وقت کی کارکردگی کو بہتر بنانے کے لئے۔
ان اصلاحات کی وجہ سے یہ حکمت عملی ریٹرننگ اور ریئل ٹائم میں بہتر کارکردگی کا مظاہرہ کرے گی۔
خلاصہ کریں۔
پائن اسکرپٹ گرڈ حکمت عملی کی جانچ اور اصلاح کے لئے ایک مضبوط فریم ورک مہیا کرتا ہے۔ اگرچہ یہ طاقتور ہے ، لیکن اس کے عملی نفاذ میں تھوڑی دیر لگتی ہے۔ اگر احتیاط اور خطرے کی اچھی طرح سے جانچ پڑتال کی جائے تو یہ حکمت عملی خود کار طریقے سے گرڈ ٹریڈنگ کا ایک مؤثر ذریعہ بن سکتی ہے ، جس سے آپ کو مالیاتی منڈیوں میں مستحکم منافع حاصل کرنے میں مدد ملے گی۔
/*backtest
start: 2023-02-19 00:00:00
end: 2024-02-01 05:20:00
period: 1d
basePeriod: 1h
exchanges: [{"eid":"Futures_Binance","currency":"BTC_USDT"}]
*/

// This source code is subject to the terms of the Mozilla Public License 2.0 at https://mozilla.org/MPL/2.0/
// © AssassinsGrid

// Embark on an automated grid-based trading journey with this Pine script tailored for backtesting in TradingView using strategy.orders().- 1