
4
Follow
1
Followers
Xin hãy hỏi.
-
Tôi đã cố gắng tạo 2 đối tượng chart, mỗi đối tượng có thể thêm dữ liệu và mỗi đối tượng có thể thêm dữ liệu và mỗi đối tượng có thể thêm dữ liệu.
Có vẻ như nó không hoạt động, hoặc hiển thị trên một biểu đồ. -
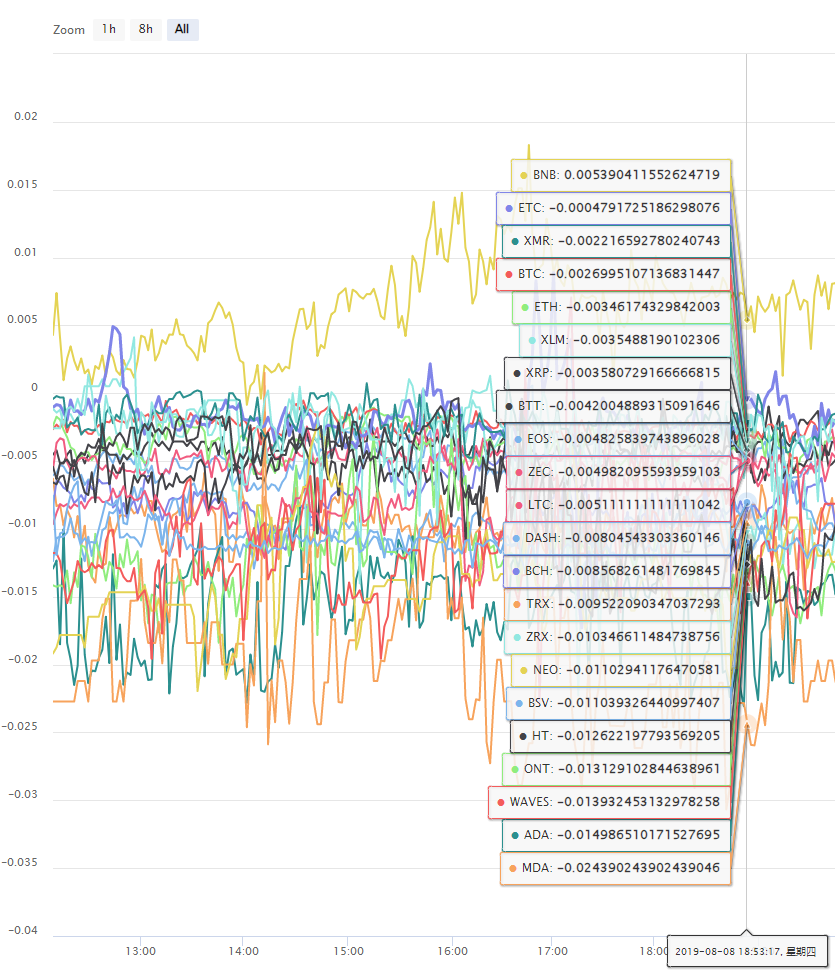
Nếu một bảng hiển thị nhiều đường cong, nó sẽ không hiển thị rõ ràng (như trong hình dưới đây), có thể tùy chọn chuyển đổi mỗi đường cong visable?
Cảm ơn các bạn.
Related Recommendations
Get Started with FMZ Quant PlatformSECURITY BUGI keep getting error: Exchange_GetAccount: Invalid ContractTypeWe have an incredibly profitable market making algorithm for sideways markets on Bitmex - but need expert to help eliminate wait times during downward volatility in the marketError with deribitLimitations of the backtesting engineHow to install ta-lib on linux docker?5.5 Trading strategy optimization5.4 Why do we need an off-sample test5.3 How to read the strategy backtest performance report
Comment
All comments (3)

可以显示两个图表,在策略广场有范例:
https://www.fmz.com/strategy/136056
https://www.fmz.com/strategy/38203
7 years ago
- 1