Chiến lược Robot có thể mở rộng HTF MACD MFI không sơn lại tùy chỉnh
Tổng quan
Chiến lược này là một chiến lược kết hợp các chỉ số MACD và MFI không được vẽ lại có thể tùy chỉnh cao, được áp dụng cho robot giao dịch thuật toán. Nó kết hợp các chỉ số xu hướng và động lực để tạo ra tín hiệu giao dịch thông qua nhiều bộ lọc.
Nguyên tắc chiến lược
Chiến lược này sử dụng MACD để xác định xu hướng của thị trường. MACD là một chỉ số động lực theo xu hướng, được lấy từ đường trung bình di chuyển nhanh trừ đường trung bình di chuyển chậm để có được biểu đồ hình trụ MACD, sau đó sử dụng đường trung bình di chuyển chỉ số của MACD để có được đường tín hiệu.
Ngoài ra, chiến lược này cũng sử dụng chỉ số MFI để đánh giá tình trạng quá mua quá bán của thị trường. Chỉ số MFI kết hợp thông tin về giá cả và khối lượng giao dịch, giá trị dao động từ 0 đến 100. MFI dưới 20 là khu vực quá bán và trên 80 là khu vực quá mua.
Để lọc các tín hiệu giả mạo, chiến lược này cũng thêm vào bộ lọc xu hướng và bộ lọc RSI. Nó tạo ra tín hiệu mua khi giá đang trong xu hướng tăng và RSI nhỏ hơn so với ngưỡng đặt.
Lợi thế chiến lược
- Kết hợp nhiều chỉ số, đánh giá tổng hợp tình trạng thị trường, tăng tỷ lệ thắng
- Thêm bộ lọc để tránh tín hiệu giả và giảm giao dịch không cần thiết
- Các tham số và bộ lọc có thể được cấu hình tùy chỉnh để phù hợp với các giống và sở thích giao dịch khác nhau
- Có thể được sử dụng để giao dịch bằng tay hoặc kết nối với robot thuật toán để giao dịch theo chương trình
Rủi ro chiến lược và giải pháp
Thiết lập tham số chỉ số không đúng dễ tạo ra tín hiệu giả
Có thể thử nghiệm các tham số khác nhau, chọn các tham số kết hợp tốt nhất
Các tham số đa giống không phổ biến, cần kiểm tra và tối ưu hóa riêng biệt
Tần suất giao dịch có thể quá cao, làm tăng chi phí giao dịch và rủi ro trượt
Bộ lọc có thể điều chỉnh để giảm tần suất giao dịch
Kiểm soát chi phí khi giao dịch trực tiếp
Hướng tối ưu hóa chiến lược
- Kiểm tra chu kỳ dữ liệu dài hơn, đánh giá tính ổn định của tham số
- Cố gắng kết hợp các tham số chỉ số khác
- Tối ưu hóa trọng lượng chỉ số, tăng cường ổn định chiến lược
- Thêm nhiều bộ lọc để giảm giao dịch không cần thiết
Tóm tắt
Chiến lược này là một chiến lược theo dõi xu hướng có thể được tùy chỉnh cao, kết hợp với xu hướng và các chỉ số động lực để đánh giá tình trạng thị trường và sử dụng hiệu quả các cơ chế lọc để kiểm soát rủi ro. Nó có thể được sử dụng để giao dịch bằng tay hoặc kết nối với robot thuật toán để thực hiện giao dịch có tính tự động cao, một hệ thống chiến lược tối ưu đáng để theo dõi lâu dài.
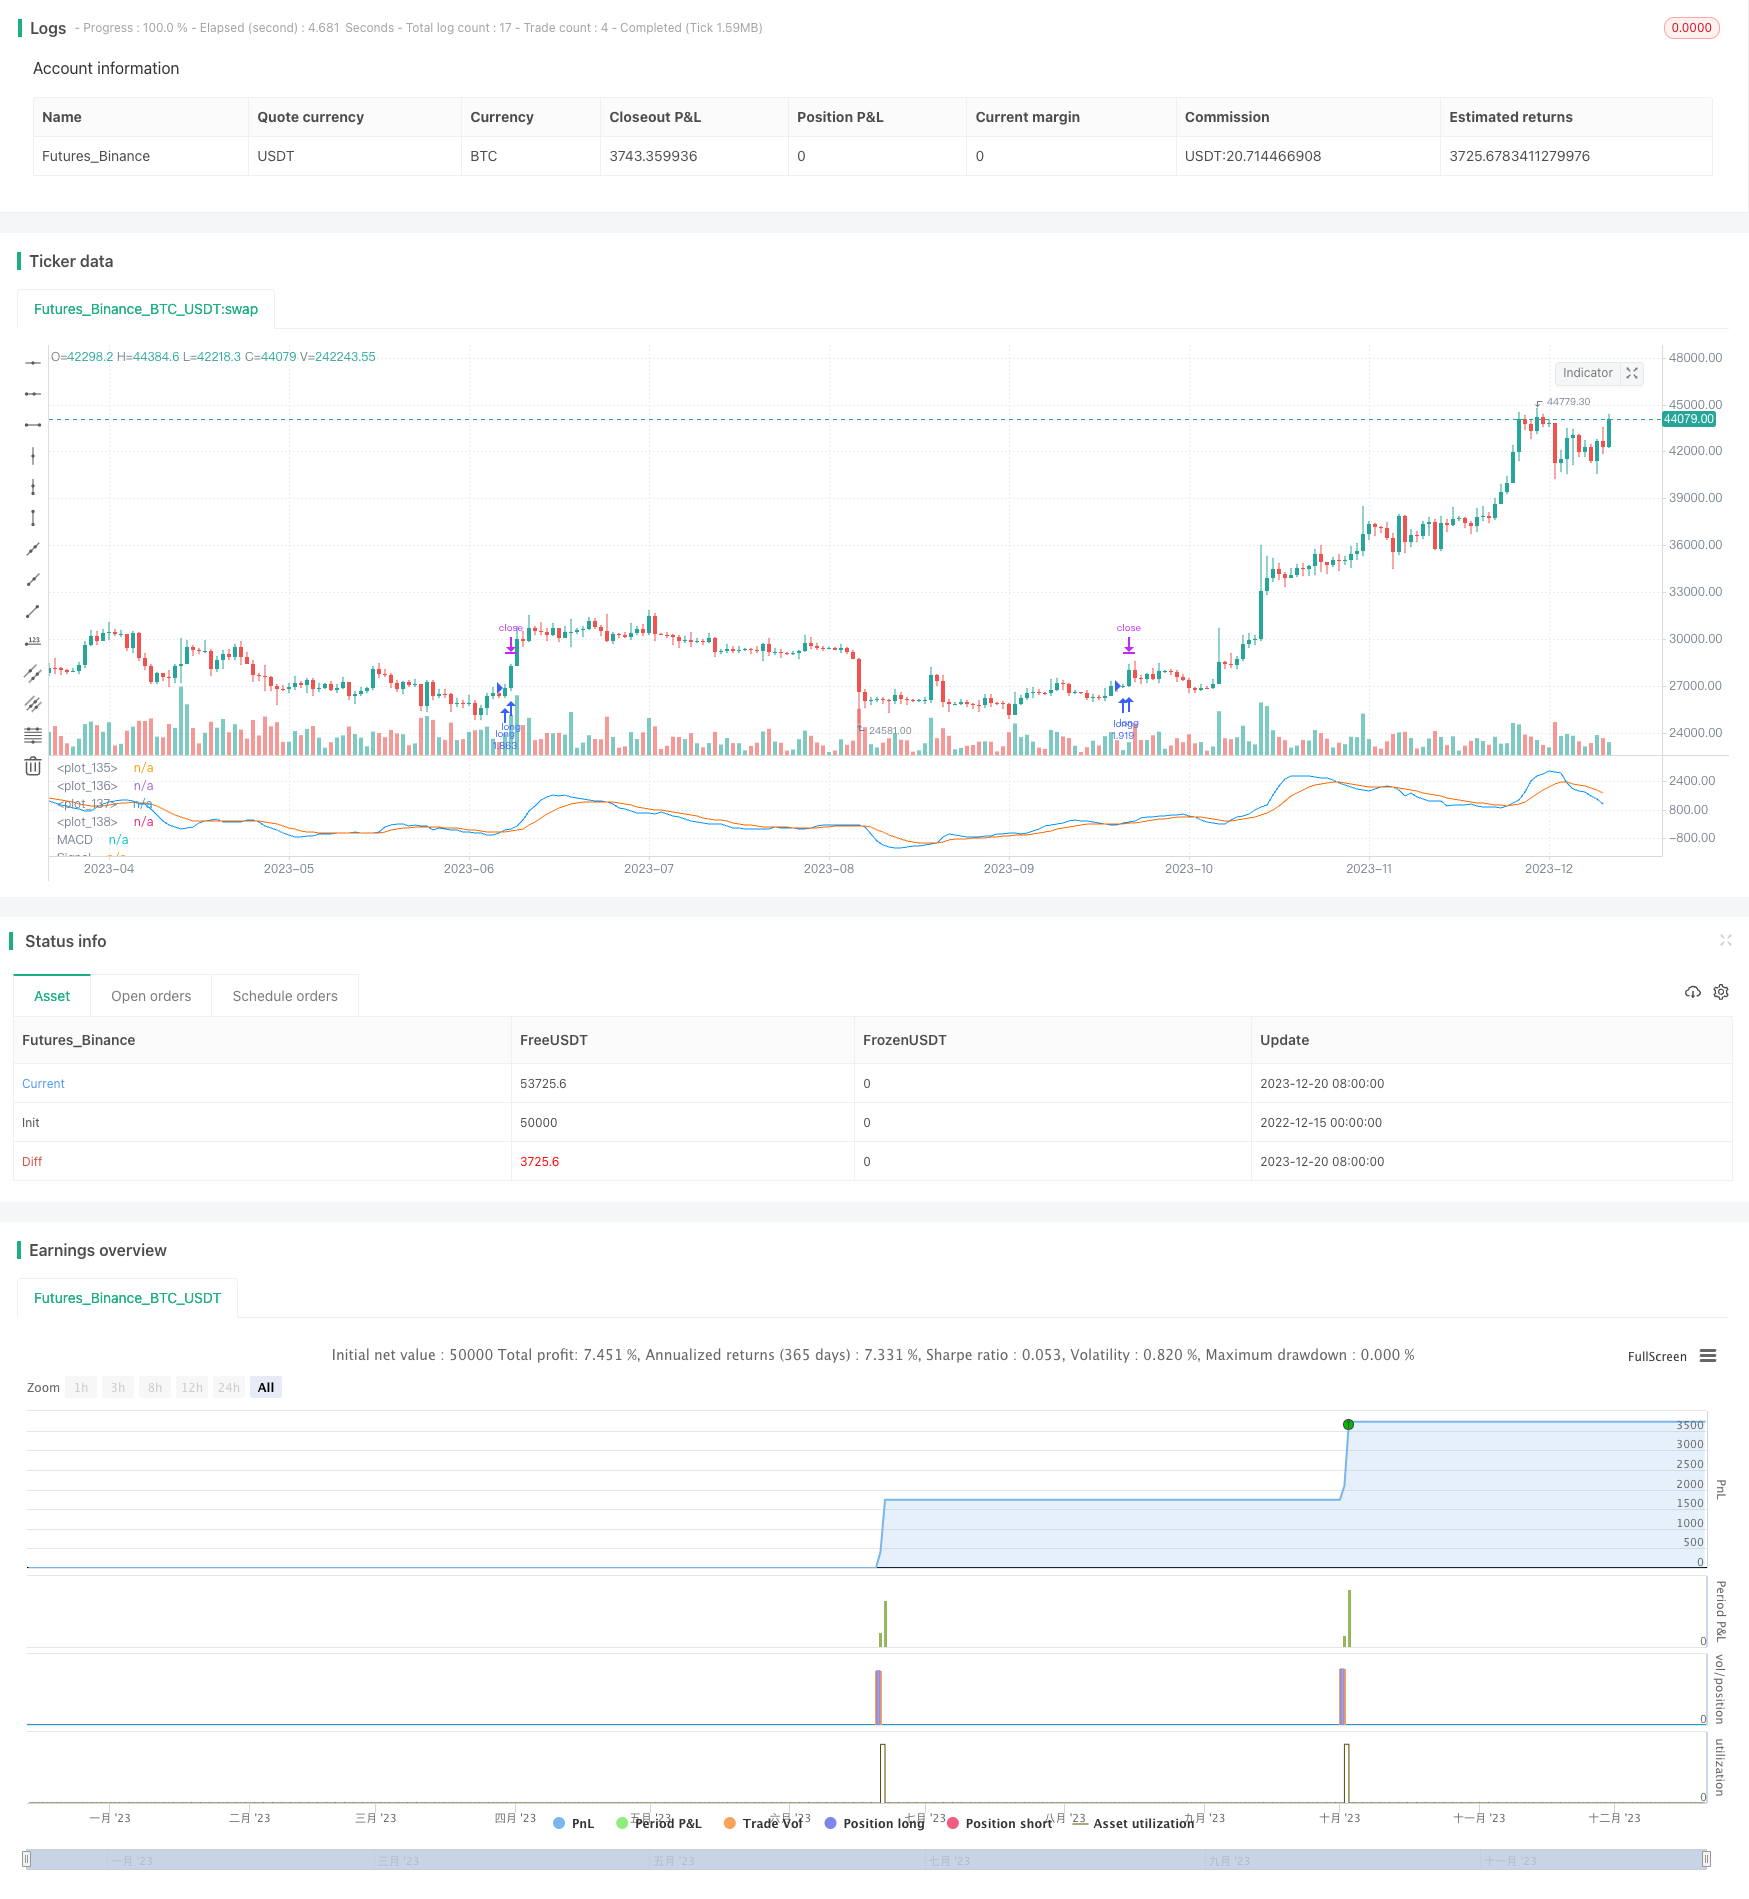
/*backtest
start: 2022-12-15 00:00:00
end: 2023-12-21 00:00:00
period: 1d
basePeriod: 1h
exchanges: [{"eid":"Futures_Binance","currency":"BTC_USDT"}]
*/

//(c) Wunderbit Trading
//Modified by Mauricio Zuniga - Trade at your own risk
//This script was originally shared on Wunderbit website as a free open source script for the community. (https://help.wundertrading.com/en/articles/5246468-macd-mfi-trading-bot-for-ftx)
//
//WHAT THIS SCRIPT DOES:
//   This is a scalping script originally intended to be used on altorightmic bot trading.
//   This strategy is based on the trend-following momentum indicator. It includes the Money Flow index as an additional point for entry.
//HOW IT DOES IT:
//   It uses a combination of MACD and MFI indicators to create entry signals.  Parameters for each indicator have been surfaced for user configurability.
//   Take profits are fixed, but stop loss uses ATR configuration to minimize losses and close profitably.
//HOW IS MY VERSION ORIGINAL:
//   I started trying to deploy this script myself in my algorithmic tradingg but ran into some issues which I have tried to address in this version.
//   Delayed Signals : The script has been refactored to use a time frame drop down.  The higher time frame can be run on a faster chart (recommended on one minute chart for fastest signal confirmation and relay to algotrading platform.
//   Repainting Issues : All indicators have been recoded to use the security function that checks to see if the current calculation is in realtime, if it is, then it uses the previous bar for calculation.
//   If you are still experiencing repainting issues based on intended (or non intended use), please provide a report with screenshot and explanation so I can try to address.
//   Filtering :  I have added to additional filters an ABOVE EMA Filter and a BELOW RSI Filter (both can be turned on and off)
//   Customizable Long and Clos Messages : This allows someone to use the script for algorithmic trading without having to alter code.  It also means you can use one indicator for all of your different alterts required for your bots.
//HOW TO USE IT:
//   Find a pair with high volatility - I have found it works particularly well with 3L and 3S tokens for crypto. although it the limitation is that confrigurations I have found to work typically have low R/R ratio, but very high win rate and profit factor.
//   Ieally set one minute chart for bots, but you can use other charts for manual trading.  The signal will be delayed by one bar but I have found configurations that still test well.
//   Select a time frame in configuration for your indicator calculations.
//   I like ot use 5 and 15 minutes for scalping scenarios, but I am interested in hearing back from other community memebers.
//   Optimize your indicator without filters (trendFilter and RSI Filter)
//   Use the TrendFilter and RSI Filter to further refine your signals for entry.

//@version=4
strategy("Customizable HTF MACD Strategy v1.2", overlay=false, pyramiding=0, commission_type=strategy.commission.percent, commission_value=0.07, default_qty_type = strategy.percent_of_equity, default_qty_value = 100, currency = currency.USD)

openlongcomment = "Comment In Here"
closelongcomment = ""
openshortcomment = ""
closeshortcommment = ""
//RES
res = input(title="Resolution", type=input.resolution, defval="5", group="Strategy", inline="1")
comment = input(title="Open Long Comment", type=input.string, defval="",group="Strategy", inline="1")

if not(comment == "")
    openlongcomment := comment
// FUNCTIONS

Ema(src,p) =>
    ema = 0.
    sf = 2/(p+1)
    ema := nz(ema[1] + sf*(src - ema[1]),src)

Sma(src,p) => a = cum(src), (a - a[max(p,0)])/max(p,0)

Atr(p, res) =>
    atr = 0.
    highHTF = security(syminfo.tickerid, res, high[barstate.isrealtime ? 1 : 0])
    lowHTF = security(syminfo.tickerid, res, low[barstate.isrealtime ? 1 : 0])
    closeHTF = security(syminfo.tickerid, res, close[barstate.isrealtime ? 1 : 0])
    Tr = max(highHTF - lowHTF, max(abs(highHTF - closeHTF[1]), abs(lowHTF - closeHTF[1])))
    atr := nz(atr[1] + (Tr - atr[1])/p,Tr)


ribbon_period = input(39, "Period", step=1)

htfClose = security(syminfo.tickerid, res, close[barstate.isrealtime ? 1 : 0])

leadLine1 = ema(htfClose, ribbon_period)
leadLine2 = sma(htfClose, ribbon_period)

// p3 = plot(leadLine1, color= #53b987, title="EMA", transp = 50, linewidth = 1)
// p4 = plot(leadLine2, color= #eb4d5c, title="SMA", transp = 50, linewidth = 1)
// fill(p3, p4, transp = 60, color = leadLine1 > leadLine2 ? #53b987 : #eb4d5c)

//Upward Trend
UT=leadLine2 < leadLine1
DT=leadLine2>leadLine1
//FILTER LOGIC
aboveTrend = input(true, title="Use Trend", group="Filters", inline='1', type=input.bool)
TrendLength  = input(3, minval=1, title="Trend MA", group="Filters", inline='1', type=input.integer)
aboveTrendFilter = sma(htfClose,TrendLength)

useRSI = input(true, title="Use RSI", group="Filters", inline='2', type=input.bool)
RSILength  = input(34, minval=1, title="RSI Length", group="Filters", inline='2') // used to calculate RSI
belowRSIFilter  = input(50, minval=1, title="Buy Below RSI Filter", group="Filters", inline='2') // only buy if its below this RSI - doesn't seem to work as expected
rsi = rsi(htfClose,RSILength)

if not(useRSI)
    belowRSIFilter = 100
if not(aboveTrend)
    aboveTrendFilter = -1


// MACD
fast_length = input(title="Fast Length", type=input.integer, defval=7)
slow_length = input(title="Slow Length", type=input.integer, defval=23)
src = input(title="Source", type=input.source, defval=close)
signal_length = input(title="Signal Smoothing", type=input.integer, minval = 1, maxval = 50, defval = 10)
sma_source = input(title="Simple MA(Oscillator)", type=input.bool, defval=false)
sma_signal = input(title="Simple MA(Signal Line)", type=input.bool, defval=false)

// Plot colors
col_grow_above = #26A69A
col_grow_below = #FFCDD2
col_fall_above = #B2DFDB
col_fall_below = #EF5350
col_macd = #0094ff
col_signal = #ff6a00


srcHTF = security(syminfo.tickerid, res, src[barstate.isrealtime ? 1 : 0])
// Calculating
fast_ma = sma_source ? Sma(srcHTF, fast_length) : Ema(srcHTF, fast_length)
slow_ma = sma_source ? Sma(srcHTF, slow_length) : Ema(srcHTF, slow_length)

macd = fast_ma - slow_ma
signal = sma_signal ? Sma(macd, signal_length) : Ema(macd, signal_length)
hist = macd - signal

//plot(hist, title="Histogram", style=plot.style_columns, color=(hist>=0 ? (hist[1] < hist ? col_grow_above : col_fall_above) : (hist[1] < hist ? col_grow_below : col_fall_below) ), transp=0 )
plot(macd, title="MACD", color=col_macd, transp=0)
plot(signal, title="Signal", color=col_signal, transp=0)

/// MFI

MFIsource = hlc3
sourceHTF = security(syminfo.tickerid, res, MFIsource[barstate.isrealtime ? 1 : 0])
length = input(15, minval=1)
lower = input(12, minval=0, maxval=50)
upper = input(80, minval=50, maxval=100)

// DrawMFI_f=input(true, title="Draw MFI?", type=bool)
HighlightBreaches=input(true, title="Highlight Oversold/Overbought?")

volumeHTF = security(syminfo.tickerid, res, volume[barstate.isrealtime ? 1 : 0])

// MFI
upper_s = sum(volumeHTF * (change(sourceHTF) <= 0 ? 0 : sourceHTF), length)
lower_s = sum(volumeHTF * (change(sourceHTF) >= 0 ? 0 : sourceHTF), length)
mf = rsi(upper_s, lower_s)
mfp = plot(mf, color=color.new(color.gray,0), linewidth=1)
top = hline(upper, color=color.new(color.gray, 100), linewidth=1, editable=false)
bottom = hline(lower, color=color.new(color.gray,100), linewidth=1, editable=false)
hline(0, color=color.new(color.black,100), editable=false)
hline(100, color=color.new(color.black,100), editable=false)

// Breaches
b_color = (mf > upper) ? color.new(color.red,70) : (mf < lower) ? color.new(color.green,60) : na
bgcolor(HighlightBreaches ? b_color : na)

fill(top, bottom, color=color.gray, transp=75)

// TAKE PROFIT AND STOP LOSS
long_tp1_inp = input(1, title='Long Take Profit 1 %', step=0.1)/100
long_tp1_qty = input(20, title="Long Take Profit 1 Qty", step=1)

long_trailing = input(1.3, title='Trailing Stop Long', step=0.1) / 100

long_take_level_1 = strategy.position_avg_price * (1 + long_tp1_inp)

// Stop Loss
multiplier = input(2, "SL Mutiplier", minval=1, step=0.1)
ATR_period=input(40,"ATR period", minval=1, step=1)

// Strategy
entry_long=(crossover(macd,signal) or (crossover(mf,lower) and leadLine2 < leadLine1)) and rsi < belowRSIFilter and close > aboveTrendFilter
entry_price_long=valuewhen(entry_long,close,0)
//SL_floating_long = entry_price_long -( (entry_price_long)*multiplier/100)//*Atr(ATR_period,res)
//SL_floating_long = entry_price_long - multiplier*Atr(ATR_period,res)
SL_floating_long = entry_price_long - multiplier*Atr(ATR_period,res)
exit_long= close < SL_floating_long

///// BACKTEST PERIOD ///////
testStartYear = input(2018, "Backtest Start Year")
testStartMonth = input(1, "Backtest Start Month")
testStartDay = input(1, "Backtest Start Day")
testPeriodStart = timestamp(testStartYear, testStartMonth, testStartDay, 0, 0)

testStopYear = input(9999, "Backtest Stop Year")
testStopMonth = input(12, "Backtest Stop Month")
testStopDay = input(31, "Backtest Stop Day")
testPeriodStop = timestamp(testStopYear, testStopMonth, testStopDay, 0, 0)

testPeriod() =>
    time >= testPeriodStart and time <= testPeriodStop ? true : false

if testPeriod()
    if UT
        strategy.entry("long", strategy.long, when=entry_long == true, comment=openlongcomment)
    strategy.exit("TP1","long", qty_percent=long_tp1_qty, limit=long_take_level_1)
    strategy.exit("Trail stop","long",  comment=closelongcomment,  trail_points=entry_price_long * long_trailing / syminfo.mintick, trail_offset=entry_price_long * long_trailing / syminfo.mintick)
    strategy.close("long", exit_long == true,  comment=closelongcomment )