Chiến lược giao dịch dựa trên kênh EMA 20 ngày
Ngày tạo:
2024-01-30 15:24:07
sửa đổi lần cuối:
2024-01-30 15:24:07
sao chép:
2
Số nhấp chuột:
1280
1
tập trung vào
1750
Người theo dõi
Tổng quan
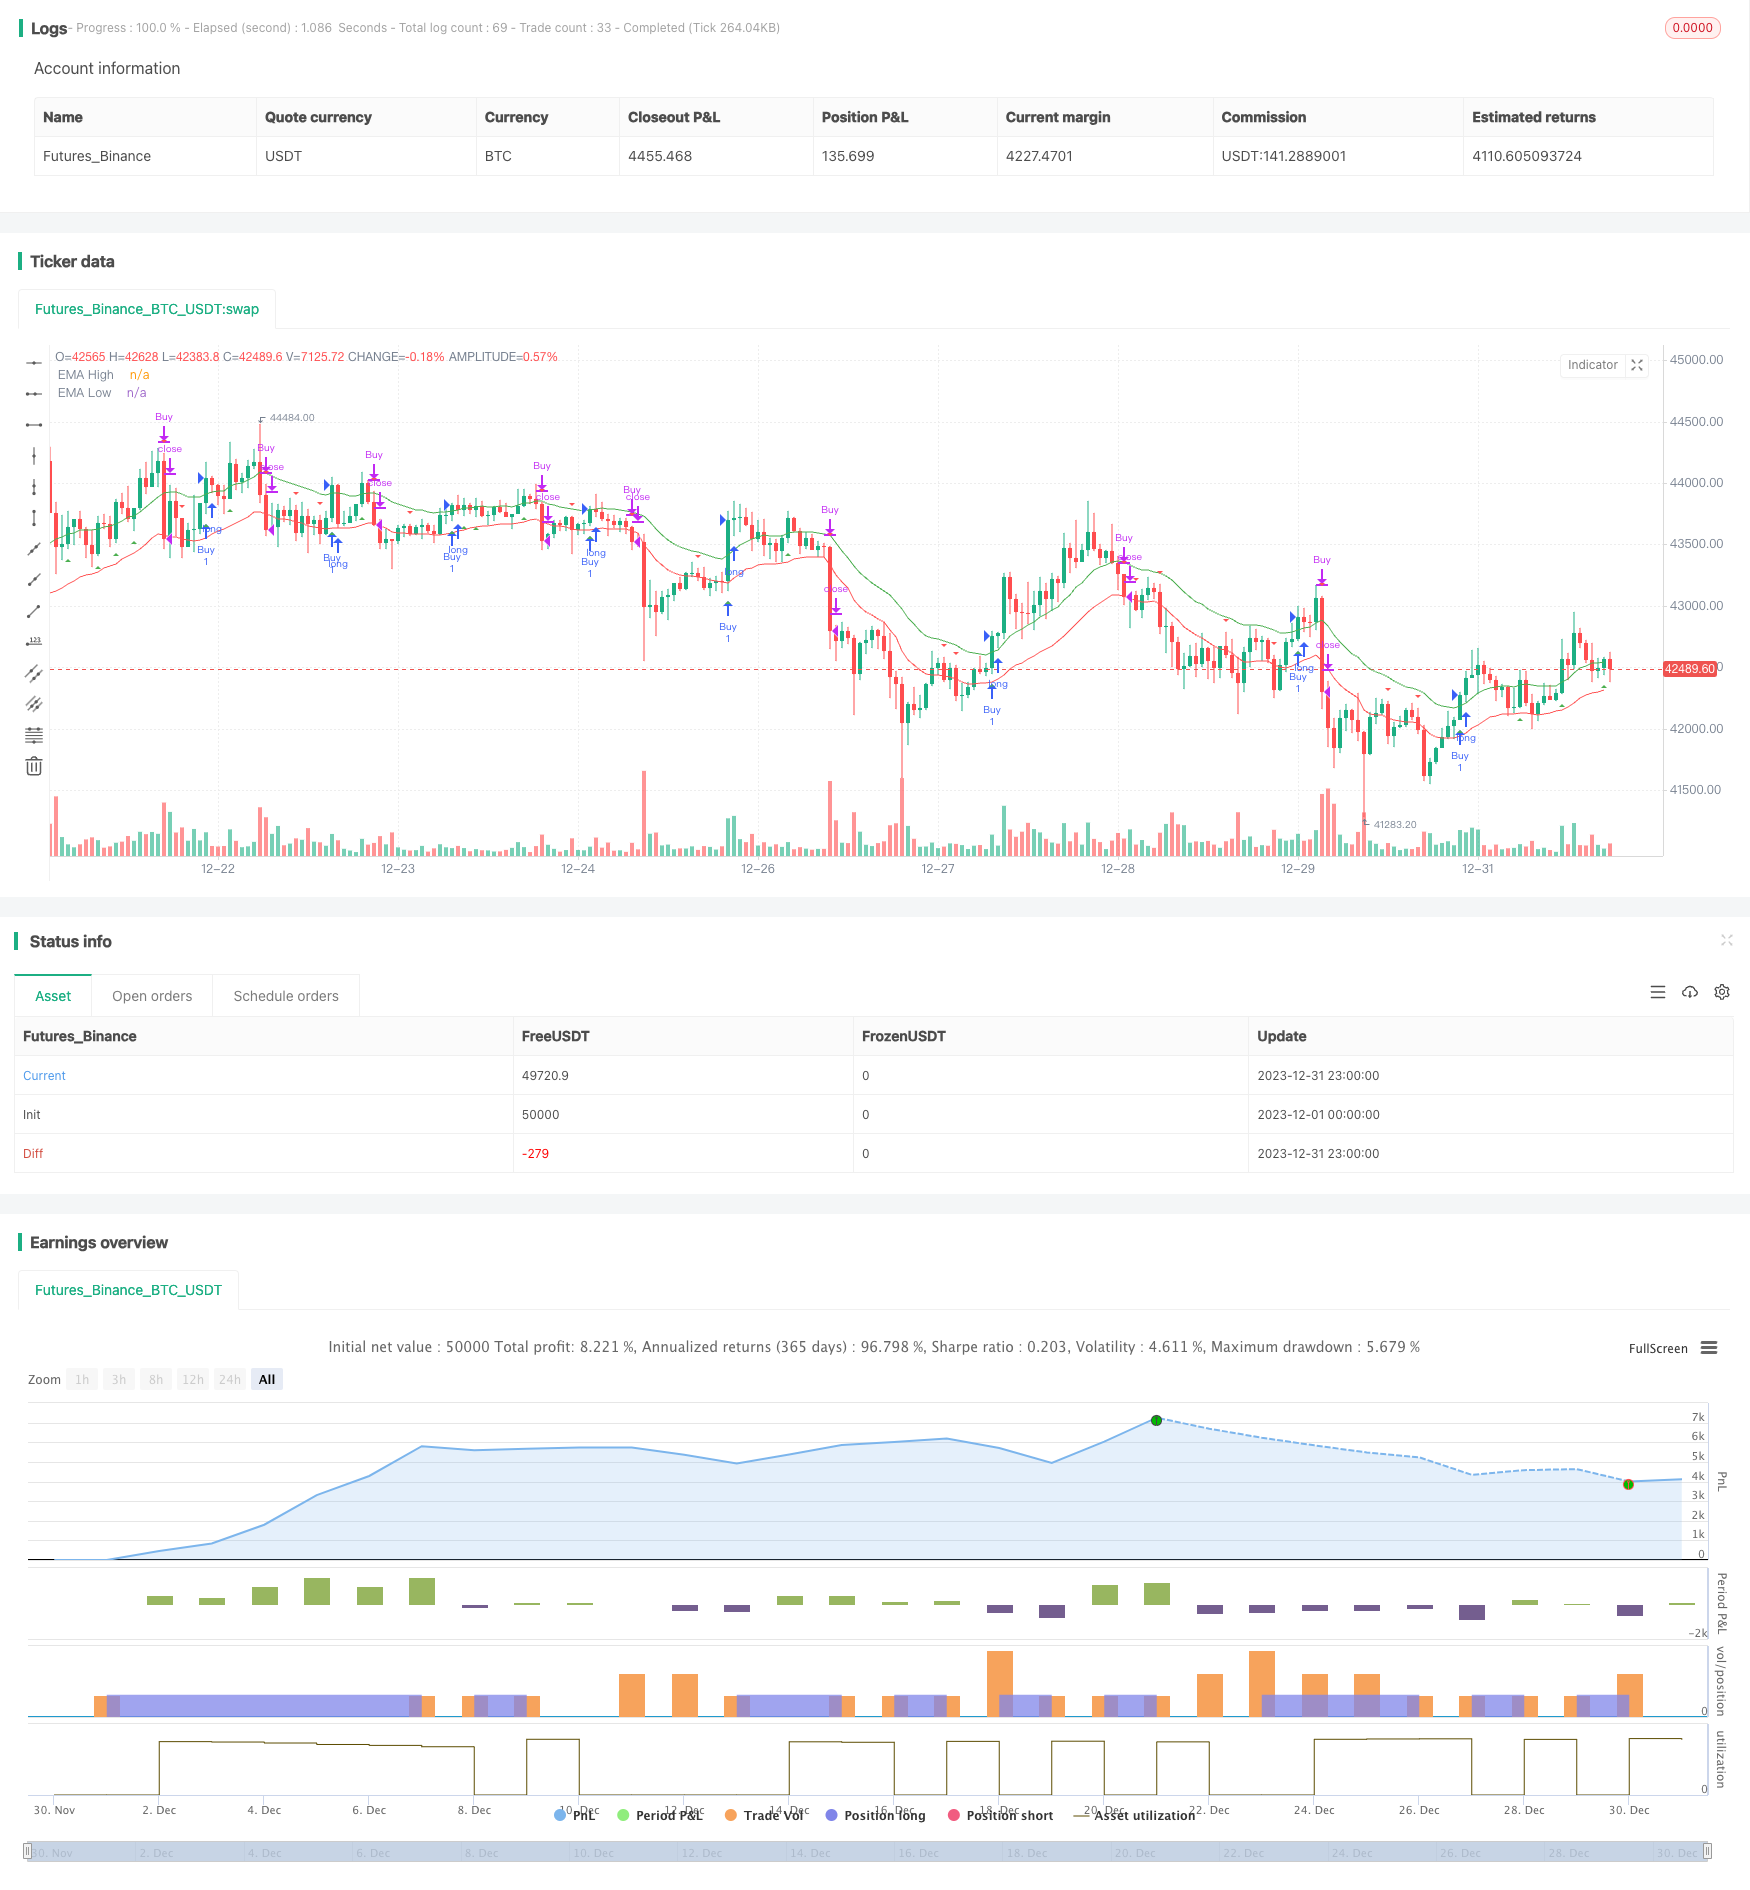
Chiến lược này dựa trên đường dẫn xây dựng đường dẫn ((EMA) 20 ngày, làm nhiều khi giá phá vỡ đường dẫn trên và làm rỗng khi giá giảm xuống đường dẫn dưới, thuộc chiến lược theo dõi xu hướng.
Nguyên tắc chiến lược
- Tính toán các điểm cao và thấp của EMA 20 ngày, xây dựng các kênh.
- Khi giá đóng cửa cao hơn mức EMA ngày 20, hãy làm nhiều hơn.
- Khi giá đóng cửa dưới mức thấp của EMA ngày 20, hãy thực hiện lệnh phá sản.
- Điểm dừng là ở đầu kia của kênh, ví dụ như dừng thêm là điểm thấp của EMA ngày 20.
Phân tích lợi thế
- Sử dụng EMA để xây dựng các kênh để theo dõi các xu hướng hiệu quả.
- Các tham số EMA ngày 20 đơn giản và thực tế.
- Sử dụng đột phá để báo hiệu, có thể làm giảm giao dịch sai.
- Đặt điểm dừng hợp lý để kiểm soát rủi ro tối đa.
Phân tích rủi ro
- Các tín hiệu đột phá có thể gây ra báo cáo sai.
- Những người dân địa phương thường bị ảnh hưởng bởi trận động đất.
- Các tham số không đúng có thể dẫn đến quá nhạy cảm hoặc chậm trễ.
Phương pháp giải quyết rủi ro:
- Kết hợp với các chỉ số khác để lọc tín hiệu.
- Các tham số tối ưu hóa, thích ứng với các chu kỳ khác nhau.
- Hãy cẩn thận và quản lý tài chính.
Hướng tối ưu hóa
- Hình thức lọc kết hợp với chỉ số giá cả là một dấu hiệu sai.
- Kiểm tra hiệu quả của các tham số khác nhau của chu kỳ EMA.
- Tăng lỗ di động để khóa lợi nhuận.
- Trong khi đó, các chỉ số về tỷ lệ biến động cho thấy xu hướng mạnh mẽ.
Tóm tắt
Chiến lược này nói chung là đơn giản và thực tế, được xây dựng dựa trên kênh EMA, thuộc chiến lược theo dõi xu hướng điển hình. Nó có đặc điểm làm tín hiệu đột phá, nhưng cũng có một số rủi ro báo cáo sai. Có thể tăng hiệu quả của chiến lược bằng cách tối ưu hóa tham số, thêm bộ lọc, v.v.
Mã nguồn chiến lược
/*backtest
start: 2023-12-01 00:00:00
end: 2023-12-31 23:59:59
period: 1h
basePeriod: 15m
exchanges: [{"eid":"Futures_Binance","currency":"BTC_USDT"}]
*/

//@version=4
strategy("EMA Channel Strategy with Alerts", shorttitle="EMA Channel", overlay=true)

// Define EMA length
emaLength = 20

// Calculate EMA values
emaHigh = ema(high, emaLength)
emaLow = ema(low, emaLength)

// Define the condition for a buy signal
buyCondition = crossover(close, emaHigh)

// Define the condition for a sell signal
sellCondition = crossunder(close, emaLow)

// Plot the EMA lines
plot(emaHigh, color=color.green, title="EMA High")
plot(emaLow, color=color.red, title="EMA Low")

// Plot buy and sell signals
plotshape(buyCondition, style=shape.triangleup, location=location.belowbar, color=color.green, title="Buy Signal")
plotshape(sellCondition, style=shape.triangledown, location=location.abovebar, color=color.red, title="Sell Signal")

// Strategy
strategy.entry("Buy", strategy.long, when=buyCondition)
strategy.close("Buy", when=sellCondition)

// Define and trigger alerts
alertcondition(buyCondition, title="Buy Alert", message="Buy signal - Price crossed above EMA High")
alertcondition(sellCondition, title="Sell Alert", message="Sell signal - Price crossed below EMA Low")