Chiến lược theo dõi xu hướng chỉ số sức mạnh tương đối đã sửa đổi
Ngày tạo:
2024-03-29 16:16:37
sửa đổi lần cuối:
2024-03-29 16:16:37
sao chép:
10
Số nhấp chuột:
728
1
tập trung vào
1750
Người theo dõi
Tổng quan
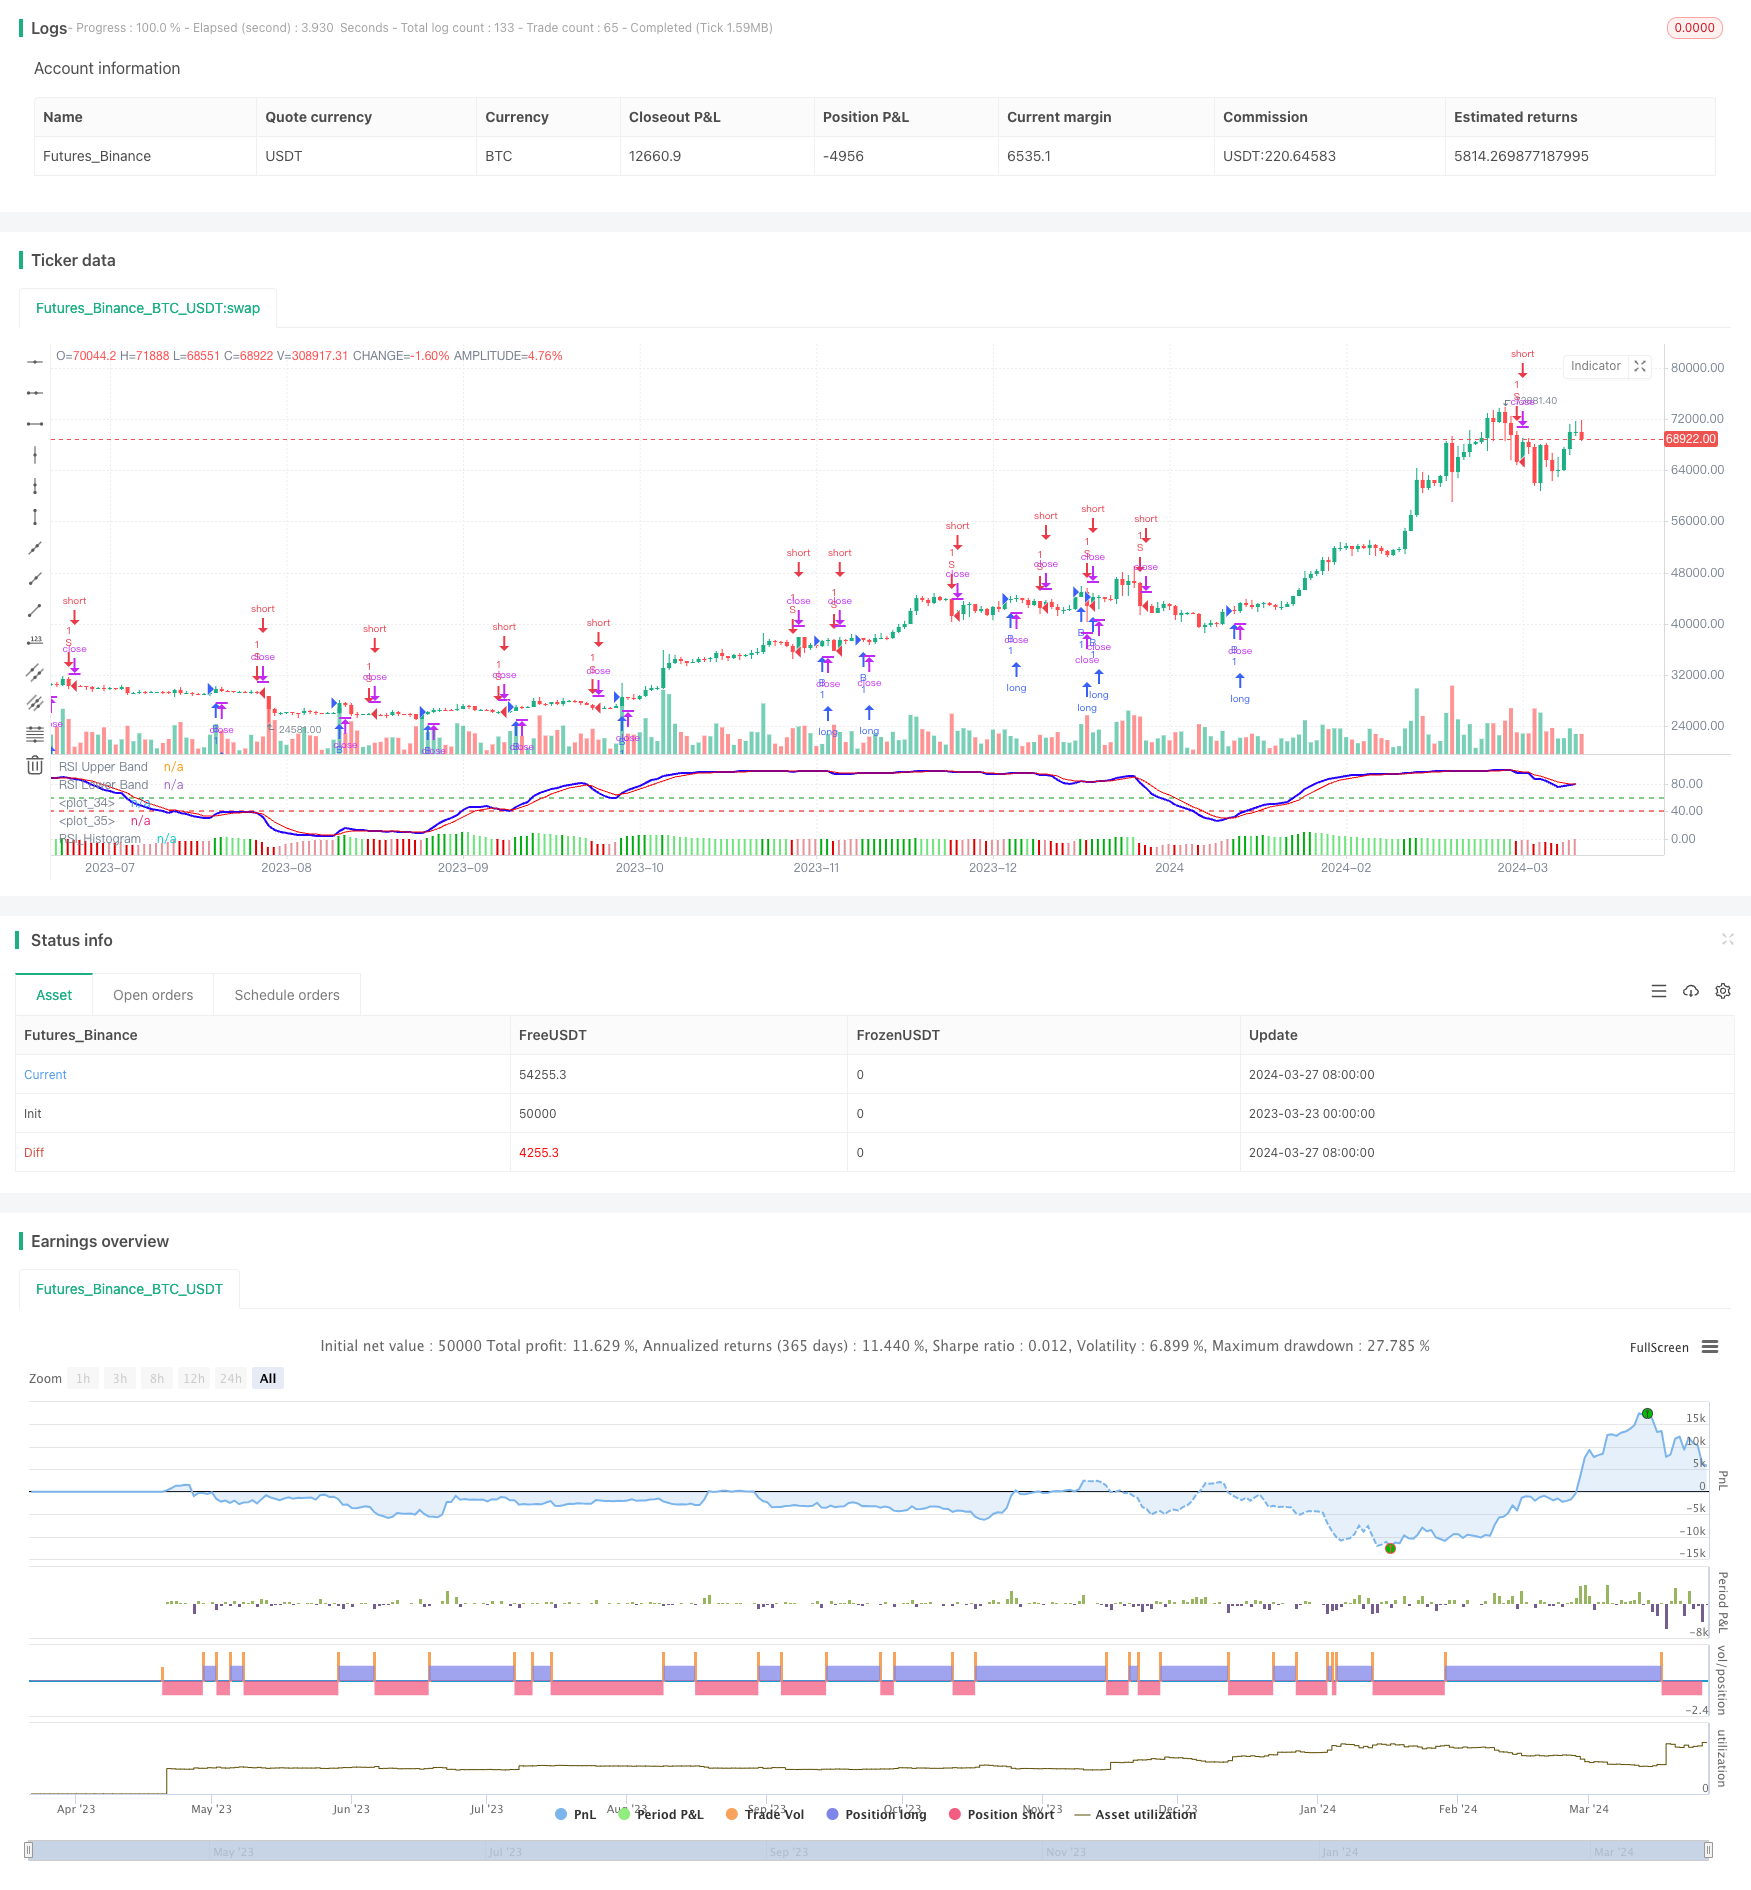
Chiến lược này dựa trên chỉ số Modified RSI để nắm bắt xu hướng thị trường. Ý tưởng chính của chiến lược là sử dụng các tín hiệu chéo và tín hiệu đồ thị thẳng của chỉ số Modified RSI để đánh giá xu hướng thị trường và giao dịch theo hướng xu hướng.
Nguyên tắc chiến lược
- Tính toán giá EMA như là đầu vào của RSI sửa đổi
- Tính toán chỉ số RSI sửa đổi
- Tính toán EMA của RSI sửa đổi như một đường tín hiệu
- Tính phân biệt giữa RSI và đường tín hiệu như một đường thẳng
- Một tín hiệu mua được tạo ra khi đường tín hiệu trên Modified RSI và đường thẳng lớn hơn 0
- Sản xuất tín hiệu bán khi Modified RSI đi qua đường tín hiệu và đường thẳng nhỏ hơn 0
Lợi thế chiến lược
- Chỉ số RSI sửa đổi có thể nắm bắt được xu hướng tốt hơn so với chỉ số RSI truyền thống
- Kết hợp tín hiệu chéo và biểu đồ thẳng của Modified RSI, có thể lọc hiệu quả tín hiệu giả
- Các tham số có thể điều chỉnh, phù hợp với các thị trường và chu kỳ khác nhau
- Quá trình đơn giản, hiệu quả tính toán cao
Rủi ro chiến lược
- Chỉ số RSI được sửa đổi dễ tạo ra tín hiệu sai trong thị trường bất ổn
- Có thể có sự chậm trễ trong việc nắm bắt các bước ngoặt trong xu hướng
- Chỉ số đơn lẻ dễ bị nhiễu bởi tiếng ồn giá
Hướng tối ưu hóa chiến lược
- Có thể kết hợp với các chỉ số xu hướng khác như trung bình di chuyển để tăng độ tin cậy tín hiệu
- Có thể thêm mô-đun dừng lỗ để kiểm soát rủi ro giao dịch đơn lẻ
- Các tham số có thể được tối ưu hóa theo các đặc điểm thị trường khác nhau
- Có thể tham gia vào mô-đun quản lý vị trí, động điều chỉnh vị trí
Tóm tắt
Chiến lược này sử dụng tính năng của chỉ số RSI sửa đổi để xây dựng hệ thống giao dịch từ góc độ theo dõi xu hướng. Chỉ số RSI sửa đổi đã vượt qua một số khuyết điểm của chỉ số RSI truyền thống và khả năng nắm bắt xu hướng tương đối mạnh. Tuy nhiên, chiến lược chỉ số đơn thường có hạn chế và cần được cải thiện kết hợp với các phương tiện kỹ thuật khác.
Mã nguồn chiến lược
/*backtest
start: 2023-03-23 00:00:00
end: 2024-03-28 00:00:00
period: 1d
basePeriod: 1h
exchanges: [{"eid":"Futures_Binance","currency":"BTC_USDT"}]
*/

// This source code is subject to the terms of the Mozilla Public License 2.0 at https://mozilla.org/MPL/2.0/
// © YogirajDange

//@version=5


// Verical lines


// // Define the times
// t1 = timestamp(year, month, dayofmonth, 09, 15) // 9:15
// t2 = timestamp(year, month, dayofmonth, 11, 15) // 11:15
// t3 = timestamp(year, month, dayofmonth, 13, 15) // 1:15
// t4 = timestamp(year, month, dayofmonth, 15, 25) // 3:25

// // Check if the current bar is on the current day
// is_today = (year(time) == year(timenow)) and (month(time) == month(timenow)) and (dayofmonth(time) == dayofmonth(timenow))

// // Draw a vertical line at each time
// if is_today and (time == t1 or time == t2 or time == t3 or time == t4)
//     line.new(x1 = bar_index, y1 = low, x2 = bar_index, y2 = high, extend = extend.both, color=color.red, width = 1)

strategy('Modified RSI')
col_grow_above = input(#02ac11, "Above   Grow", group="Histogram", inline="Above")
col_fall_above = input(#6ee47d, "Fall", group="Histogram", inline="Above")
col_grow_below = input(#e5939b, "Below Grow", group="Histogram", inline="Below")
col_fall_below = input(#dd0000, "Fall", group="Histogram", inline="Below")
EMA_length = input.int(13, 'Price_EMA', minval=1)
RSI_length = input.int(14, 'RSI_Period', minval=1)
Avg_length = input.int(5, 'RSI_Avg_EMA', minval=1)
fastMA = ta.ema(close, EMA_length)
modrsi = ta.rsi(fastMA, RSI_length)
RSIAVG = ta.ema(modrsi, Avg_length)
plot(modrsi, color=color.rgb(38, 0, 255), linewidth=2)
plot(RSIAVG, color=color.rgb(247, 0, 0))
rsiUpperBand = hline(60, 'RSI Upper Band', color=#099b0e)
//hline(50, "RSI Middle Band", color=color.new(#787B86, 50))
rsiLowerBand = hline(40, 'RSI Lower Band', color=#e90101)

RSI_hist = modrsi - RSIAVG

//plot(RSI_hist,"RSI_Histogram", color = #c201e9, style = plot.style_columns,linewidth= 5)

plot(RSI_hist, title="RSI_Histogram", style=plot.style_columns, color=(RSI_hist>=0 ? (RSI_hist[1] < RSI_hist ? col_grow_above : col_fall_above) : (RSI_hist[1] < RSI_hist ? col_grow_below : col_fall_below)))


/////// Moving Averages 20 50 EMA

fast_ma = input.int(20, minval=2, title="Fast_EMA")
slow_ma = input.int(50, minval=2, title="Slow_EMA")

src = input.source(close, title="Source")

out = ta.ema(src, fast_ma)
out1 = ta.ema(src, slow_ma)

//plot(out, title="20 EMA", color=color.rgb(117, 71, 247), linewidth = 2)
//plot(out1, title="50 EMA", color=color.rgb(0, 0, 0), linewidth = 2)


longCondition = ((ta.crossover(modrsi, RSIAVG)) and (RSI_hist > 0))
if longCondition
    strategy.entry('B', strategy.long)

shortCondition = ((ta.crossunder(modrsi, RSIAVG)) and (RSI_hist < 0))
if shortCondition
    strategy.entry('S', strategy.short)