
Tổng quan
Đây là một hệ thống giao dịch theo dõi xu hướng dựa trên nhiều chỉ số, kết hợp nhiều chỉ số kỹ thuật như đường trung bình di chuyển (EMA), chỉ số MACD, chỉ số RSI và phân tích khối lượng giao dịch. Chiến lược này thực hiện giao dịch khi xu hướng thị trường rõ ràng bằng cách phân tích mối quan hệ giữa đường trung bình di chuyển ngắn hạn, trung hạn và dài hạn, kết hợp chỉ số động lượng và xác nhận khối lượng giao dịch. Hệ thống cũng giới thiệu phân tích vị trí hỗ trợ và kháng cự, tiếp tục cải thiện độ chính xác của giao dịch.
Nguyên tắc chiến lược
Chiến lược này dựa trên các yếu tố cốt lõi sau:
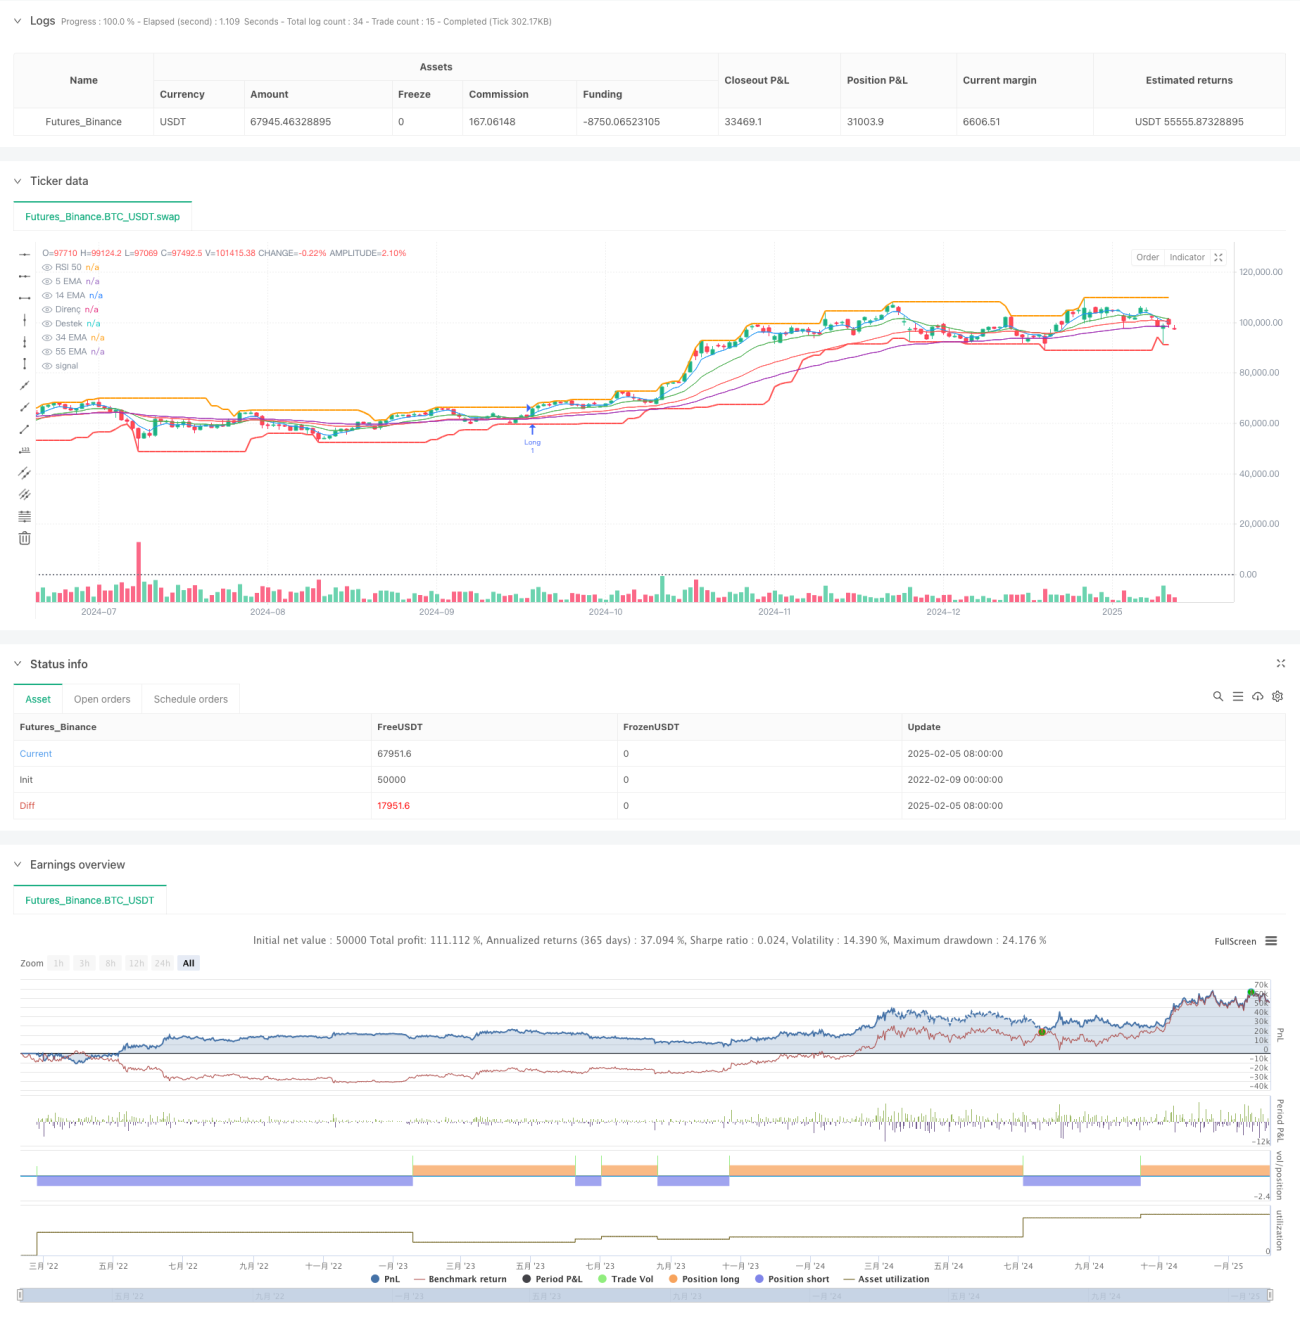
- Hệ thống EMA đa: sử dụng EMA 5, 14, 34 và 55 chu kỳ, xác định hướng xu hướng bằng cách sắp xếp đường trung bình. Khi đường trung bình ngắn hạn nằm trên đường trung bình dài hạn, nó được coi là xu hướng tăng; ngược lại là xu hướng giảm.
- Chỉ số MACD: được sử dụng để xác nhận động lực thị trường. Khi MACD biểu đồ cột là tích cực, cho thấy động lực tăng mạnh mẽ; khi giá trị âm là động lực giảm mạnh mẽ.
- Chỉ số RSI: là một chỉ số xác nhận thị trường mạnh yếu. RSI lớn hơn 50 cho thấy thị trường đang ở khu vực mạnh và nhỏ hơn 50 cho thấy thị trường đang ở khu vực yếu.
- Phân tích khối lượng giao dịch: yêu cầu khối lượng giao dịch lớn hơn 1,5 lần so với đường trung bình khối lượng giao dịch 20 chu kỳ, đảm bảo thị trường có đủ hoạt động giao dịch.
- Mức kháng cự hỗ trợ: Xác định mức kháng cự hỗ trợ ngắn hạn bằng cách tính toán giá cao nhất và giá thấp nhất trong 20 chu kỳ.
Lợi thế chiến lược
- Phân tích đa chiều: Giảm nguy cơ của tín hiệu sai bằng cách kết hợp nhiều chỉ số kỹ thuật.
- Xác định xu hướng: Sử dụng hệ thống đa đường trung bình để đánh giá chính xác hơn xu hướng thị trường.
- Xác minh động lực: Sử dụng sự kết hợp của MACD và RSI, xác nhận xu hướng và tránh theo đuổi xu hướng.
- Kết hợp giá cả và số lượng: Việc kết hợp số lượng giao dịch như một điều kiện cần thiết để xác nhận giao dịch, làm tăng độ tin cậy của giao dịch.
- Kiểm soát rủi ro: Cung cấp thông tin tham khảo cho việc ngăn chặn thiệt hại bằng cách phân tích vị trí kháng cự hỗ trợ.
Rủi ro chiến lược
- Rủi ro của thị trường biến động: có thể tạo ra các tín hiệu sai lệch thường xuyên trong thị trường biến động ngang.
- Rủi ro tụt hậu: Chiến lược có một số tụt hậu do sử dụng nhiều đường trung bình di chuyển.
- Rủi ro chi phí: giao dịch thường xuyên có thể dẫn đến chi phí giao dịch cao hơn.
- Tùy thuộc vào môi trường thị trường: Chiến lược hoạt động tốt trong thị trường có xu hướng mạnh, nhưng có thể hoạt động kém trong các môi trường khác.
Hướng tối ưu hóa chiến lược
- Tối ưu hóa tham số: Bạn có thể theo dõi dữ liệu lịch sử để tối ưu hóa tham số chu kỳ của từng chỉ số.
- Tối ưu hóa dừng lỗ: thêm cơ chế dừng lỗ động, chẳng hạn như dừng theo dõi hoặc dừng dựa trên ATR.
- Phân loại môi trường thị trường: thêm mô-đun phán đoán môi trường thị trường, sử dụng các tham số giao dịch khác nhau trong các môi trường thị trường khác nhau.
- Bộ lọc tín hiệu: tăng bộ lọc cường độ xu hướng để tránh giao dịch trong môi trường xu hướng yếu.
- Quản lý vị trí: giới thiệu cơ chế quản lý vị trí động, điều chỉnh tỷ lệ giữ vị trí theo cường độ tín hiệu.
Tóm tắt
Chiến lược này là một hệ thống theo dõi xu hướng tổng hợp, sử dụng nhiều chỉ số kỹ thuật kết hợp, đồng thời có khả năng kiểm soát rủi ro để đảm bảo độ tin cậy của giao dịch. Điểm mạnh cốt lõi của chiến lược là phương pháp phân tích đa chiều của nó, nhưng cũng cần chú ý đến tác động của môi trường thị trường đối với hiệu suất của chiến lược.
- 1