概述
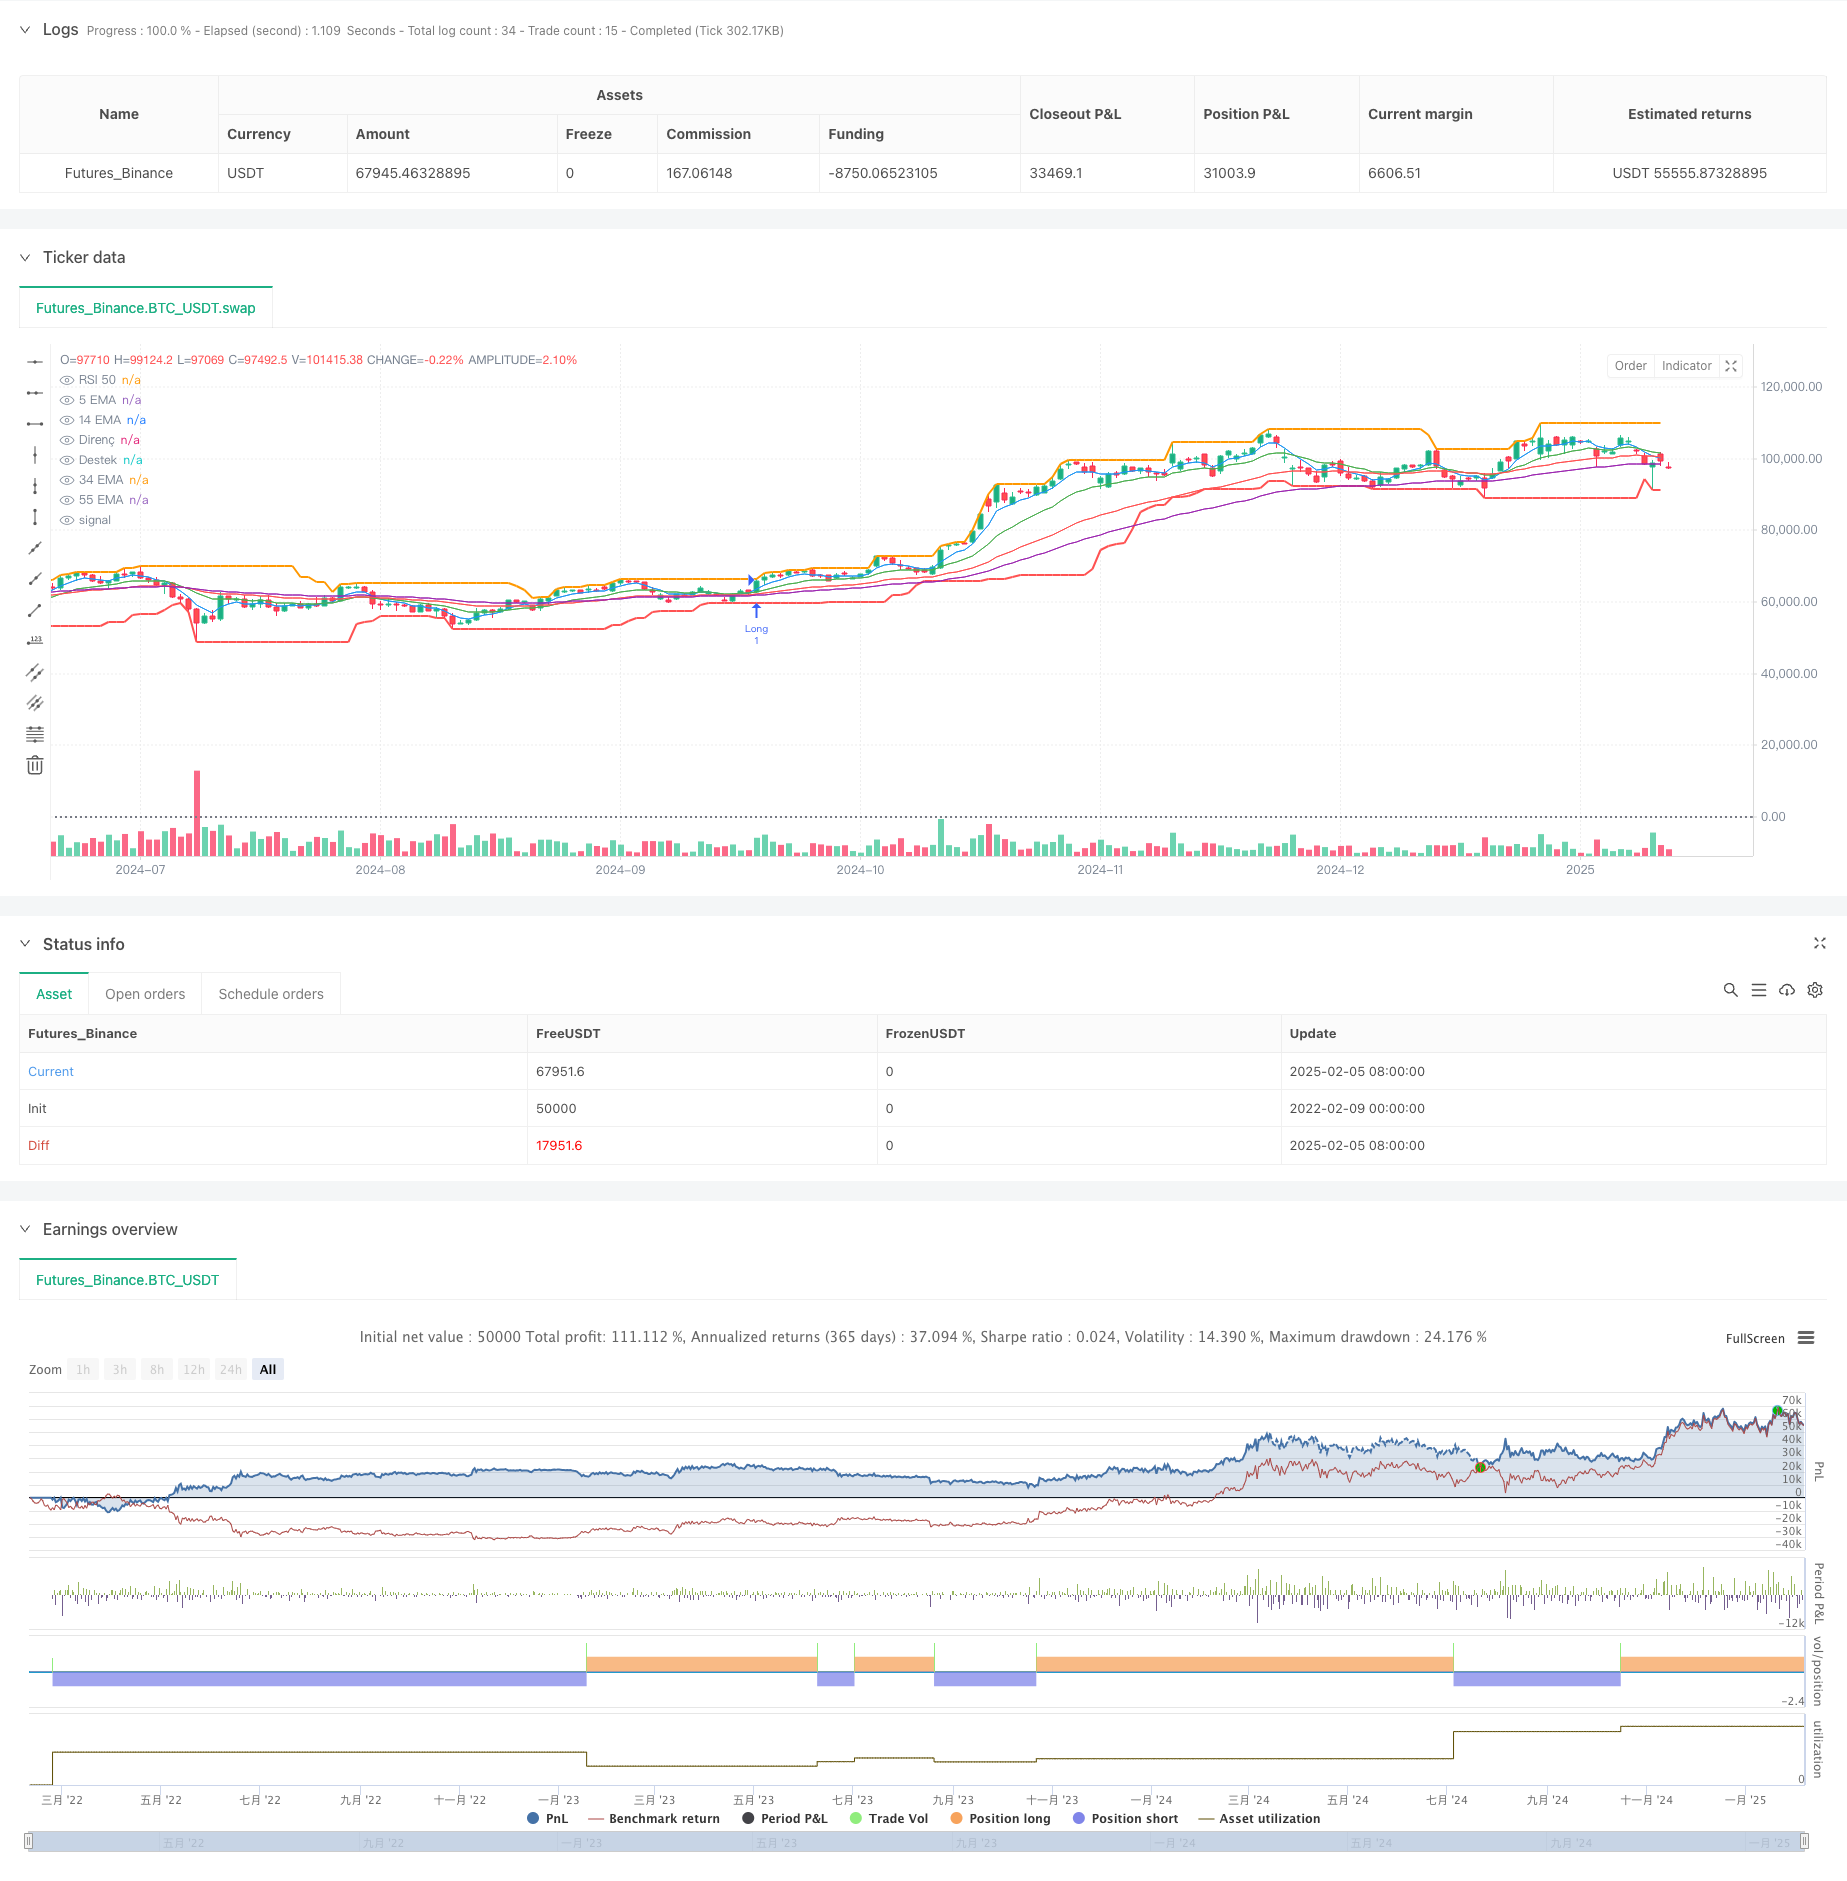
这是一个基于多重指标的趋势跟踪交易系统,结合了移动平均线(EMA)、MACD指标、RSI指标以及成交量分析等多个技术指标。该策略通过分析短期、中期和长期移动平均线之间的关系,结合动量指标和成交量确认,在市场趋势明确的情况下进行交易。系统还引入了支撑位和阻力位分析,进一步提高了交易的准确性。
策略原理
策略基于以下几个核心要素: 1. 多重EMA系统:使用5、14、34和55周期的EMA,通过均线的排列确认趋势方向。当短周期均线位于长周期均线之上时,视为上升趋势;反之则为下降趋势。 2. MACD指标:用于确认市场动量。当MACD柱状图为正值时,表明上升动量较强;为负值时表明下降动量较强。 3. RSI指标:作为市场强弱的确认指标。RSI大于50表示市场处于强势区域,小于50表示市场处于弱势区域。 4. 成交量分析:要求成交量大于20周期成交量均线的1.5倍,确保市场有足够的交易活跃度。 5. 支撑阻力位:通过计算20个周期的最高价和最低价来确定短期支撑阻力位。
策略优势
- 多维度分析:通过结合多个技术指标,降低了假信号的风险。
- 趋势确认:使用多重均线系统,能够更准确地判断市场趋势。
- 动量验证:通过MACD和RSI的配合使用,既确认趋势又避免追高杀低。
- 量价结合:将成交量作为交易确认的必要条件,提高了交易的可靠性。
- 风险控制:通过支撑阻力位的分析,为止损止盈提供了参考。
策略风险
- 震荡市场风险:在横盘震荡市场中可能产生频繁的假信号。
- 滞后性风险:由于使用了多个移动平均线,策略存在一定的滞后性。
- 成本风险:频繁交易可能带来较高的交易成本。
- 市场环境依赖:策略在强趋势市场表现较好,但在其他市场环境下可能表现欠佳。
策略优化方向
- 参数优化:可以通过历史数据回测,优化各个指标的周期参数。
- 止损优化:增加动态止损机制,如跟踪止损或基于ATR的止损。
- 市场环境分类:增加市场环境判断模块,在不同市场环境下使用不同的交易参数。
- 信号过滤:增加趋势强度过滤器,避免在弱趋势环境下交易。
- 仓位管理:引入动态仓位管理机制,根据信号强度调整持仓比例。
总结
该策略是一个综合性的趋势跟踪系统,通过多重技术指标的配合使用,在保证交易可靠性的同时也具备了一定的风险控制能力。策略的核心优势在于其多维度的分析方法,但同时也需要注意市场环境对策略表现的影响。通过持续优化和完善,该策略有望在实际交易中取得更好的表现。
策略源码
/*backtest
start: 2022-02-09 00:00:00
end: 2025-02-06 08:00:00
period: 1d
basePeriod: 1d
exchanges: [{"eid":"Futures_Binance","currency":"BTC_USDT"}]
*/

//@version=5
strategy("Advanced EMA + MACD + RSI Strategy with Support/Resistance", overlay=true)

// Parametreler
shortEMA = input(5, title="Kısa Vadeli EMA (5)")
mediumEMA = input(14, title="Orta Vadeli EMA (14)")
longEMA = input(34, title="Uzun Vadeli EMA (34)")
extraLongEMA = input(55, title="Ekstra Uzun Vadeli EMA (55)")
rsiLength = input(14, title="RSI Periyodu")
macdShortLength = input(12, title="MACD Kısa Periyot")
macdLongLength = input(26, title="MACD Uzun Periyot")
macdSignalLength = input(9, title="MACD Signal Periyot")
volumeMultiplier = input(1.5, title="Hacim Çarpanı")

// EMA Hesaplamaları
ema5 = ta.ema(close, shortEMA)
ema14 = ta.ema(close, mediumEMA)
ema34 = ta.ema(close, longEMA)
ema55 = ta.ema(close, extraLongEMA)

// MACD Hesaplamaları
[macdLine, signalLine, _] = ta.macd(close, macdShortLength, macdLongLength, macdSignalLength)
macdHist = macdLine - signalLine

// RSI Hesaplaması
rsi = ta.rsi(close, rsiLength)

// Destek ve Direnç Hesaplamaları (en yüksek ve en düşük değerler)
highestHigh = ta.highest(high, 20)
lowestLow = ta.lowest(low, 20)

// Hacim Kontrolü
avgVolume = ta.sma(volume, 20)
volumeCondition = volume > avgVolume * volumeMultiplier

// Alım ve Satım Koşulları
longCondition = ema5 > ema14 and ema14 > ema34 and ema34 > ema55 and close > ema34 and macdHist > 0 and rsi > 50 and volumeCondition
shortCondition = ema5 < ema14 and ema14 < ema34 and ema34 < ema55 and close < ema34 and macdHist < 0 and rsi < 50 and volumeCondition

// Alım ve Satım İşlemleri
if (longCondition)
    strategy.entry("Long", strategy.long)

if (shortCondition)
    strategy.entry("Short", strategy.short)

// Grafik Üzerinde Göstergeler
plot(ema5, color=color.blue, title="5 EMA")
plot(ema14, color=color.green, title="14 EMA")
plot(ema34, color=color.red, title="34 EMA")
plot(ema55, color=color.purple, title="55 EMA")
hline(50, "RSI 50", color=color.gray, linestyle=hline.style_dotted)
plot(highestHigh, color=color.orange, title="Direnç", linewidth=2)
plot(lowestLow, color=color.red, title="Destek", linewidth=2)
相关推荐